Fishbone Diagram Template
Visualize the potential causes of a problem to solve it collaboratively using an Ishikawa Fishbone Diagram Template.
About the Fishbone Diagram Template
The fishbone diagram template (also known as an Ishikawa fishbone template or a fishbone analysis template) is a ready-to-use template you can easily customize in Miro with your team. Filling in the template helps you quickly create a fishbone diagram — a visual tool for conducting root cause analysis. By exploring all of a problem’s possible causes, your team can use Miro’s fishbone template to identify underlying issues, anticipate consequences, target opportunities for improvement, and get on the same page about how to move forward.
How to create a fishbone diagram using Miro’s template
You can easily fill in Miro’s fishbone diagram template with your team — both in real-time and asynchronously. To get started, scroll to the top of this page and click on the blue “Use template” button. That’ll open the fishbone template up in Miro and allow you to start inviting any collaborators to join you on the board.
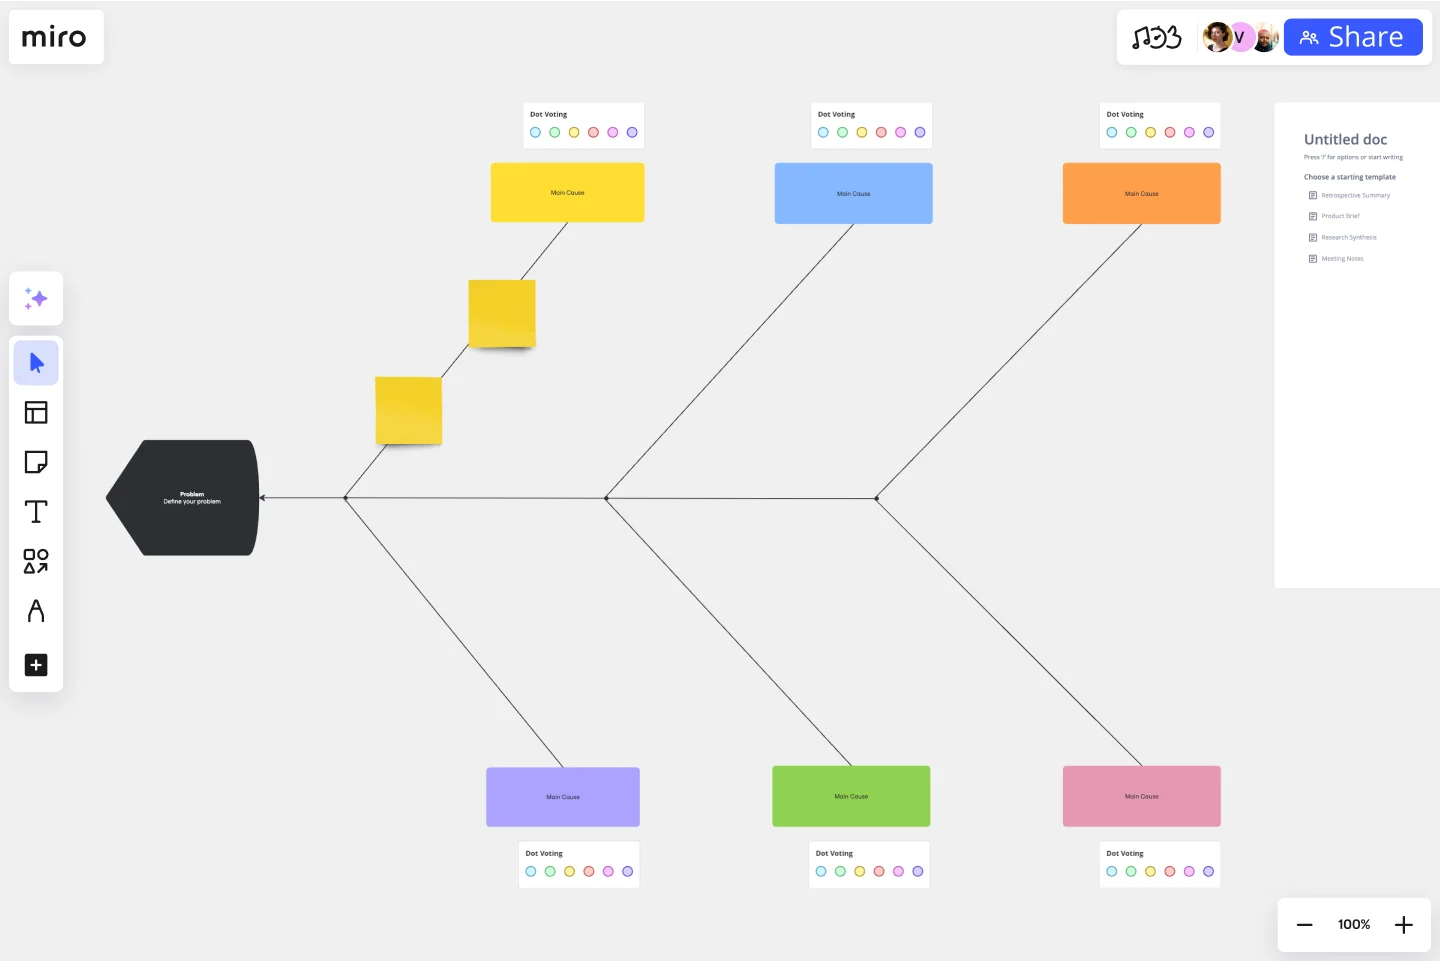
Once you’re in, you’ll notice that the fishbone diagram template is split into four main sections: the fishbone diagram itself, a brainstorming activity, a voting activity, and an opportunity to identify outcomes or next steps. As you move through each section, you’ll get closer and closer to identifying the root causes. So let’s talk about how to fill each section in.
Here are 5 steps to guide you through Miro’s fishbone diagram template:
1. Add the problem statement
Let’s start at the large triangle on the left-hand side of the fishbone diagram — the fish head. This is where we’ll state the overarching problem we’re trying to explore using the fishbone diagram template. You’ll notice that Miro’s template comes with pre-written text here. To replace the text with your own, simply double-click on it to start editing.
The statement in the fish head should clearly explain what the problem is, ideally including how and when it occurs. Make sure your team agrees on the problem statement – including how you’ve defined it – before filling out the rest of the fishbone analysis template. This first step should take you around 15 minutes.
2. Highlight the main causes
Let’s explore the main causes behind the problem. Remember, we’ll get to the root causes toward the end of completing the fishbone diagram template. Right now, just think of the immediate reasons behind the issue. For example, if you’re thinking about why a car won’t start, one main cause could be a dead battery. The reason the battery’s dead, to begin with, would be your root cause.
When you’ve identified a few main causes behind your problem, add them to the six colored rectangles with rounded corners — the ones along the edges of the fishbone diagram. Just double-click on the rectangle you want to edit and start adding your own text. This step should take you about 10 minutes.
3. Brainstorm root causes
Time to identify the root causes. To help you and your team get on the same page, scroll down on the fishbone diagram template to the section titled “root causes”. Take 10 minutes with your team to brainstorm several possible root causes behind your main causes, and write them down on the sticky notes. To keep track of time, use the built-in timer at the top of your Miro Board.
You can also complete this part of the fishbone diagram template using the 5 Whys framework, which helps you dig deeper into issues and uncover new potential causes. When you’re all done, click and drag your root causes onto the fishbone diagram and arrange them along the fishbones connected to the relevant main causes. To remove the fishbone template’s pre-filled sticky notes, click on them and press “delete” on your keyboard.
4. Vote on the most pressing issues
Now that you’ve identified both your main and root causes, vote on the issues that matter most to you with your team. Scroll to the section on the fishbone diagram template labeled “voting” and replace the pre-filled team names with your own. Start a 5-minute timer in your Miro Board, giving each of you time to drag your colored dots onto the sticky notes you want to vote for.
5. Agree on next steps
Time to wrap up your Ishikawa diagram. Head to the “Outcome” section of the fishbone template and talk to your team about the next steps. We’ve divided this section into three columns of sticky notes: next step, name, and deadline. Fill the sticky notes below each of these column headers to identify key action steps you’d like to take, who should be responsible for it, and when you’d like to get it done. Completing this section of the fishbone diagram template will help you mitigate your problem.
Tip: If you're solving a particularly complicated problem or need a more customizable space for root-cause analysis, jump into the fishbone diagram maker to build your own Ishikawa diagram from scratch.
Another approach worth keeping in mind when completing the fishbone template is the 6Ms of Production:
Manpower: Consider any labor issues
Methods: Consider any production and delivery issues
Machinery: Consider your infrastructure
Mother Nature: Consider any unpredictable and uncontrollable environmental issues
Materials: Consider raw materials, inputs, consumables
Measurement: Consider your current standards for measuring progress.
Benefits of using a fishbone diagram template
There are several advantages to using a fishbone analysis template. Here are a few to keep in mind:
Focus on a cause rather than symptoms
Using a fishbone diagram template helps you visualize multiple layers of causes behind a problem. It helps you go beyond a problem’s immediate reasons by exploring the causes behind them. For example, you might know that a car isn’t starting because its battery is dead. But understanding what caused the dead battery in the first place allows you to dig deeper into the situation.
See all potential causes at a glance
Because a fishbone template displays multiple layers of causes, it helps you and your team develop a big-picture view of the problem, allowing you to consider more long-term solutions instead of only resolving it temporarily. This isn’t just useful for you and your teammates but also for presenting to stakeholders and clients.
Get your team on the same page
Using a fishbone template requires careful thinking, which means it’s important to consider as many angles to your problem as possible. That’s where gathering your teammates isn’t just handy but also an ideal part of completing the fishbone diagram template. Getting multiple perspectives on a problem not only saves you time from having to identify its root cause yourself but allows you to arrive at one more accurately.
Fishbone diagram template example
Miro’s fishbone diagram template comes pre-filled with a clear example of how to use it to conduct a root cause analysis. In this example, the problem statement is: “Why do people cancel subscriptions to our platform?” You’ll find this statement in the fish head — the triangle on the far left of the fishbone diagram itself.
From here, it’s about identifying the main causes, which you’ll find in the colored rectangles along the edges of the fishbones:
Price too high
System not stable
Not enough staff
Lack of insights
Lack of strategy
Along the bones themselves, you’ll find the root causes behind these main problems. It’s crucial to complete this step thoroughly when conducting a fishbone diagram analysis. Each main cause we’ve identified in the fishbone template comes with a number of root causes. The root cause behind the main cause, “Price too high,” includes: “Competitors offer a lower price” and “People are not in need of a higher tier.”
This is just one way to use a fishbone diagram. Regardless of the problem you’re exploring in using the fishbone template, it’s all about understanding why the main causes exist in the first place.
Once you’ve completed the fishbone diagram, vote to identify what each team member believes is the root cause. After discussion and debate, the underlying causes should be much clearer.
When should I use a fishbone diagram template?
You can use Miro’s fishbone diagram template for any situation where you need to understand all of a problem’s contributing factors — such as when you’re looking to control product quality, improve customer services, or optimize project management workflows. Using Miro’s fishbone template, you’ll get to analyze a problem statement, assess ways to make improvements, and make the right changes.
What are the benefits of using Miro’s fishbone diagram template?
Miro’s template is more than a ready-to-use fishbone diagram. It’s designed to help you brainstorm root causes, vote on issues that matter most, and identify action steps on your way out — all on one infinite canvas. This helps you create an Ishikawa diagram as thoroughly and accurately as possible while establishing a clear sense of direction for your team. With real-time collaboration features, Miro makes it easy for your team to complete the fishbone template together online, even if you aren’t all in the same room. You can also use our built-in timer to stay on track and work efficiently.
How can I draw a fishbone diagram?
Kickstart your team’s problem-solving process with Miro’s ready-to-use fishbone diagram template. Want to build your own? You can also draw a fishbone diagram using shapes, connection lines, sticky notes, and text boxes — all on Miro’s infinite canvas. If you want inspiration for your fishbone diagram, explore more templates in Miroverse.
Get started with this template right now.
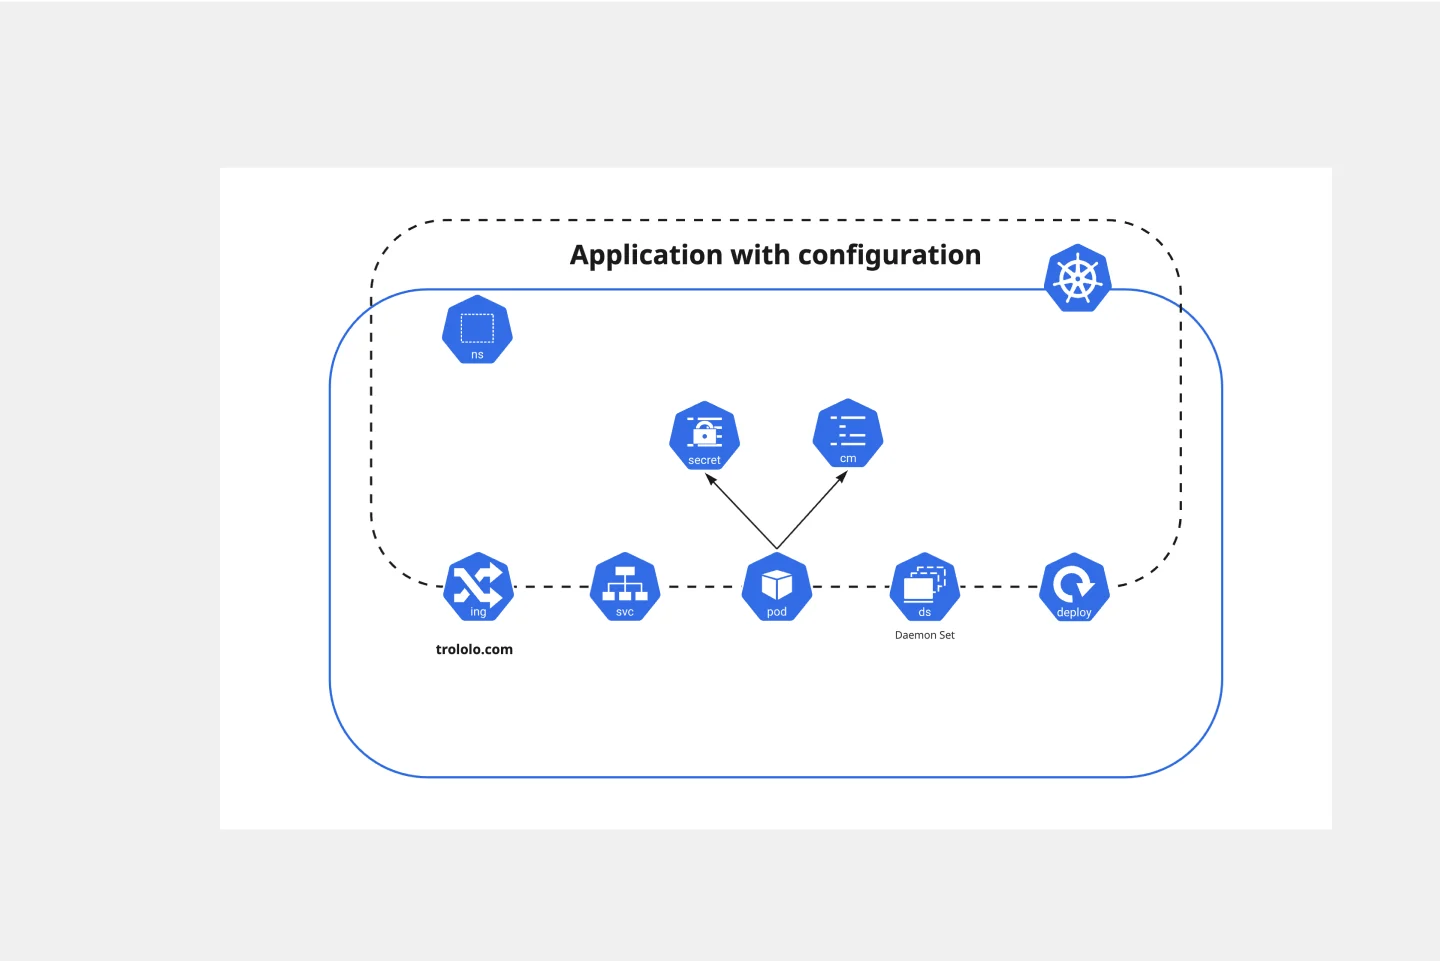
Kubernetes Application Template
Works best for:
Software Development, Diagrams
Use the Kubernetes Application template to manage enterprise-ready containerized applications better. You can now get your team more agile when dealing with portability, licensing, and consolidated billing. The Kubernetes Application template allows you to run deployments anywhere, facilitating the management of your applications. Try it out and see if it’s the best fit for you and your team.
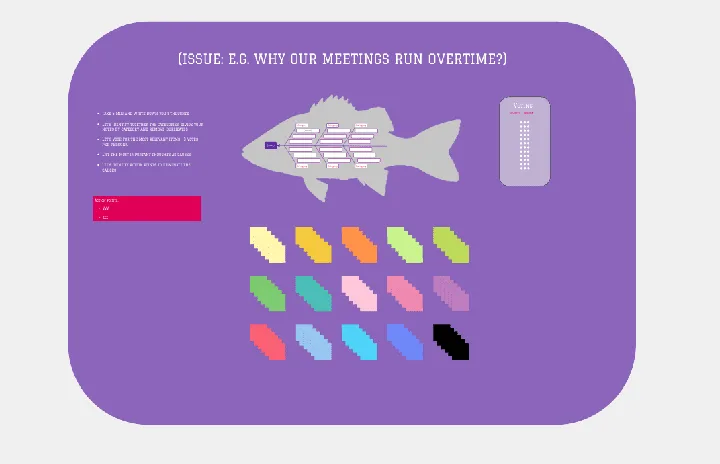
Fishbone Diagram by Hanna Havulinna
Works best for:
Diagramming
The Fishbone Diagram template, also known as the Ishikawa or Cause-and-Effect diagram, offers a visual tool for identifying and analyzing root causes of problems or issues. It provides a structured framework for categorizing potential causes into major categories such as people, process, environment, and equipment. This template enables teams to conduct root cause analysis systematically, facilitating problem-solving and decision-making. By promoting a structured approach to problem analysis, the Fishbone Diagram empowers teams to address issues effectively and implement corrective actions efficiently.

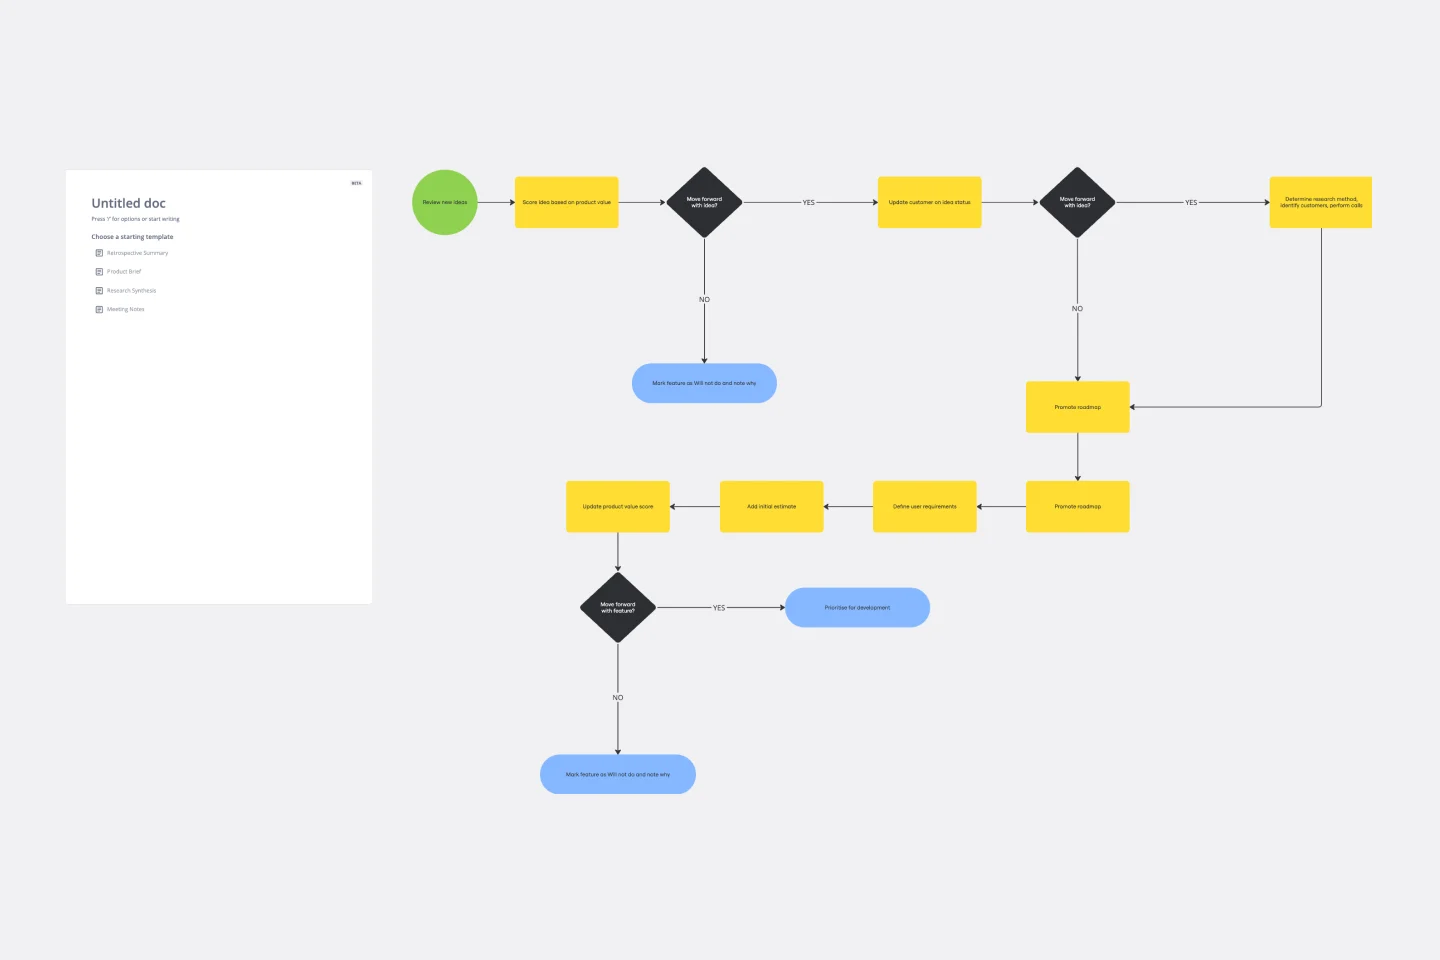
Opportunity Solution Tree Template
Works best for:
Flowcharts, Product Management, Diagrams
Solving problems — successful companies and productive teams just know how to do it. They’re able to identify many possible solutions, then settle on the one that leads to the desired outcome. That’s the power an Opportunity Solution Tree gives you. Designed by Teresa Torres, a product discovery coach, this mind map breaks down your desired outcome into opportunities for the product to meet user needs, then gives your team an effective way to brainstorm potential solutions.

Causal Loop Diagrams (1.0)
Works best for:
Diagramming
The Causal Loop Diagrams (1.0) template offers a visual tool for modeling complex systems and understanding the feedback loops that drive behavior. It provides a structured framework for identifying causal relationships, reinforcing loops, and balancing feedback within a system. This template enables teams to analyze system dynamics, anticipate unintended consequences, and formulate effective strategies for intervention. By promoting systems thinking and understanding of interdependencies, Causal Loop Diagrams empower organizations to navigate complexity and drive sustainable change.
Workflow Diagram Template
Works best for:
Diagramming, Mapping, Process mapping
The Workflow Diagram Template maps out and represents processes or systems using standardized symbols and shapes. By delineating the various steps or stages in a process, it ensures that tasks flow seamlessly from initiation to completion. One of the standout benefits of using this template is its clarity. By translating processes into a visual format, all participants can gain a comprehensive understanding at a glance, eliminating confusion and ensuring everyone is on the same page. This clarity not only promotes efficient task execution but also fosters collaboration among team members.
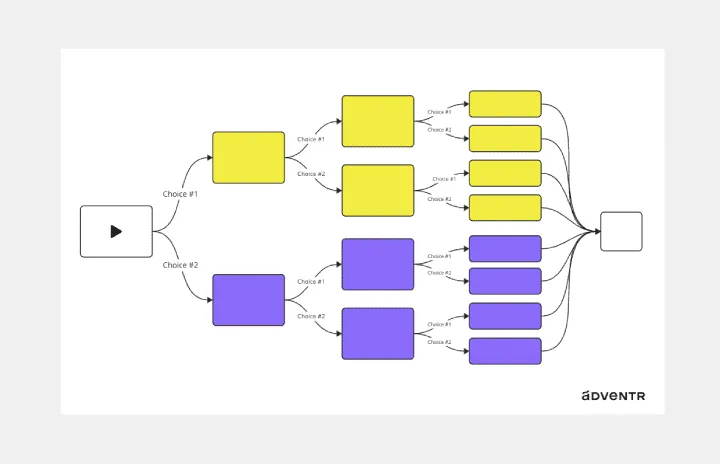
Interactive Video Storyboard Canvas
Works best for:
Diagramming
The Interactive Video Storyboard Canvas template offers a visual framework for planning and storyboarding interactive video content. It provides elements for outlining scenes, defining interactions, and visualizing user pathways. This template enables teams to design engaging and immersive video experiences, facilitating collaboration and alignment among content creators and stakeholders. By promoting creativity and interactivity, the Interactive Video Storyboard Canvas empowers teams to create compelling video narratives that captivate audiences and drive engagement.