Root Cause Analysis (RCA) Template
Empower your team to tackle challenges at their core with Miro's Root Cause Analysis Template. Dive deep, discover, and drive impactful solutions today.
Trusted by 65M+ users and leading companies


About the Root Cause Analysis Template
At Miro, we understand the importance of not just identifying problems but diving deep into their origins. Our Root Cause Analysis (RCA) Template is designed to facilitate this investigative process, ensuring teams find and address the source of their challenges rather than just the symptoms.
What's a Root Cause Analysis Template?
A Root Cause Analysis Template is a structured tool that helps teams and people identify the underlying reasons for problems or events. Instead of merely addressing the immediate, visible symptoms, this template guides users to probe deeper, ensuring long-term solutions.
Benefits of using the Root Cause Analysis Template include:
Effective problem solving: By identifying and addressing the root cause, teams can prevent the recurrence of the same issues.
Cost and time efficiency: Addressing the root cause instead of repeatedly treating symptoms saves time, effort, and resources in the long run.
Improved team collaboration: The structured approach promotes collective brainstorming and cohesive problem-solving among team members.
How to use a Root Cause Analysis Template in Miro?
Using Miro's RCA Template is straightforward. Here's a breakdown of how to complete each section:
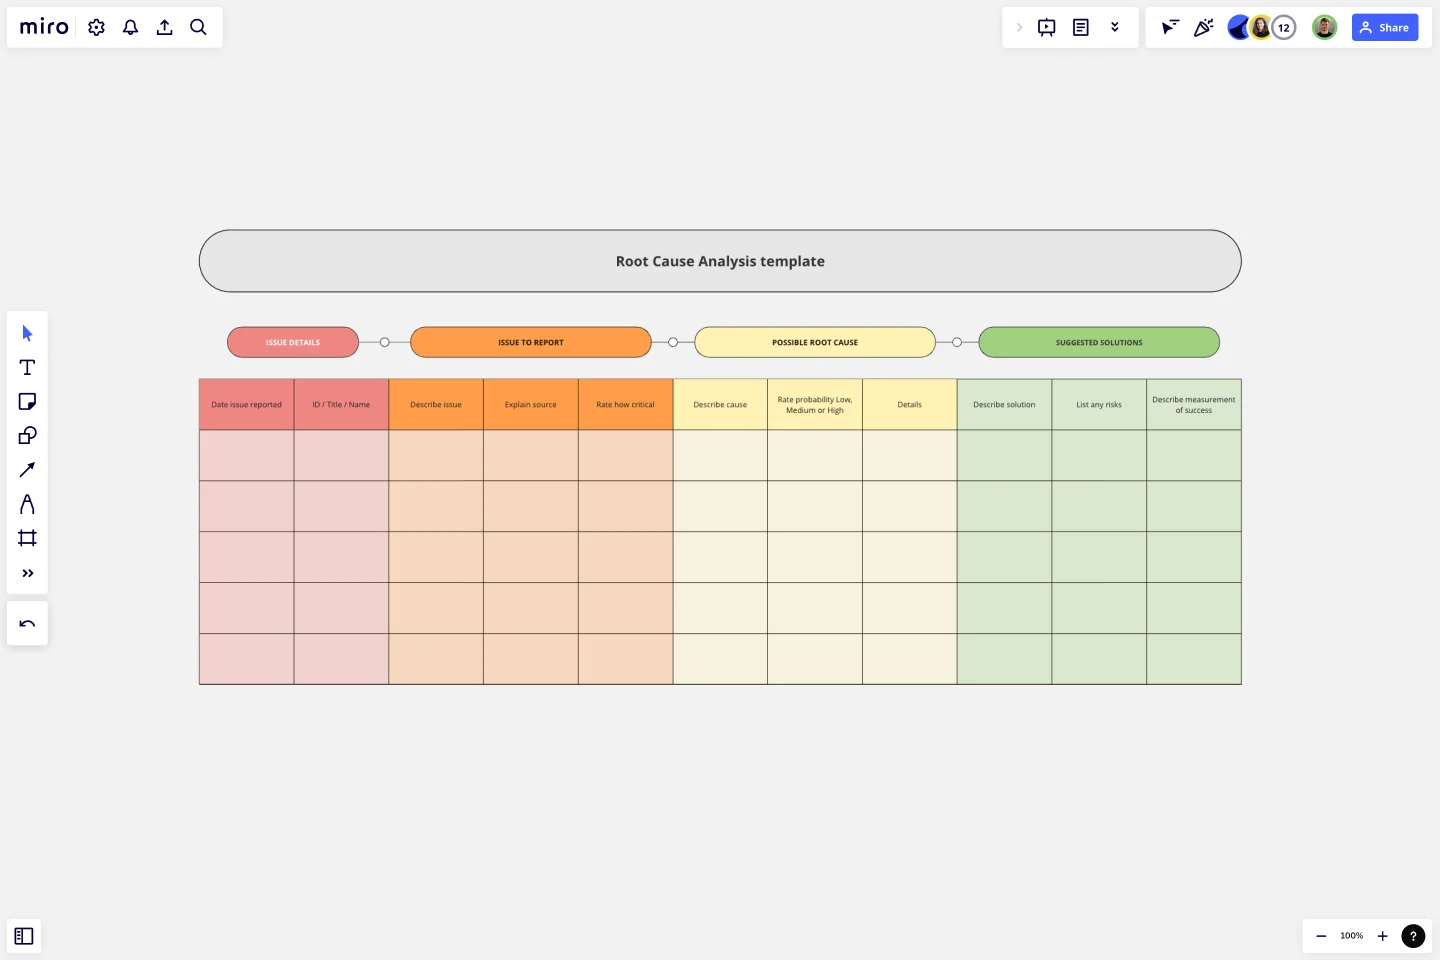
1. Issue details
Begin by detailing the specific problem or event.
Date: Specify when the issue occurred to help track its emergence and potential patterns over time.
ID/Title/Name: Assign a unique identifier, title, or name to the problem for easy referencing and categorization.
2. Issues to report
Highlight any correlated issues or subsequent challenges that emerged from the primary problem. This helps in understanding the breadth and depth of the problem.
Describe the issue: Clearly outline the specifics of the correlated issue or subsequent challenges.
Explain source: Detail where or what triggered the issue, providing context.
Rate how critical: Evaluate the severity of the problem on a scale (e.g., low, medium, high). This helps prioritize and allocate resources accordingly.
3. Possible root cause
Using a brainstorming approach, list all potential reasons that might have led to the issue. Remember, the goal is to delve deep and consider all possibilities.
Describe cause: Enumerate the potential underlying reasons leading to the problem.
Rate probability: Assess the likelihood of each cause being the genuine root issue. Use a low, medium, or high rating to indicate your estimation.
Details: Provide any additional information or context that can shed light on the cause, aiding in its verification and understanding.
4. Suggested solutions
Once potential root causes are identified, propose solutions for each. Think of both immediate remediations and long-term strategies to prevent recurrence.
Describe solutions: Propose potential remedies for each identified root cause.
List any risks: Every solution might have its own challenges. Detail any potential risks or setbacks associated with the proposed remedies.
Describe measurement of success: Define how you will measure the effectiveness of each solution. This could be through KPIs, feedback, reduced issue recurrence, etc.
By systematically completing each field, you'll be on your way to a more holistic understanding of challenges and their solutions with Miro's RCA Template.
How often should I use the RCA Template?
The RCA Template can be used whenever a significant problem arises. It's not just for crisis management; even minor issues can benefit from RCA to avoid them becoming more significant challenges later on.
Can I customize the RCA Template in Miro to fit my team's specific needs?
Yes, the template is designed to be flexible. Adjust fields, add sections, or integrate it with other tools and templates in Miro to make it fit perfectly for your team's workflow.
Do I need special training to use the RCA Template?
No special training is required. The template is designed to be user-friendly and intuitive. However, for those unfamiliar with the concept of root cause analysis, a brief training or orientation might be beneficial to get the most out of the template.
Get started with this template right now.
Wardley Mapping Canvas Template
Works best for:
Leadership, Strategic Planning, Mapping
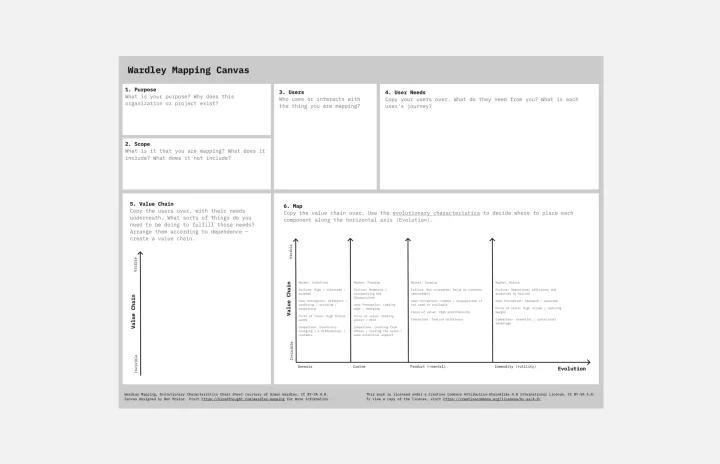
A Wardley Map represents the landscape in which a business operates. It's made up of a value chain (the activities required to fulfill user needs) graphed against the evolution of individual activities over time. You place components with value on the y-axis and commodity on the x-axis. Use a Wardley Map to understand shared assumptions about your environment and discover what strategic options are available. Easily communicate your understanding of the landscape to your team, new hires, and stakeholders.
VRIO Analysis Template
Works best for:
Diagramming, Strategy
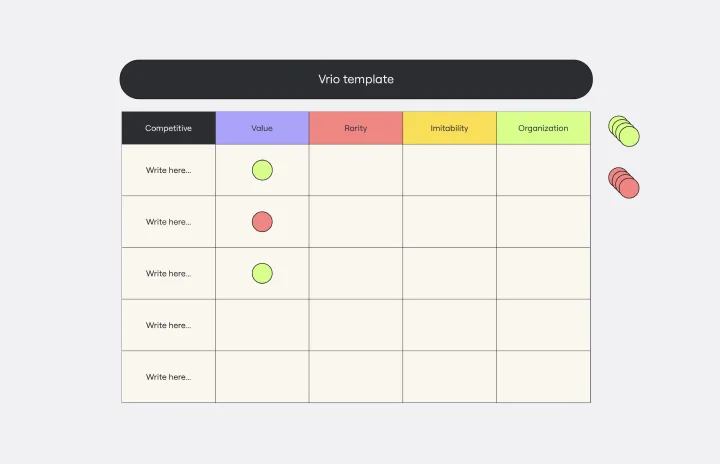
The VRIO Analysis Template is a framework that helps businesses evaluate their resources and capabilities for competitive advantage. It categorizes resources into four areas: Value, Rarity, Imitability, and Organization. This provides a comprehensive view of an organization's strengths and potential weaknesses. The template has the key benefit of offering quick visual insights. Decision-makers can immediately identify and focus on resources that are valuable, rare, hard to imitate, and well-organized. This ensures a sustainable competitive edge and saves time by avoiding lengthy textual analyses.
Value Proposition Template
Works best for:
Strategy & Planning, Product Strategy
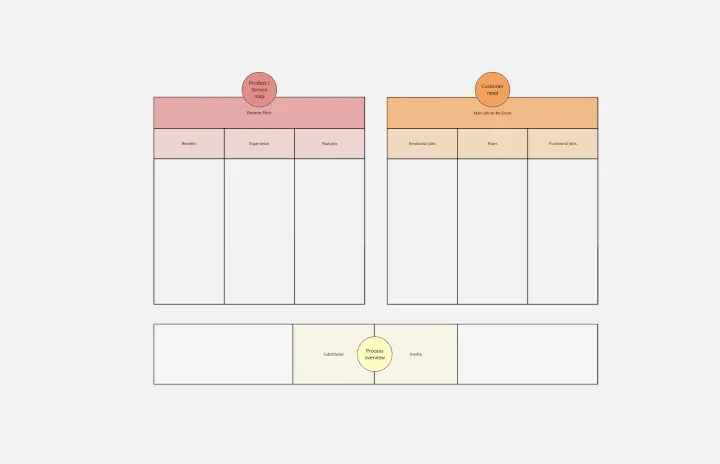
The Value Proposition Template is a framework that empowers businesses to articulate their offerings' core advantages. By breaking down an offering into its essential elements, this template ensures that stakeholders grasp the unique value a product or service brings to the market.
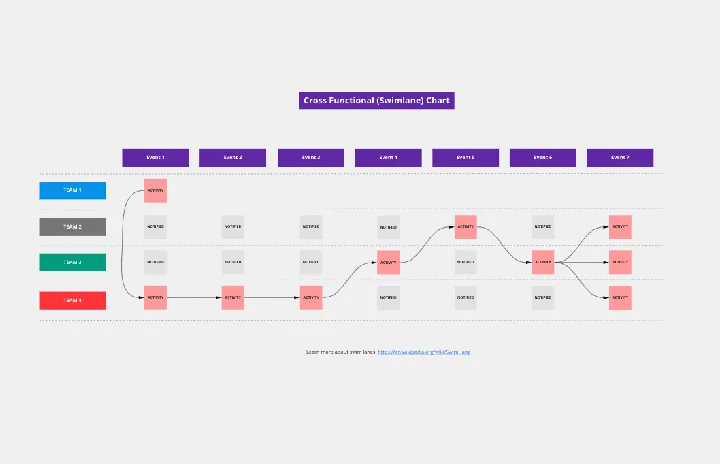
Cross Functional (Swimlane) Chart
Works best for:
Flowcharts, Mapping, Diagrams
The Cross Functional (Swimlane) Chart template offers a visual tool for mapping out processes or workflows with multiple stakeholders or functional areas. It provides swimlanes for organizing tasks and responsibilities by department or role. This template enables teams to visualize process flows, identify handoffs, and improve coordination and collaboration across functions. By promoting transparency and accountability, the Cross Functional (Swimlane) Chart empowers organizations to streamline workflows and drive cross-functional alignment effectively.
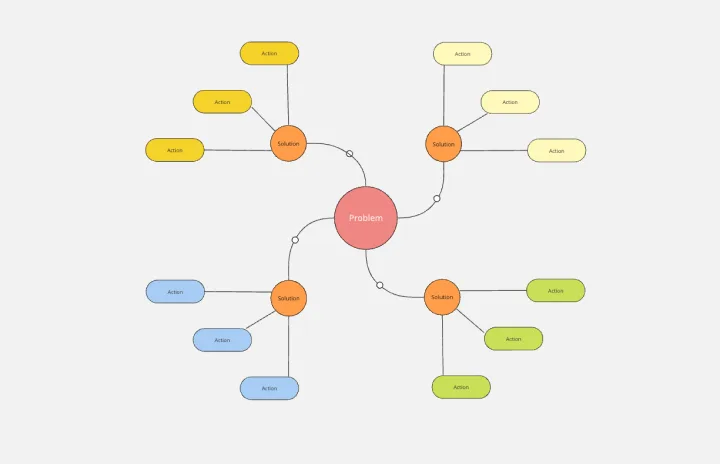
Spider Diagram Template
Works best for:
Diagramming, Mapping
Perfect for brainstorming sessions, project planning, or simply organizing thoughts, the Spider Diagram Template allows you to create 'legs' branching out from a central idea, representing related topics or subtopics.