Opportunity Solution Tree Template
Visualise your opportunities and the decisions you're making along the way
Trusted by 65M+ users and leading companies


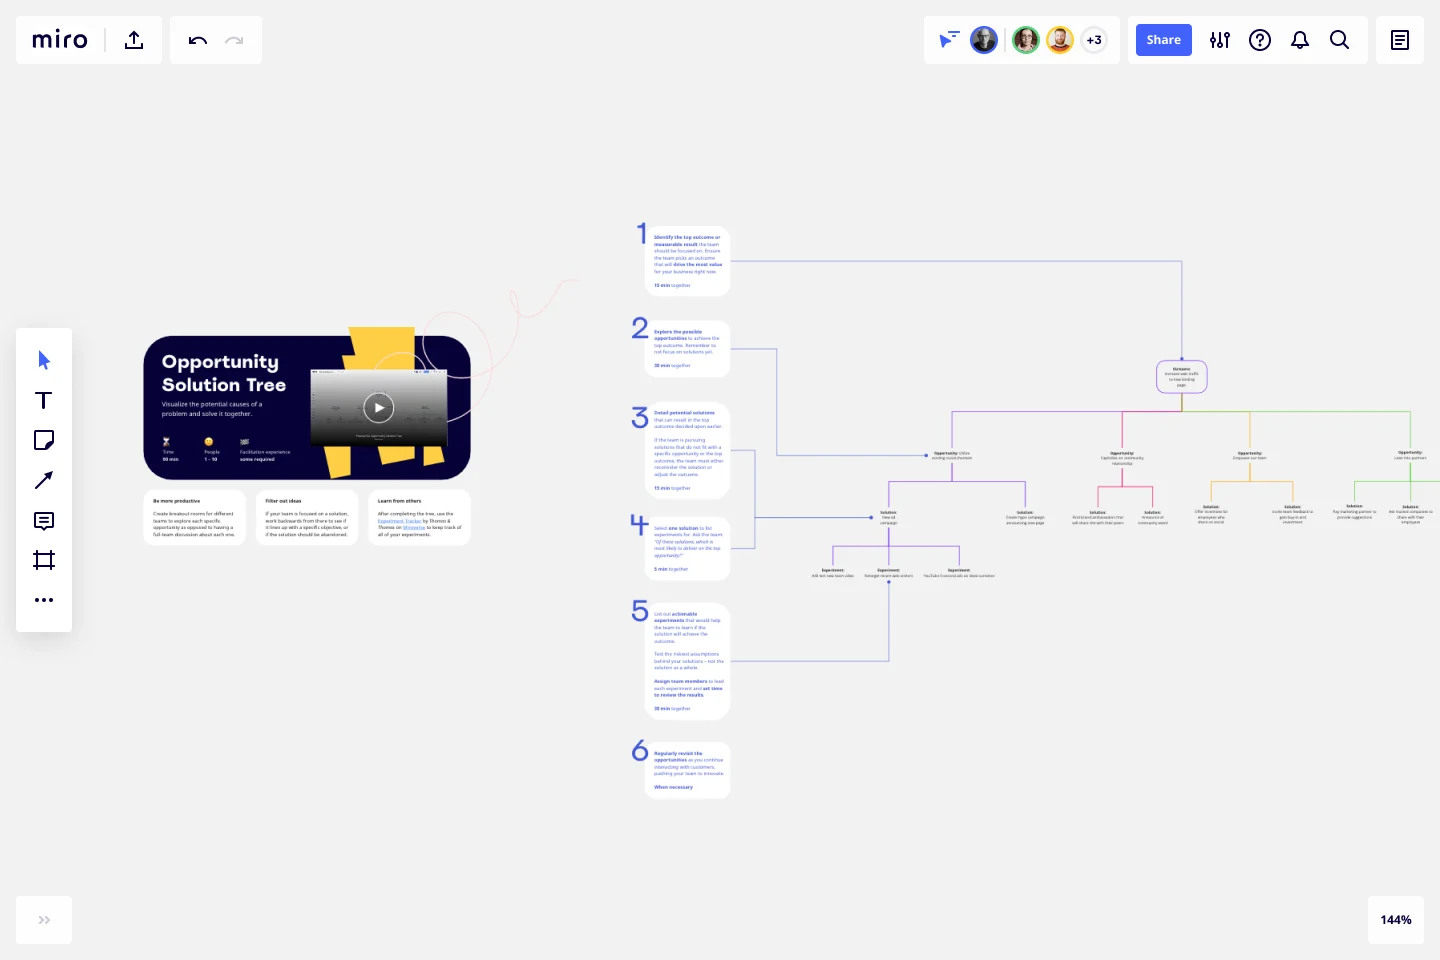
About the Opportunity Solution Tree template
The Opportunity Solution Tree template helps product teams to improve the way they solve problems and reach their desired outcomes. Designed by Teresa Torres, a product discovery coach, this tree aims to methodically move teams through the steps needed to reach a final solution. Teresa Torres's opportunity solution tree breaks down a desired outcome into opportunities for the product to meet user needs and then suggests potential solutions to meet these needs.
Why use an opportunity solution tree?
Product teams may find this template useful if they are able to produce a lot of ideas, but can’t prioritize which ideas are actually of quality. An opportunity solution tree is a tool that product teams can use to assess if they are considering all potential solutions to reach their desired end. It then provides clear solutions at the end of the exercise that can be compared and contrasted for most value.
What is an opportunity in the opportunity solution tree?
Brainstorms tend to lead to a lot of solutions off the bat without any clear logic to whether the solution is a valuable one. Opportunities are a way for product teams to add in the layer of customer needs in order to better connect solutions to what will really help a user. By adding in the step of identifying opportunities, the ideas your team generates will be based on identified needs rather than an arbitrary solution.
What is product discovery?
Product discovery is a framework to help teams create useful, usable products that don’t overlook true user need. Using the Opportunity Solution Tree template is one way to start improving your product discovery.
How do I build an Opportunity Solution Tree?
Creating an opportunity solution tree is easy with Miro's tree diagram maker or ready-made template. Simply follow these steps.
Step 1: Define your outcome or measurable result
Simply put, what does success look like? If you use OKRs, then you can use one of your Key Results to answer this question. If you don’t, then you’ll need to pick a metric that you’d like to improve. Of course, many teams are striving to achieve many goals each quarter, but it helps to create a separate tree for each goal.
It’s important for your team to agree on this goal before you proceed to the next step. If you’re misaligned from the beginning, then it’s going to be harder to build the rest of the tree.
Step 2: Identify possible opportunities
For goal-oriented people, the temptation to jump from “problem” to “solution” is sizable. But resist that temptation. Instead, it’s time to pause and do some research.
Building an Opportunity Solution Tree is all about identifying key opportunities in your market. That means learning: about customers, about what they need, about the problems that they are trying to solve. Focus on answering these questions before you fill out this portion of the tree.
Armed with insights about your customers, you can begin to find opportunities. Use your research to fill out this second branch of the tree. Don’t be fooled: although this branch isn’t about your solutions, it’s still vitally important. Each branch of the tree builds on the previous, so if your research isn’t robust, your opportunities and solutions won’t be robust either.
Step 3: Generate solutions
Now it’s time to think of solutions. This is where the Opportunity Solution Tree template really comes to life for your team. When you go around the room to share ideas during a meeting, myriad dynamics are in play. People might be more or less likely to share based on their rank, role, or who’s in the room. The Opportunity Solutions Tree is an unbiased, agreed-upon source of truth that everyone can own and contribute to.
Invite cross-functional partners to contribute to this part of the tree. Let the ideas flow! However, be wary of including anything that doesn’t fit in the tree. It’s important to stay focused so you don’t end up with more ideas than resources. Write down those extraneous ideas and save them for later. If your team gets lost or stuck, return to the tree to ground you.
Step 4: Iterate and experiment
Choose one solution and once you have some ideas, you can start testing them out. Build a row on the tree specifically for experiments. Start brainstorming experiments that will enable you to test the chosen solution.
How do you use a solution tree?
The opportunity solution tree helps you to visualize the best path to your desired outcome. Use the solution tree to map out the possible opportunities to solve your problem and keep track of the actionable experiments that will lead to your desired outcome.
Get started with this template right now.
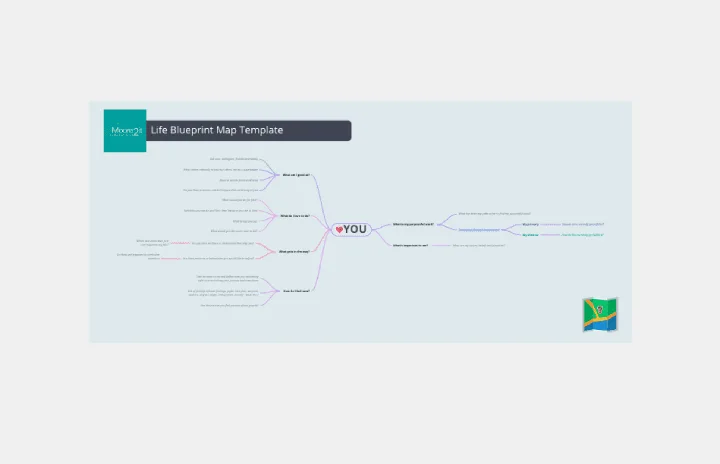
Personal Life Blueprint - Clarity Facilitator
Works best for:
Diagramming
The Personal Life Blueprint Clarity Facilitator template is a visual tool for individuals to clarify their personal goals, values, and priorities. It provides a structured framework for reflecting on different aspects of life and setting actionable objectives. This template enables individuals to gain clarity, focus, and direction in their personal and professional lives. By promoting self-awareness and goal-setting, the Personal Life Blueprint empowers individuals to lead more fulfilling and purpose-driven lives.
Concept Map Template
Works best for:
Education, Mapping, Brainstorming
Use the concept map template to create new ideas, structure your thoughts, and bring your innovations to life. It allows you to explore connections between concepts and let your creativity flow in an organized format. As a result, you’re able to visualize how to bring your new ideas to reality and how various concepts relate to each other.
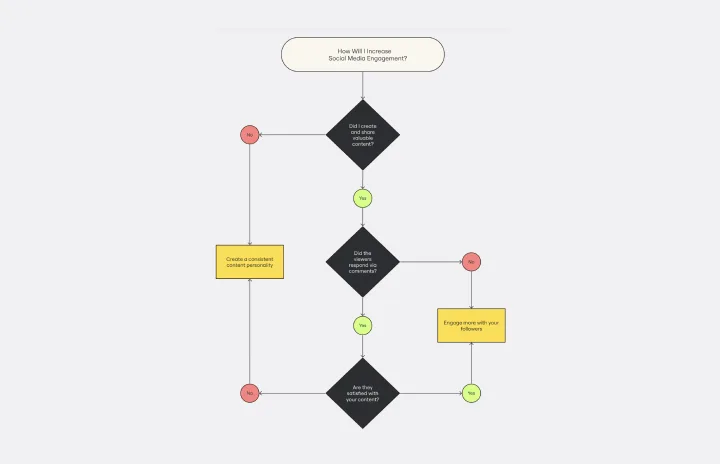
Yes No Flowchart Template
Works best for:
Diagramming
The Yes-No Flowchart Template is a simple and efficient tool that helps to simplify complex decision-making processes into clear and easy-to-follow steps. This template uses standard shapes to illustrate processes, decisions, and outcomes, with arrows that guide users from one action point to the next based on binary 'yes' or 'no' decisions. Its most prominent benefit is its ability to bring clarity to decision-making. By presenting processes visually, teams can effortlessly understand and navigate complex scenarios, ensuring that each step is transparent and reducing the potential for misunderstandings or missteps.

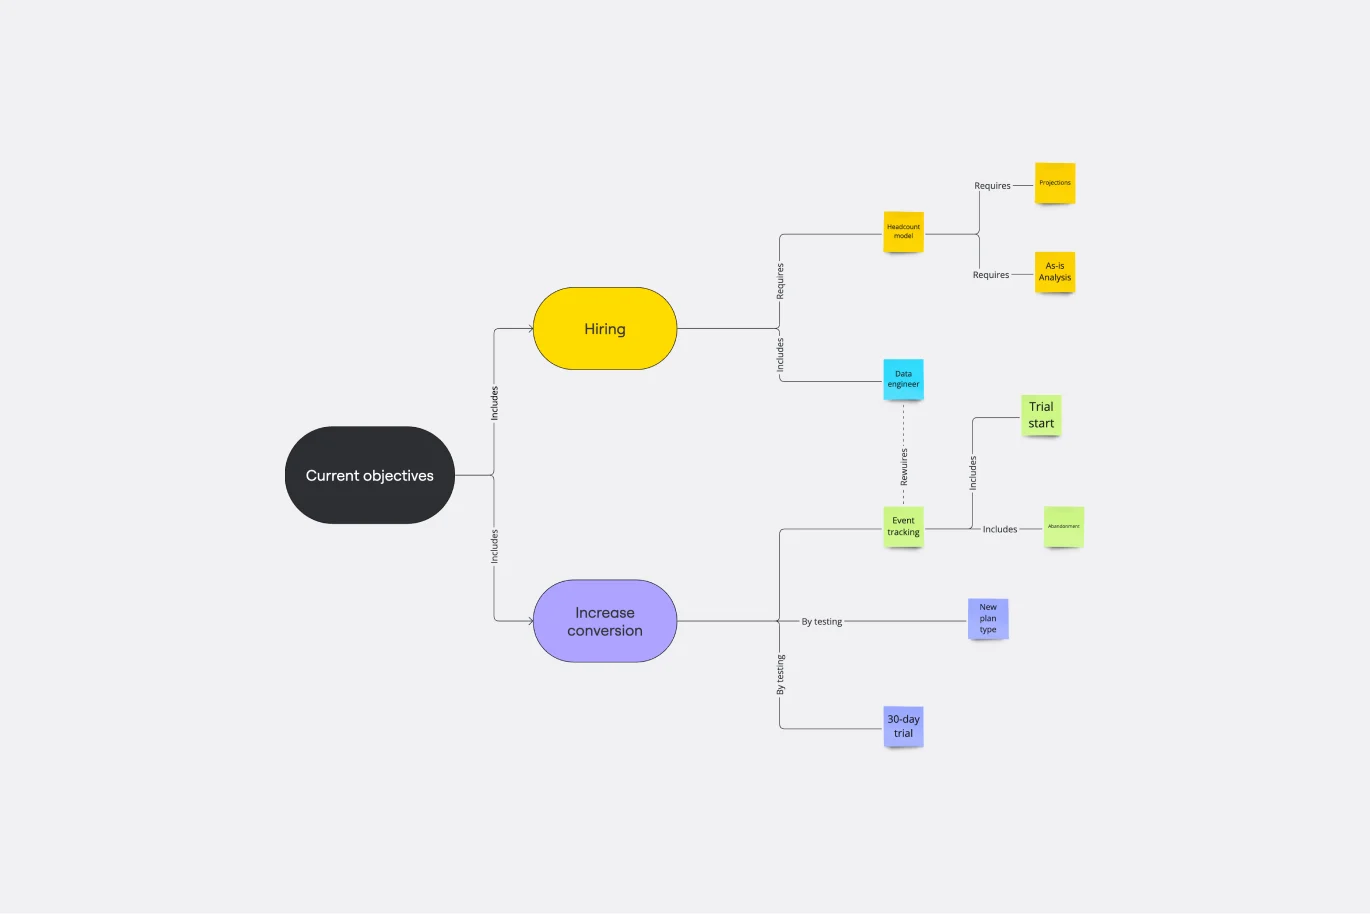
Mind Map Template
Works best for:
Planning, Mind Mapping, Education
We see you, visual learners. You grasp concepts and understand data easier when they're presented in well-organized, memorable graphics. Mind mapping is perfect for you. This powerful brainstorming tool presents concepts or ideas as a tree — with the central subject as the trunk and your many ideas and subtopics as the branches. This template is a fast, effective way for you to start mind mapping, which can help you and your team become more creative, remember more, and solve problems more effectively.
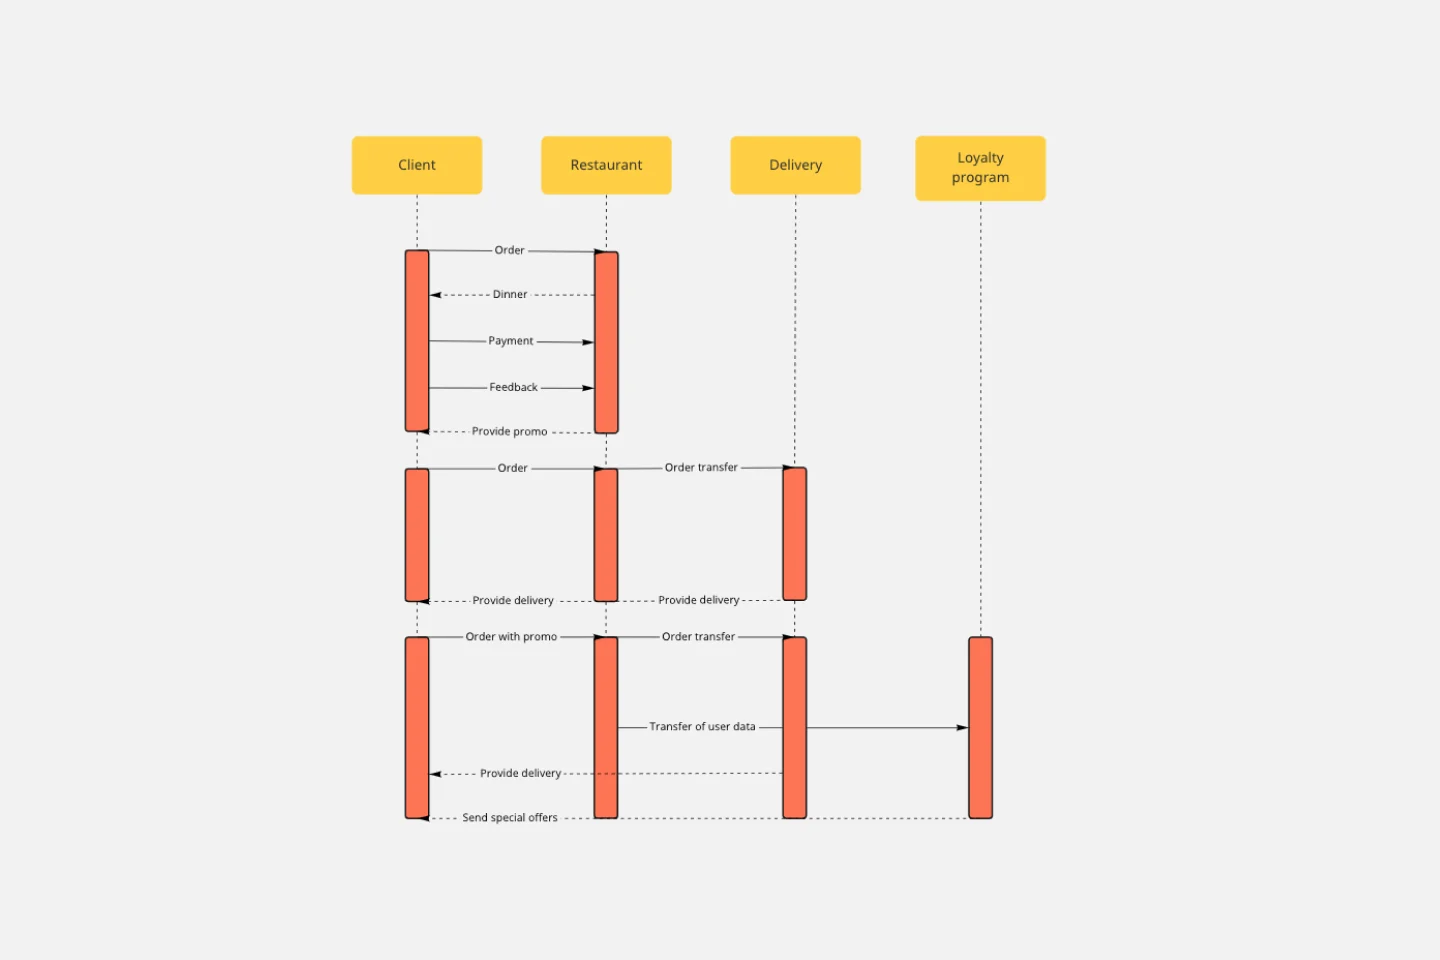
UML Sequence Diagram Template
Works best for:
Software Development, Mapping, Diagrams
Analyze and showcase how external entities interact with your system using a sequence diagram. Get a bird’s-eye view of your work processes, business functions, and customer interactions using this diagram. Also, identify any potential problems early and solve them before implementation.

Bar Chart / Diagram Combined
Works best for:
Diagramming
The Bar Chart / Diagram Combined template offers a versatile tool for creating visualizations that combine bar charts with other diagrammatic elements. It provides elements for representing data trends, relationships, and comparisons effectively. This template enables teams to create customized visualizations that communicate complex information in a clear and compelling manner. By promoting visual clarity and insight, the Bar Chart / Diagram Combined template empowers teams to make data-driven decisions and communicate findings with impact.