Cause and Effect Diagram Template
Quickly analyze relationships and identify the root causes within a system with the cause and effect diagram template.
About the Cause and Effect Diagram Template
The cause-and-effect diagram template is an effective tool for analyzing complex relationships and identifying the root causes within a system. This template is a more straightforward version of the Fishbone or Ishikawa diagram. It is used to visually represent the cause-and-effect relationships in a structured manner. Whether you are solving problems, improving a process, or troubleshooting, this template provides a systematic approach to identifying and understanding the factors influencing a specific issue.
Understanding the cause and effect diagram template
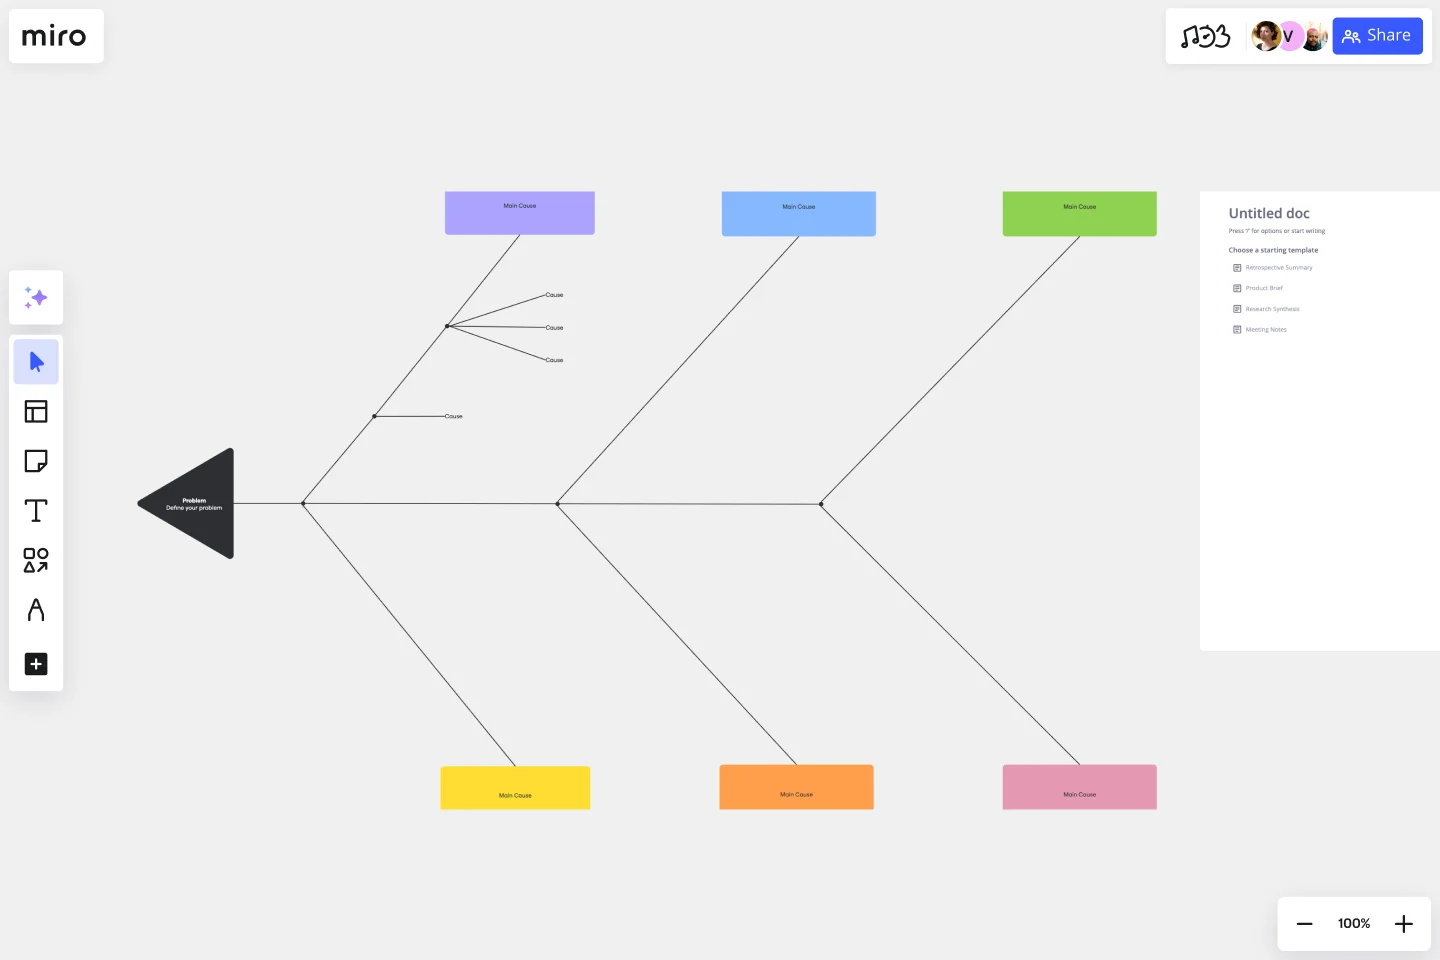
The cause and effect diagram template categorizes potential causes into branches. Here is how the template is built:
Problem statement: Clearly defines the identified issue as the central focal point for exploring potential causes.
Categories of causes: Organizes potential causes into branches, offering a systematic and categorized approach to analysis.
Main bones: Represents primary categories of causes as main branches extending from the spine of the fishbone diagram.
Sub-branches: Break down each main branch into sub-branches, thoroughly exploring potential causes.
Analysis section: Dedicates space for in-depth analysis, enabling teams to fully explore each cause's impact on the identified problem.
How to use the cause and effect diagram template
Edit with precision: You can customize the template easily by using drag-and-drop functionality. This will help you address your specific problem and its potential causes.
Collaborative analysis: You can engage in real-time collaboration with your team members directly on the Miro board. This will foster collective analysis and brainstorming sessions.
Root cause identification: You can use the template to systematically identify root causes. This will help you gain a thorough understanding of the problem and enable you to solve it effectively.
Why should you use a cause-and-effect diagram template?
Structured problem analysis: Organize and analyze potential causes systematically, providing a structured framework for identifying the root cause of a problem.
Team collaboration: Facilitate collaborative problem-solving sessions, ensuring diverse perspectives contribute to a comprehensive analysis.
Visual clarity: Enhance understanding through visual representation, facilitating comprehension of complex cause-and-effect relationships.
Strategic decision-making: Equip teams with insights to make informed and strategic decisions based on a thorough understanding of the problem's causes.
Process improvement: Drive continuous improvement by systematically addressing root causes enhancing efficiency and effectiveness within processes.
Is there a recommended order for exploring the causes in the template?
While there is no strict order, initiating analysis with main branches and progressively exploring sub-branches for a thorough and structured examination is often beneficial.
Can I export or share the Cause and Effect Diagram created in Miro with stakeholders outside the platform?
Miro offers export and sharing features, allowing users to share the diagram with stakeholders outside the platform for review and collaboration.
Get started with this template right now.
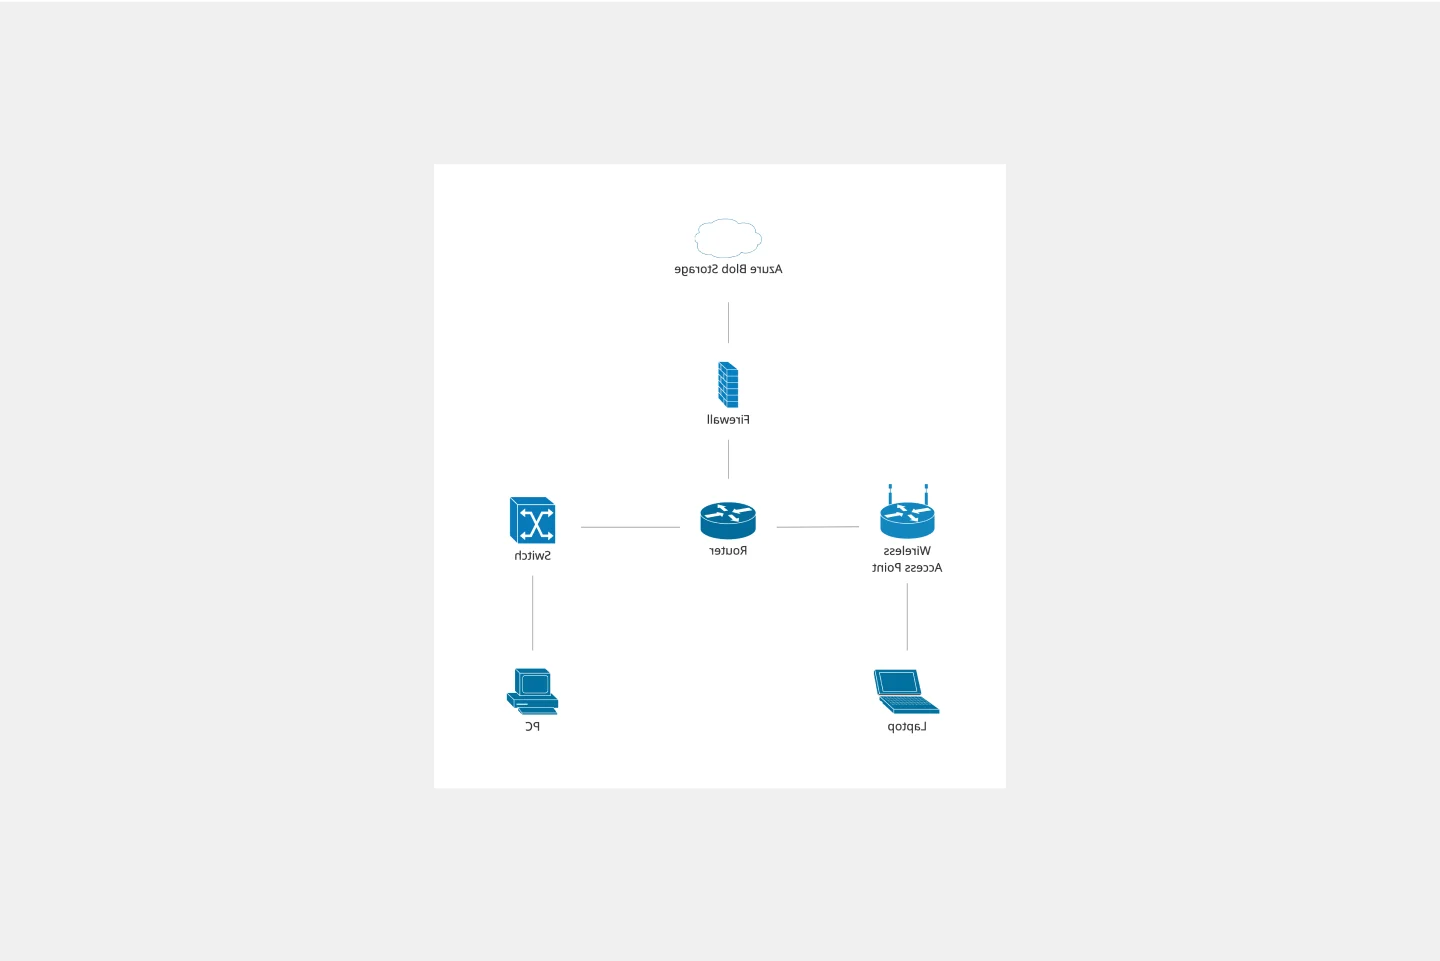
Cisco Network Diagram Template
Works best for:
Software Development, Diagrams
Cisco offers data center and access networking solutions built for scale with industry-leading automation, programmability, and real-time visibility. The Cisco Data Network Diagram uses Cisco elements to show the network design of Cisco Data Networks visually.
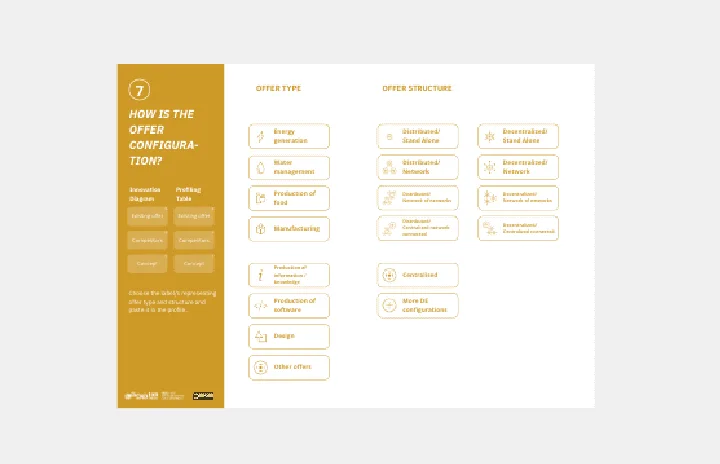
Innovation Diagram_S.PSS
Works best for:
Diagramming
The Innovation Diagram_S.PSS template offers a visual framework for mapping out the innovation process using the S.PSS (Service Product System Strategy) approach. It provides elements for defining service components, product features, and system interactions. This template enables teams to visualize and communicate their innovation strategy, facilitating alignment and collaboration across stakeholders. By promoting systematic innovation and holistic thinking, the Innovation Diagram_S.PSS empowers organizations to drive sustainable growth and competitive advantage through service and product innovation.
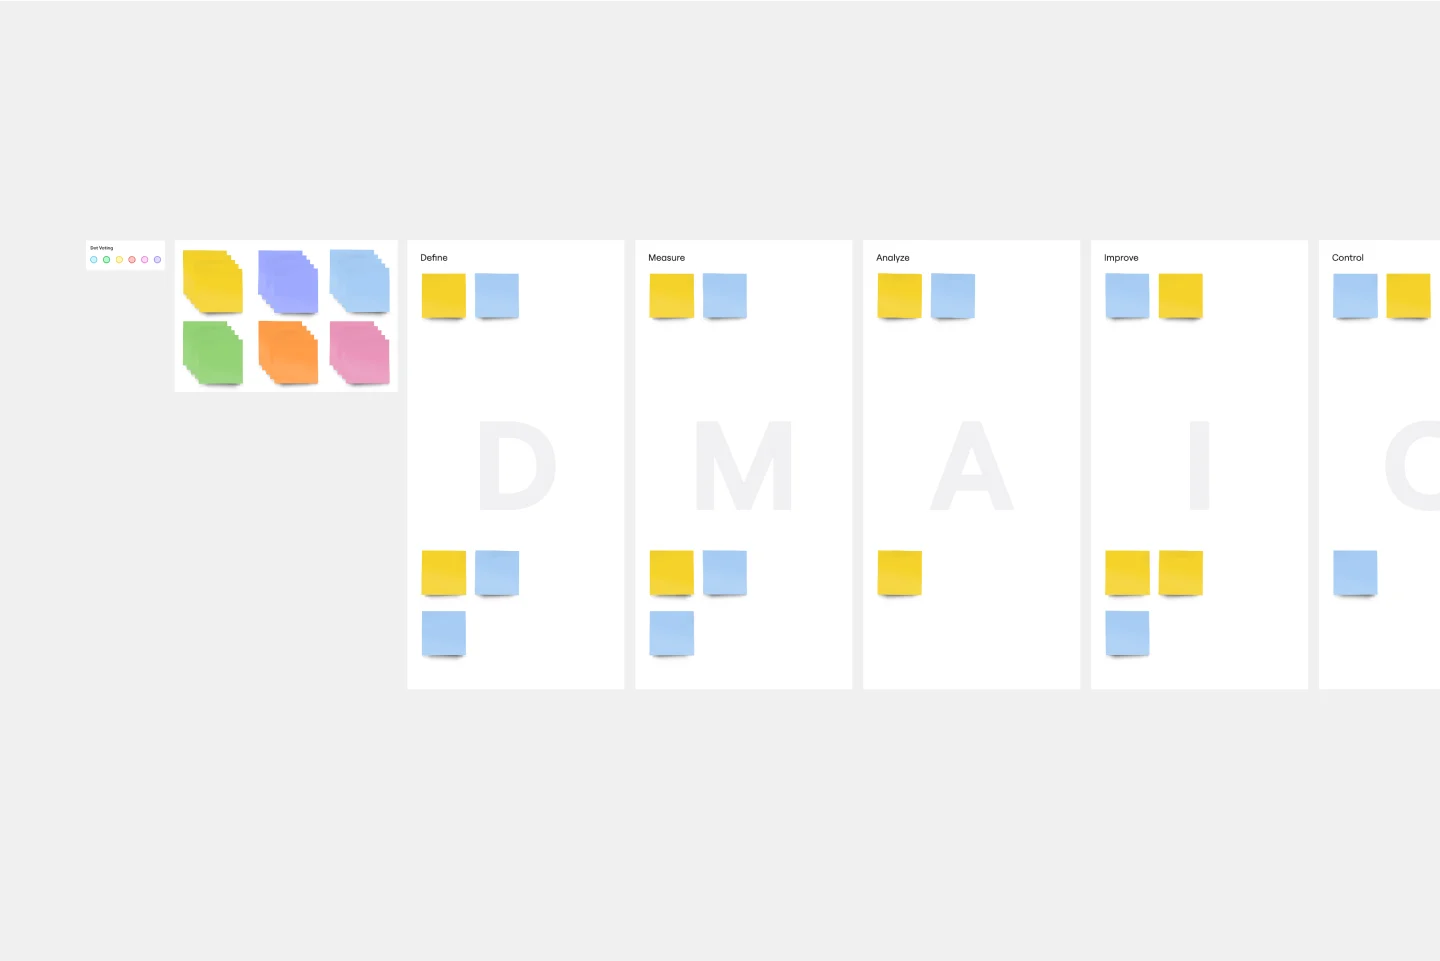
DMAIC Analysis Template
Works best for:
Agile Methodology, Design Thinking, Operations
Processes might not seem like the funnest thing to dive into and examine, but wow can it pay off—a more efficient process can lead to serious cost savings and a better product. That’s what DMAIC analysis does. Developed as part of the Six Sigma initiative, DMAIC is a data-driven quality strategy for streamlining processes and resolving issues. The technique is broken into five fundamental steps that are followed in order: Define, Measure, Analyze, Improve, and Control.
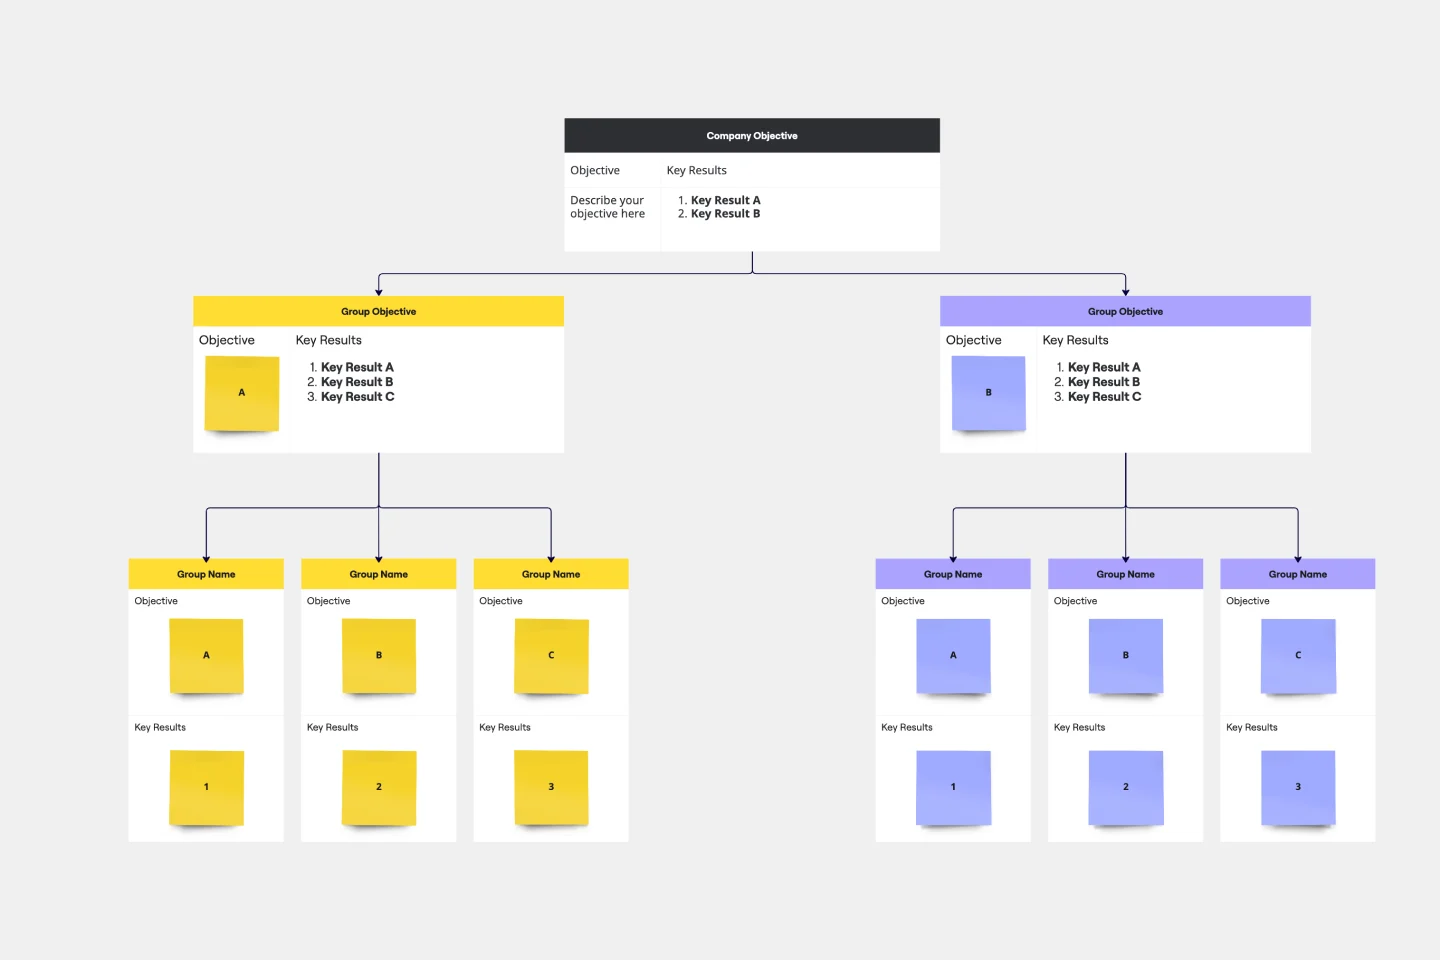
Objectives and Key Results (OKRs) Template
Works best for:
Leadership, Strategic Planning, Project Planning
Clarity, focus, and structure — those are the key ingredients to feeling confident in your company’s directions and decisions, and an OKR framework is designed to give them to you. Working on two main levels — strategic and operational — OKRs (short for objectives and key results) help an organization’s leaders determine the strategic objectives and define quarterly key results, which are then connected to initiatives. That’s how OKRs empower teams to focus on solving the most pressing organizational problems they face.
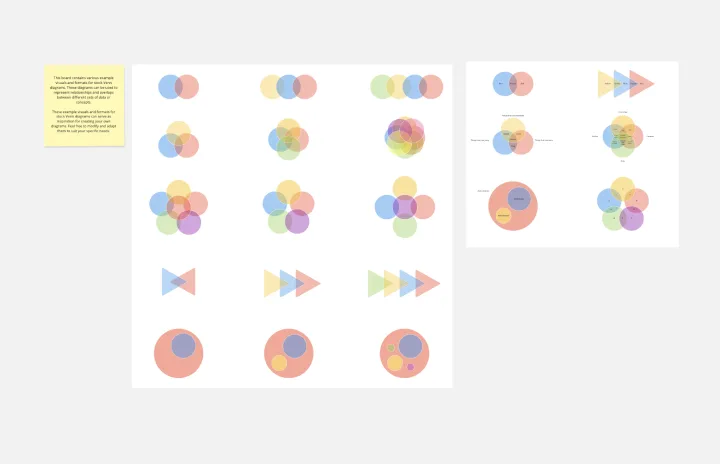
Venn Diagrams by Dave Westgarth
Works best for:
Venn Diagram
Visualize relationships and intersections clearly with the Collection Venn Diagram template. This tool is perfect for comparing multiple sets of data, identifying commonalities, and showcasing unique elements. Use it in presentations, research, and data analysis to make complex information more digestible. Ideal for educators, researchers, and analysts seeking to present data insights effectively.
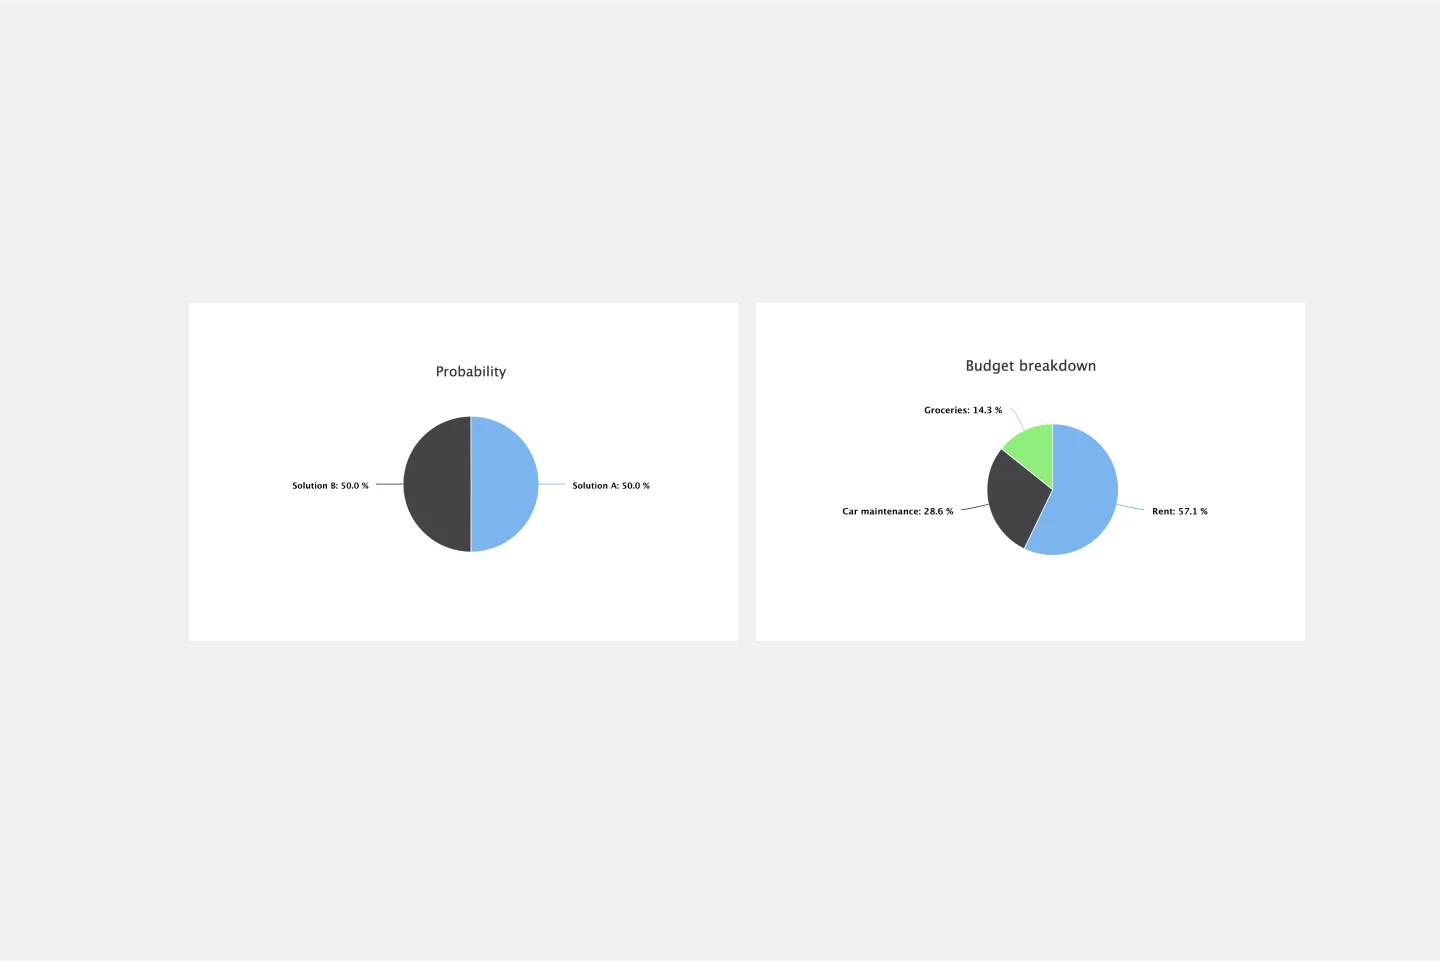
Pie Chart Template
Works best for:
Education, Operations
Pie charts are an excellent way to present relationships between datasets graphically, where you can quickly compare information and see contrast right away. Professionals from many fields use pie charts to support their presentations and enrich their storytelling as it’s one of the most commonly used data charts.