Yes No Flowchart Template
Improve decision-making with the yes no flowchart template.
About the Yes-No Flowchart Template
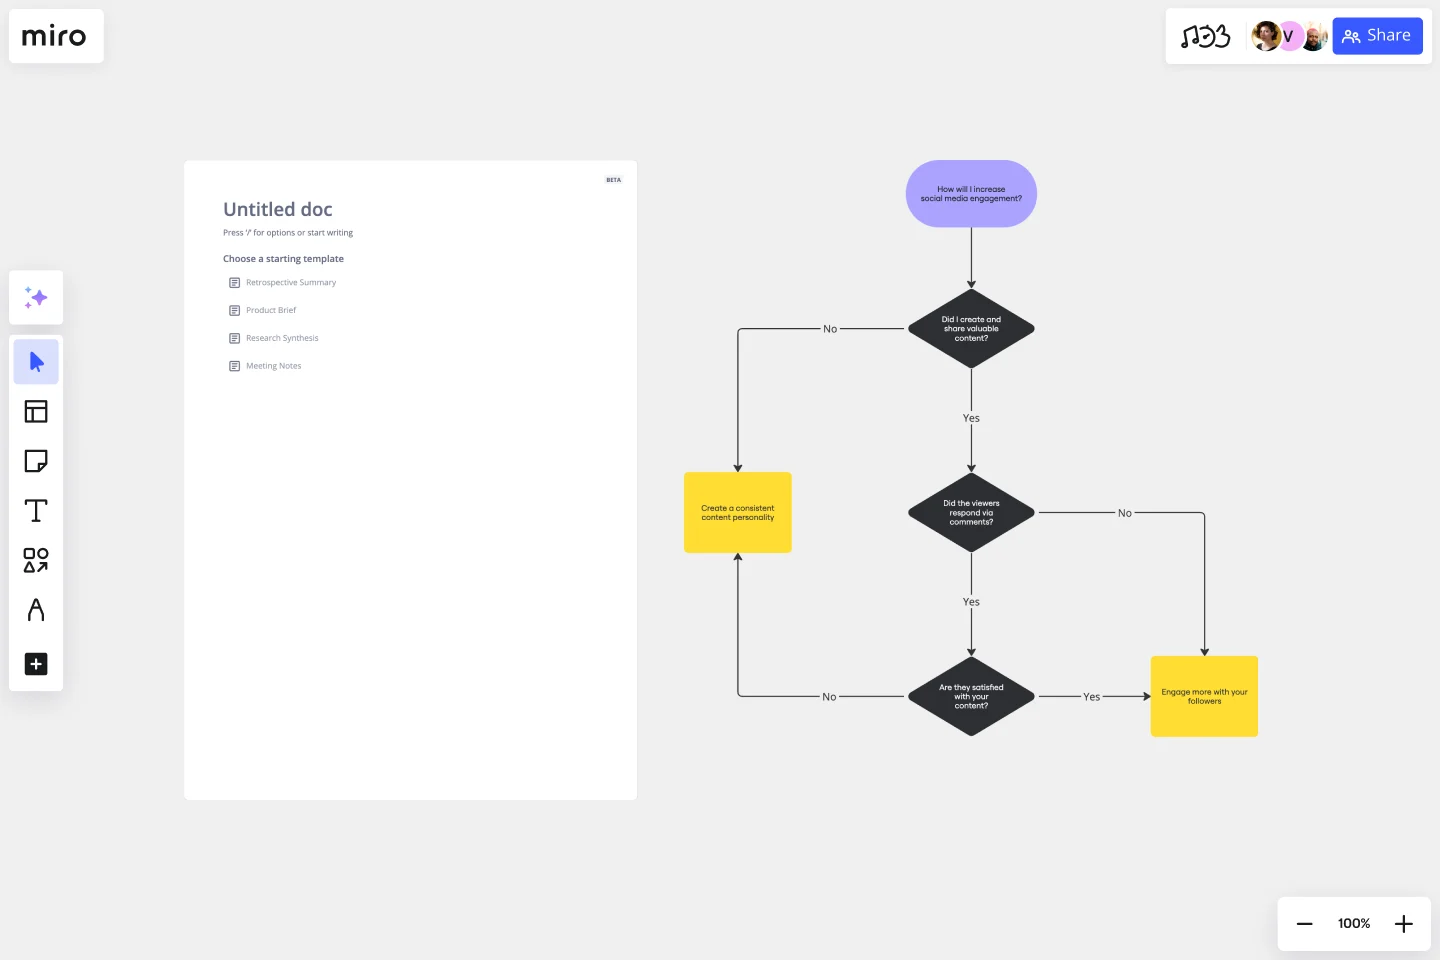
Taking a logical and systematic approach to decision-making can significantly improve the efficiency of project planning and execution. One helpful tool for this is the use of a yes-no flowchart template. These flowcharts offer an easy-to-understand way to visualize decision points and their subsequent outcomes. By using predefined graphical representations, people and teams can map out binary decisions and actions with ease.
The flowcharts use standard shapes such as rectangles, diamonds, and ovals to represent processes, decisions, and endpoints. With arrows connecting each shape, viewers can effortlessly navigate from one step to the next based on their yes or no decisions.
Overall, using yes-no flowcharts is a simple yet powerful way to streamline project planning and execution.
How to use the yes-no flowchart template
Edit easily: Start by clicking on any shape or text. Change the content to suit your specific process or decision point.
Expand the flow: If your decision-making process is more complex, add more shapes by clicking on the shape's blue dots. The automated diagramming feature ensures that connector lines adjust themselves automatically.
Add context: Enrich your flowchart by dragging any artifact onto your workspace. This can be images, documents, or links that give additional information or clarity about a particular step or decision.
Why should you use a yes-no flowchart template?
Clarity: Flowcharts break down complex processes into simple, visual steps everyone can understand. This promotes clear communication and ensures that everyone knows exactly what needs to be done.
Efficiency: Visual representations are faster and more effective in conveying processes than lengthy explanations or written documents. This helps teams to save time and effort while ensuring that nothing is overlooked.
Flexibility: Flowchart templates can be tailored to fit any process or decision-making sequence, regardless of the industry or domain. This means they can be used in various contexts and adapted to suit specific needs.
Collaboration: Flowcharts promote collaboration by allowing team members to work on, comment on, and review the same document simultaneously. This makes it easier to incorporate feedback and ensures that everyone is on the same page.
Error reduction: By mapping out all possible outcomes in advance, teams can identify potential problems and address them proactively. This helps to reduce the risk of errors, bottlenecks, and other issues that can derail a process.
If you'd prefer to diagram from scratch, Miro's easy-to-use flowchart creator will help you build an online flowchart in no time. With Miro's collaboration features, you can workshop it with your team and easily share it with others for feedback.
What shapes are commonly used in the yes-no flowchart template?
The commonly used shapes are rectangles (for processes or actions), diamonds (for decision points), and ovals (for start or endpoints). Each shape serves a distinct purpose in the flowchart.
Can I integrate external data or links into the flowchart?
Absolutely! You can drag and drop any external artifact onto the workspace. This can include, but is not limited to, images, documents, or web links.
Is the template adjustable in size and layout?
Yes, the template is fully customizable. You can adjust the size of shapes, reposition them, or change the flow direction as per your needs.
How do I share or present the completed flowchart to my team?
Once you've tailored the flowchart to your satisfaction, you can present it within the platform or export it in various formats for sharing or printing.
Get started with this template right now.

Opportunity Solution Tree Template
Works best for:
Flowcharts, Product Management, Diagrams
Solving problems — successful companies and productive teams just know how to do it. They’re able to identify many possible solutions, then settle on the one that leads to the desired outcome. That’s the power an Opportunity Solution Tree gives you. Designed by Teresa Torres, a product discovery coach, this mind map breaks down your desired outcome into opportunities for the product to meet user needs, then gives your team an effective way to brainstorm potential solutions.
Precedence Diagram
Works best for:
Diagramming, Mapping
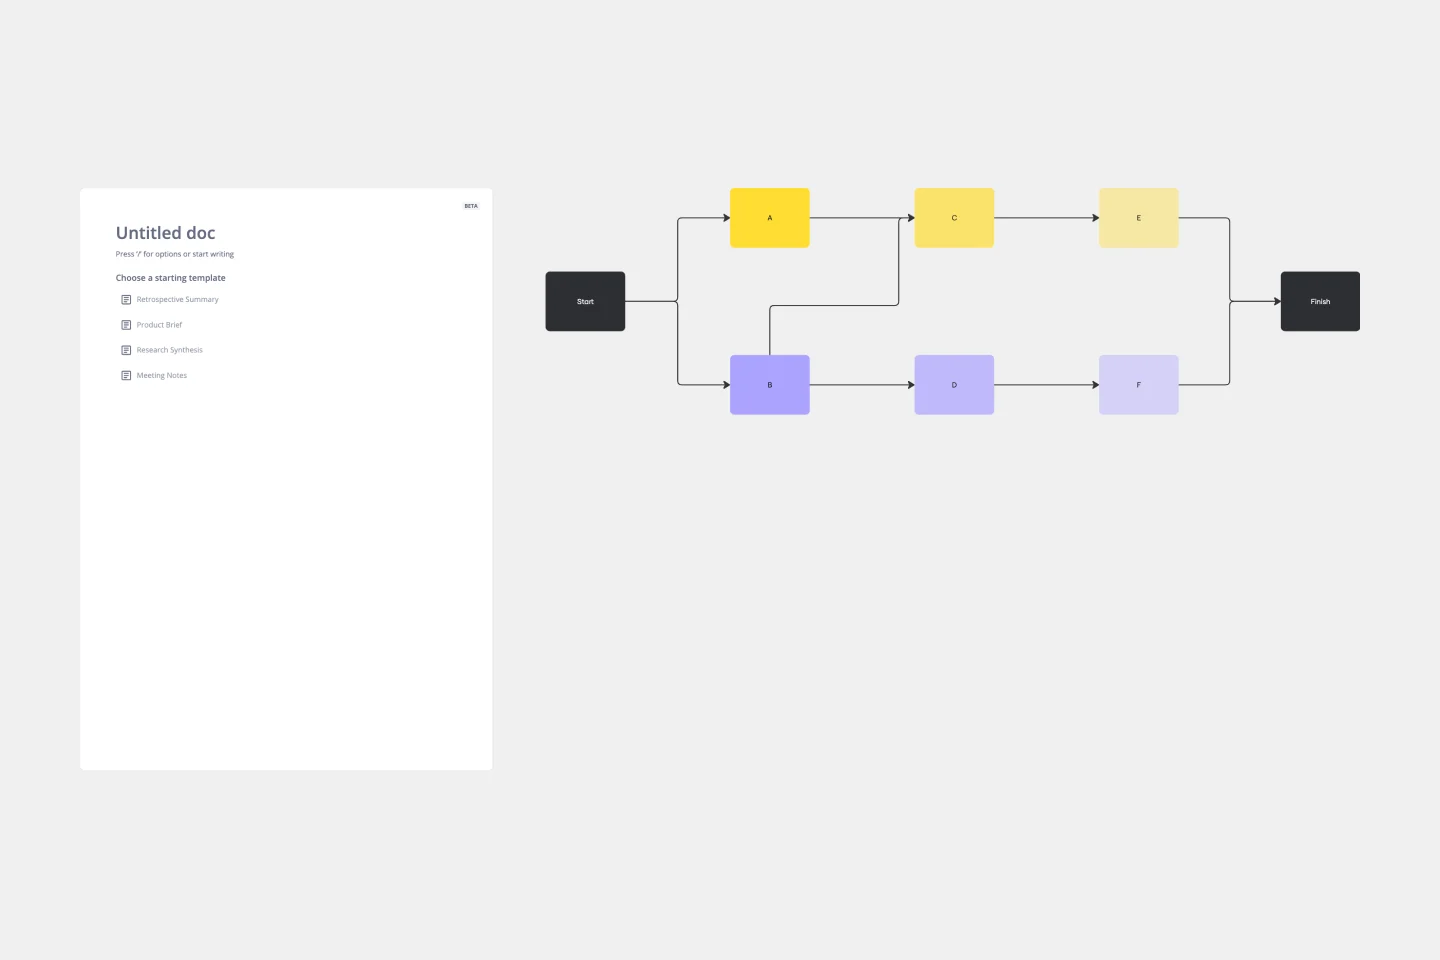
The Precedence Diagram Template offers a visual tool that maps out project activities and their interrelated sequences. This diagram empowers teams to recognize and anticipate workflow structures by illustrating the connections and dependencies among tasks.
Datavant Switchboard with AWS Clean Rooms Template
Works best for:
AWS
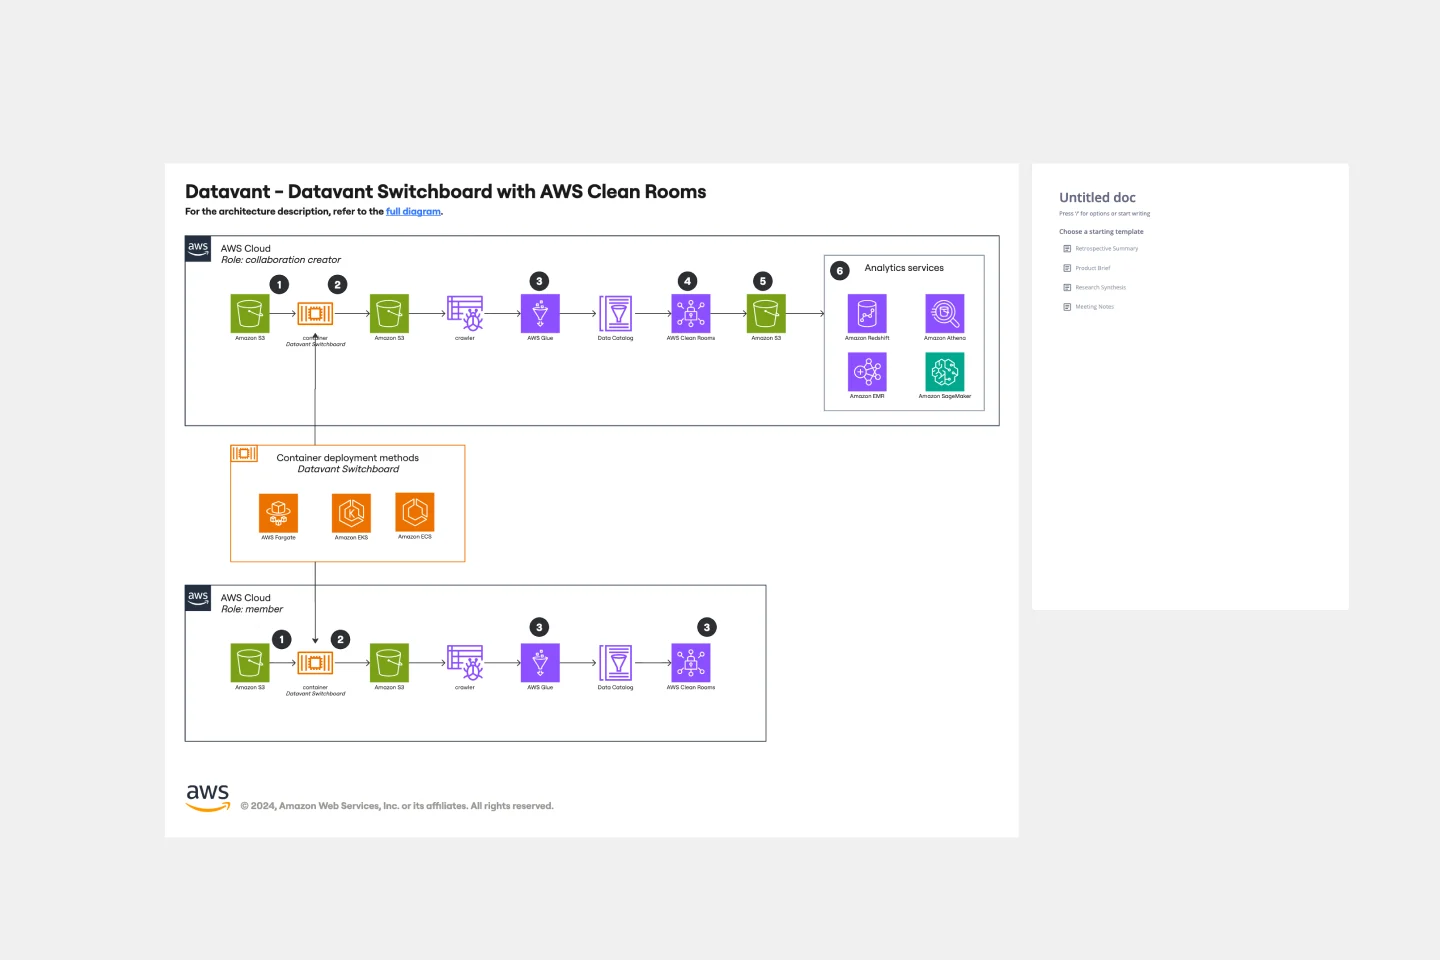
The AWS Datavant Switchboard Clean Rooms Template integrates health data sources using Datavant's secure data connection capabilities and AWS Clean Rooms' scalable data processing environment. It's useful for professionals in engineering, database management, and development. The customizable Miro interface streamlines secure and efficient data handling and team collaboration for a wide range of projects.
Login Sequence Diagram Template
Works best for:
Diagramming, Technical Diagramming
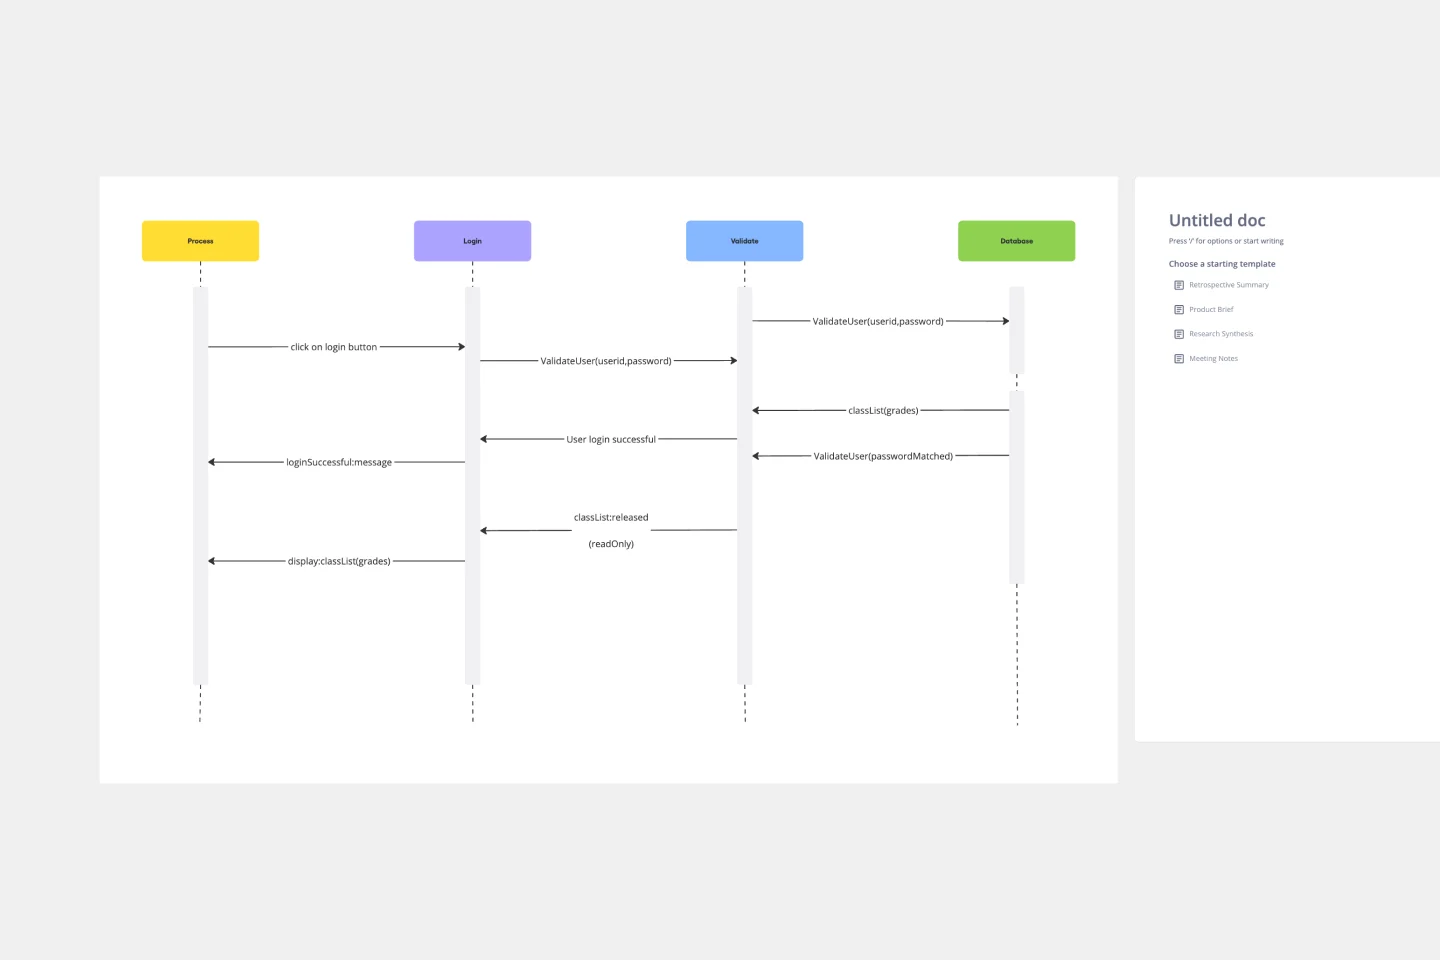
The UML Sequence Login Diagram Template is a valuable tool for visualizing user authentication processes. It breaks down complex login sequences into clear, visual components, facilitating collaborative understanding among team members, regardless of their technical expertise. This shared understanding is crucial for ensuring all stakeholders, from developers to project managers, are on the same page, leading to efficient decision-making and a smoother development process. The template's ability to translate technical details into an accessible format streamlines communication and significantly reduces the likelihood of misinterpretation or oversight, making it an essential asset in any software development project.
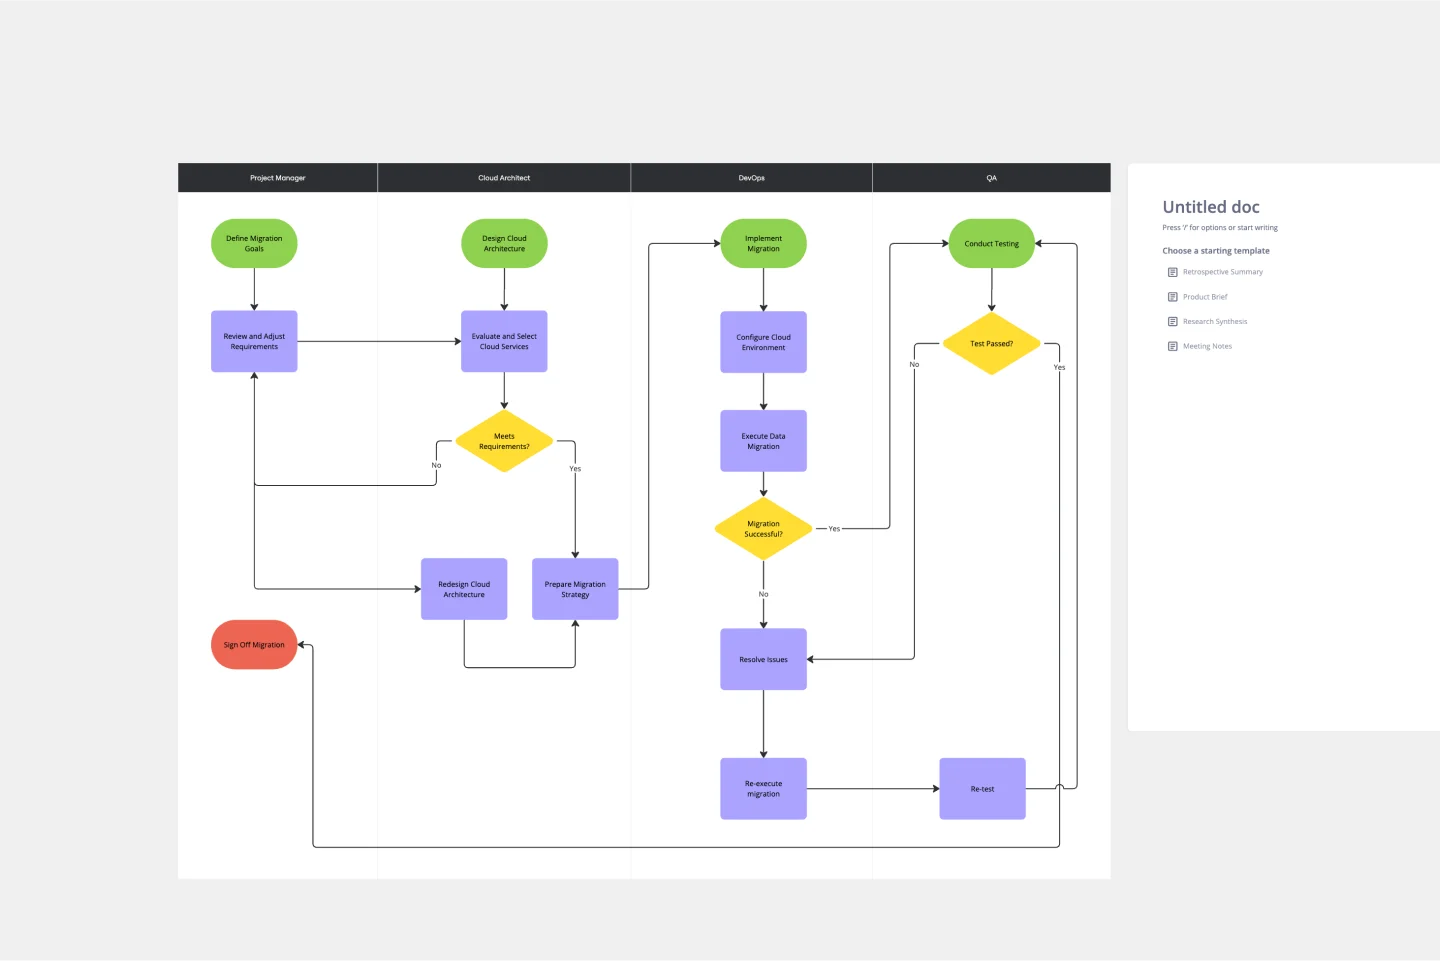
On-Premise to Cloud Migration Process Flowchart Template
Works best for:
Flowcharts
The On-Premise to Cloud Migration Process Flowchart Template is a strategic tool designed to streamline the transition from traditional on-premise systems to more flexible, scalable cloud-based solutions. This template acts as a visual roadmap, guiding teams through each phase of the migration process with clarity and precision. By breaking down the migration into manageable steps, it ensures a comprehensive approach, minimizing risks and aligning with best practices for cloud adoption.
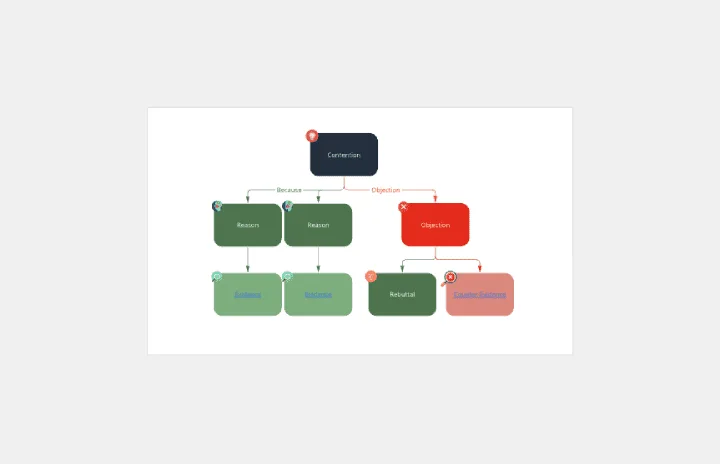
Argument Map
Works best for:
Diagramming
The Argument Map template is a visual tool for structuring and analyzing arguments and debates. It provides a structured framework for capturing premises, conclusions, and logical relationships. This template enables teams to explore complex issues, identify strengths and weaknesses in arguments, and make informed decisions. By promoting clarity and critical thinking, the Argument Map template empowers teams to navigate debates and discussions effectively, fostering consensus and understanding.