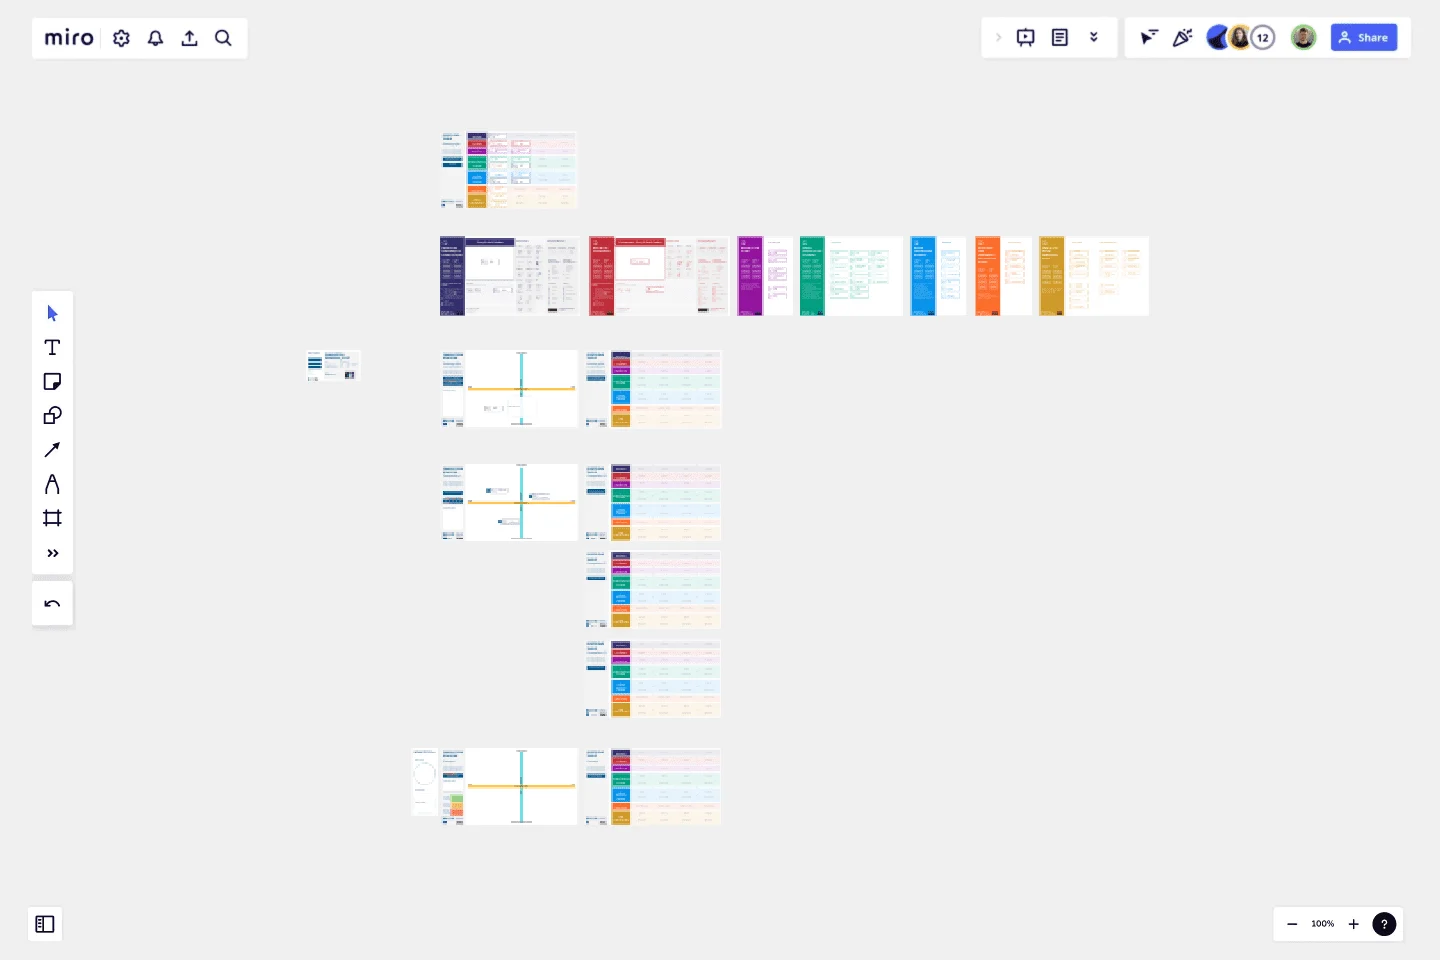
Innovation Diagram_S.PSS
Create an innovation diagram easily thanks to this template.
Aims
The objective of the Innovation Diagram_S.PSS is to
position and characterize existing offers;
map competitors strategic positioning;
select promising system sustainability ideas and help achieve a newconcepts profiling.
What it consists of
polarity diagram + concept profiler
digital post-it (one colour)
a repository of labels
This template was created by LeNSlab Polimi.
Get started with this template right now.
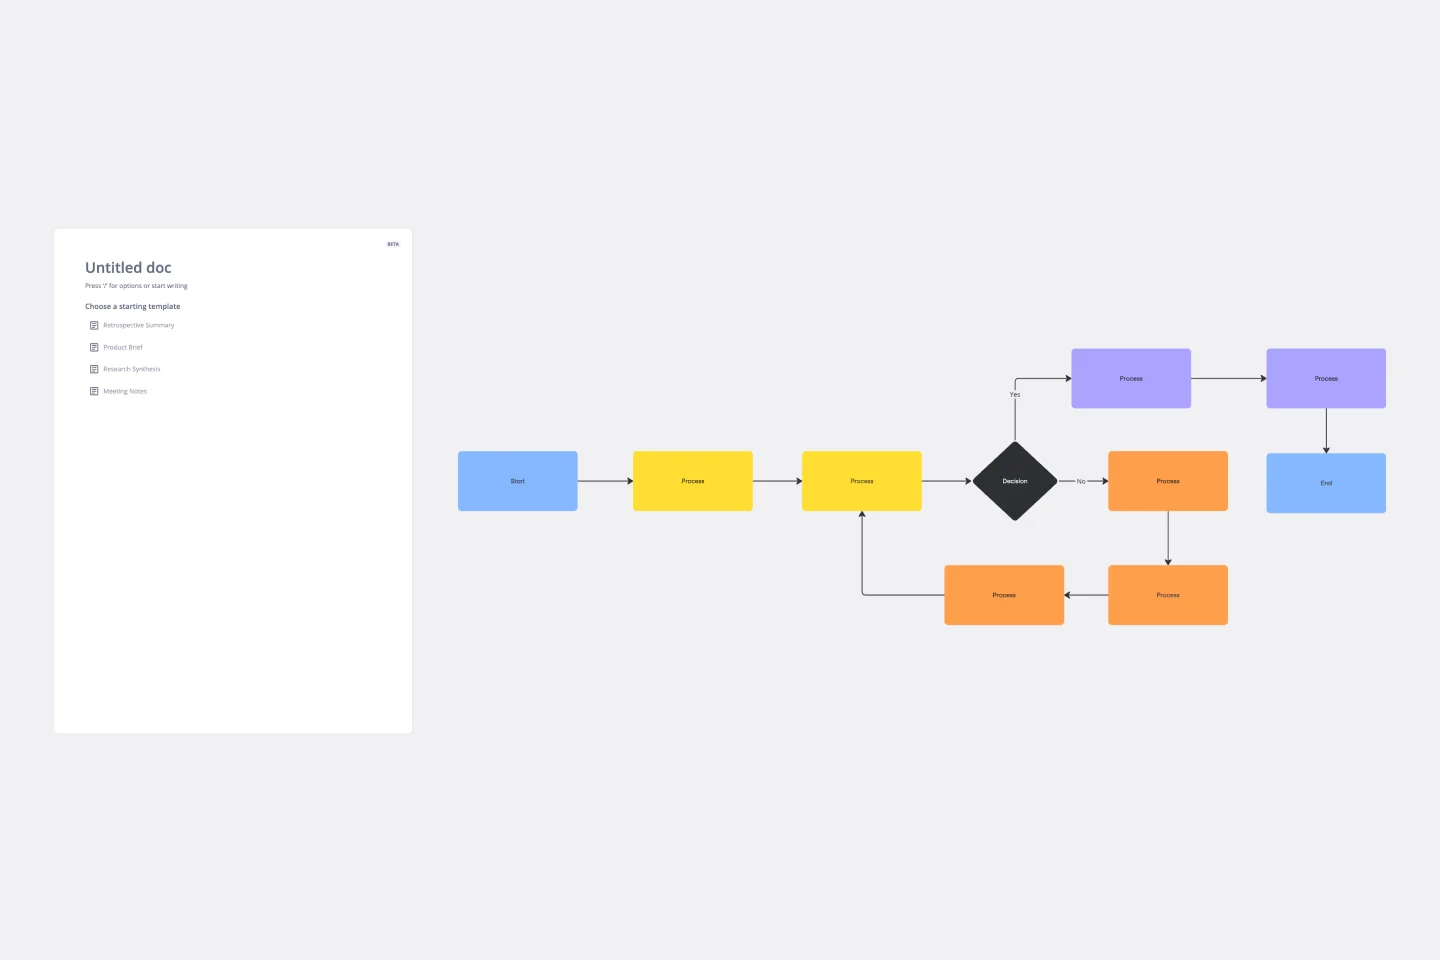
Flowchart Template
Works best for:
Flowcharts, Mapping, Diagrams
Trying to explain a process or workflow to your team — or just wrap your head around it yourself? Sometimes the best way is to see it, and that’s when you create a flowchart. Using common shapes (generally just ovals, rectangles, diamonds, and arrows), a flowchart shows you the direction a process or workflow goes and the order of steps. Beyond giving you a clear understanding, you’ll also be able to see potential flaws and bottlenecks, which helps you refine and improve your process and create a better product more efficiently.
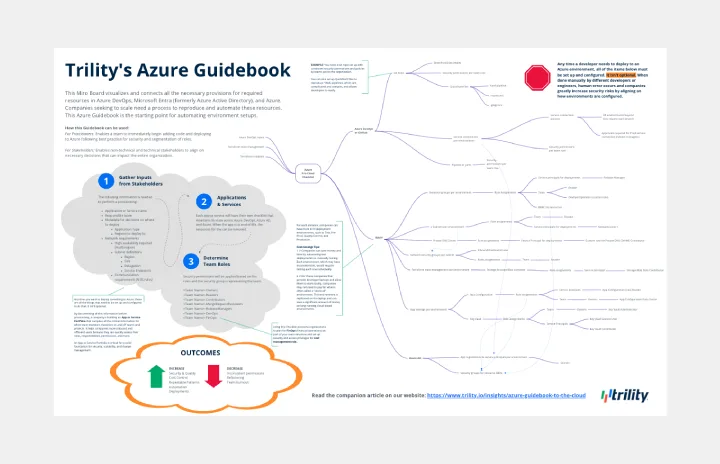
Azure Guidebook
Works best for:
Cloud Infrastructure
This Miro Board visualizes and connects all the necessary provisions for required resources in Azure DevOps, Microsoft Entra (formerly Azure Active Directory), and Azure.
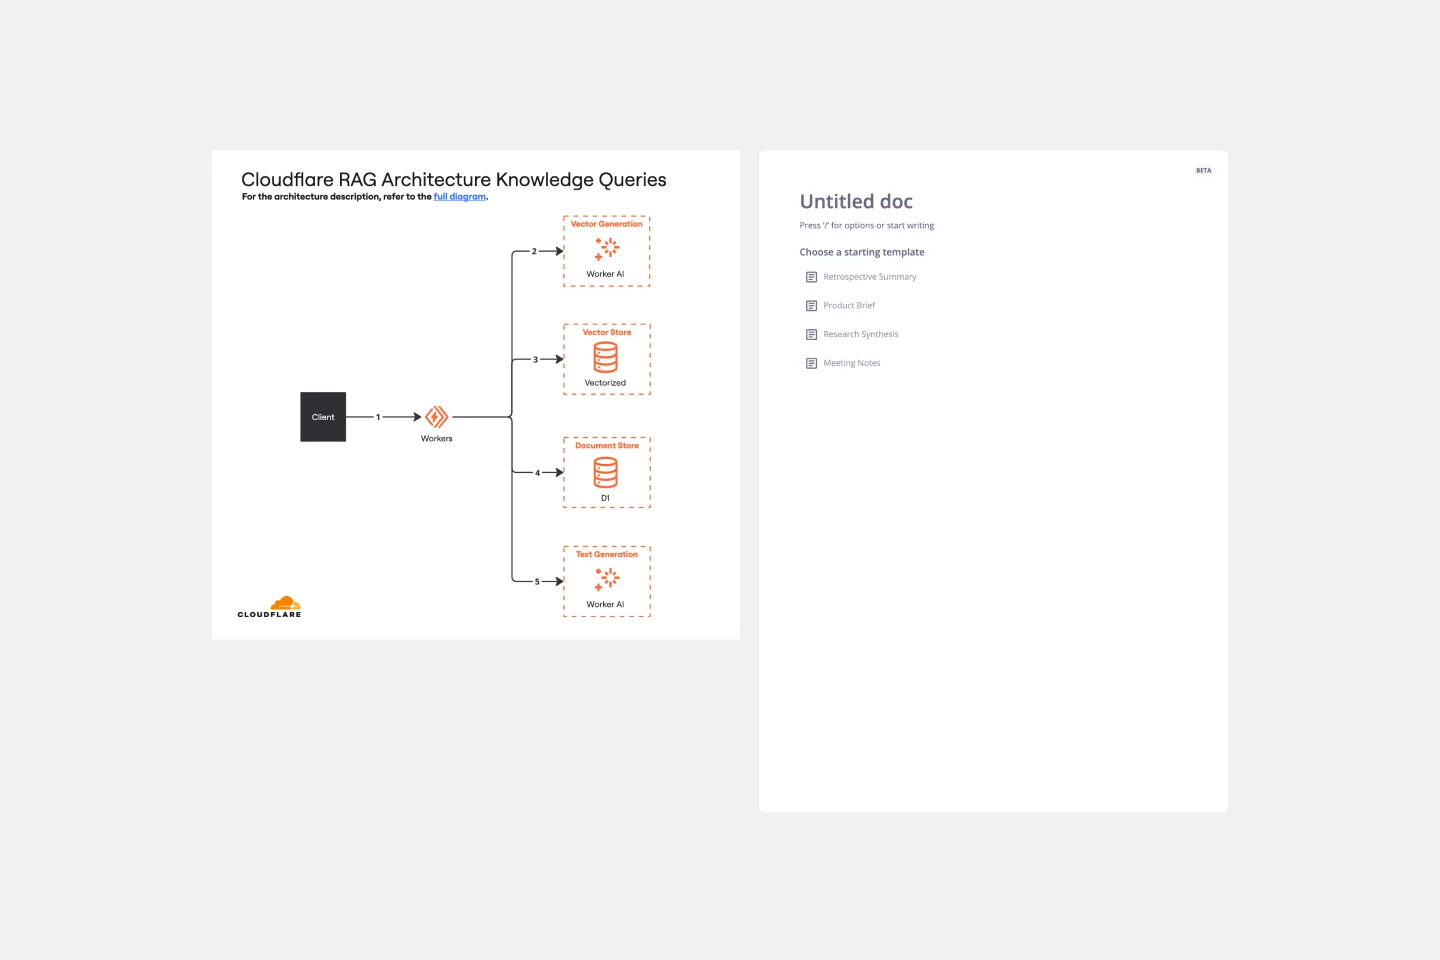
Cloudflare RAG Architecture Knowledge Queries Template
The Cloudflare RAG Architecture Knowledge Queries template is a cutting-edge tool designed to streamline the process of diagramming and understanding the intricate architecture of Cloudflare's Retrieval Augmented Generation (RAG) system. This template is a boon for teams aiming to visualize, query, and optimize Cloudflare's infrastructure collaboratively.
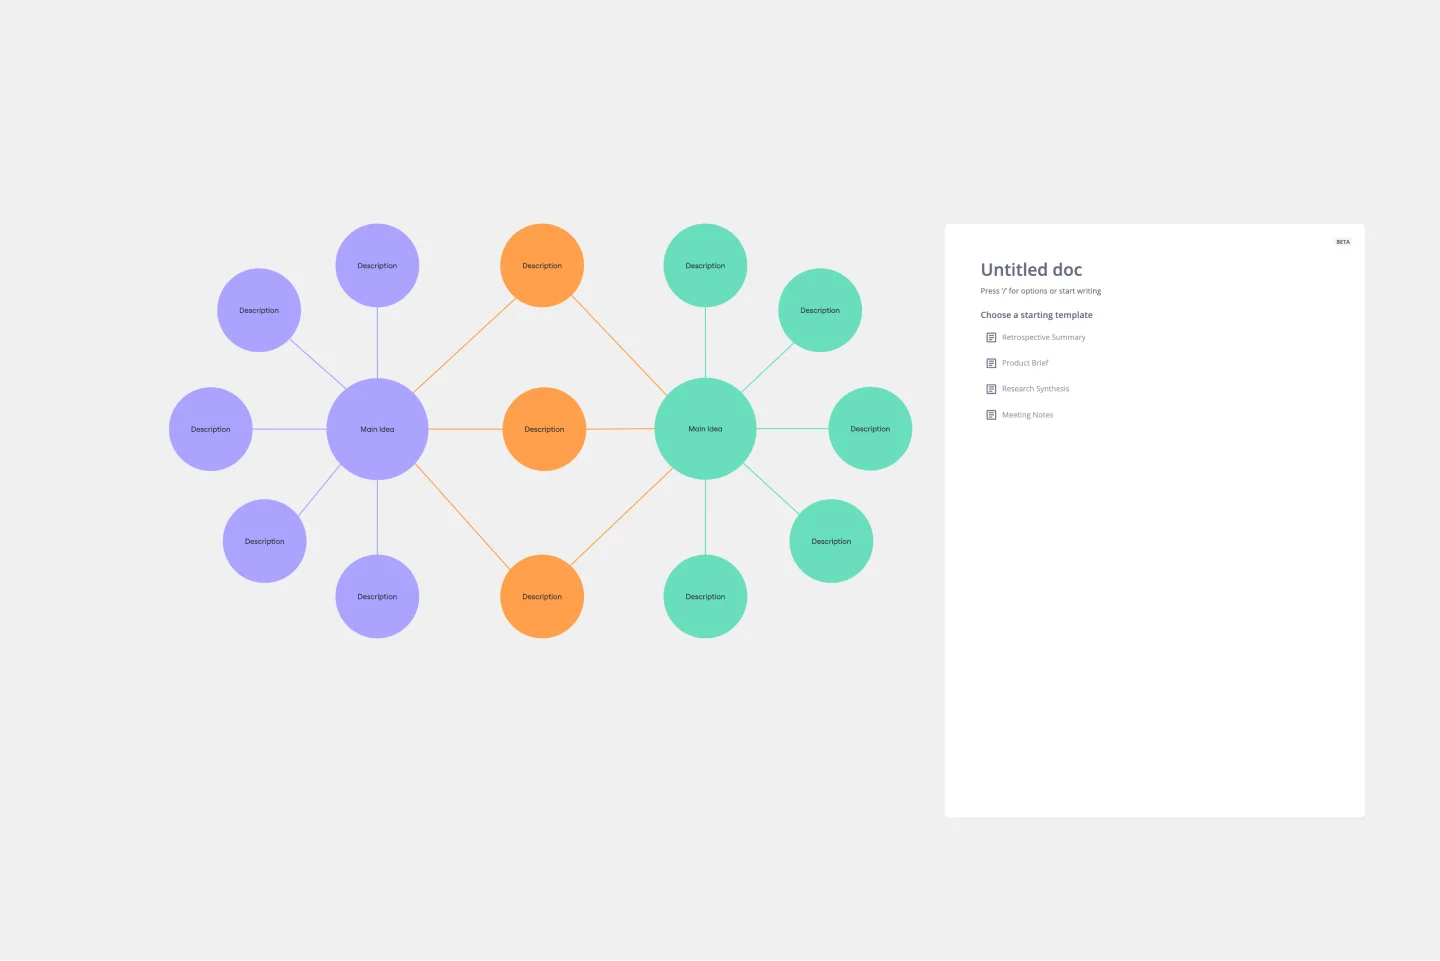
Double Bubble Map Template
Works best for:
Diagramming, Mapping, Brainstorming
Double Bubble Map Template serves as a powerful tool to facilitate teamwork and streamline idea exploration. This adaptable template empowers teams to brainstorm, analyze, and compare concepts with ease, making it an invaluable asset for enhancing creativity and fostering clarity among team members.
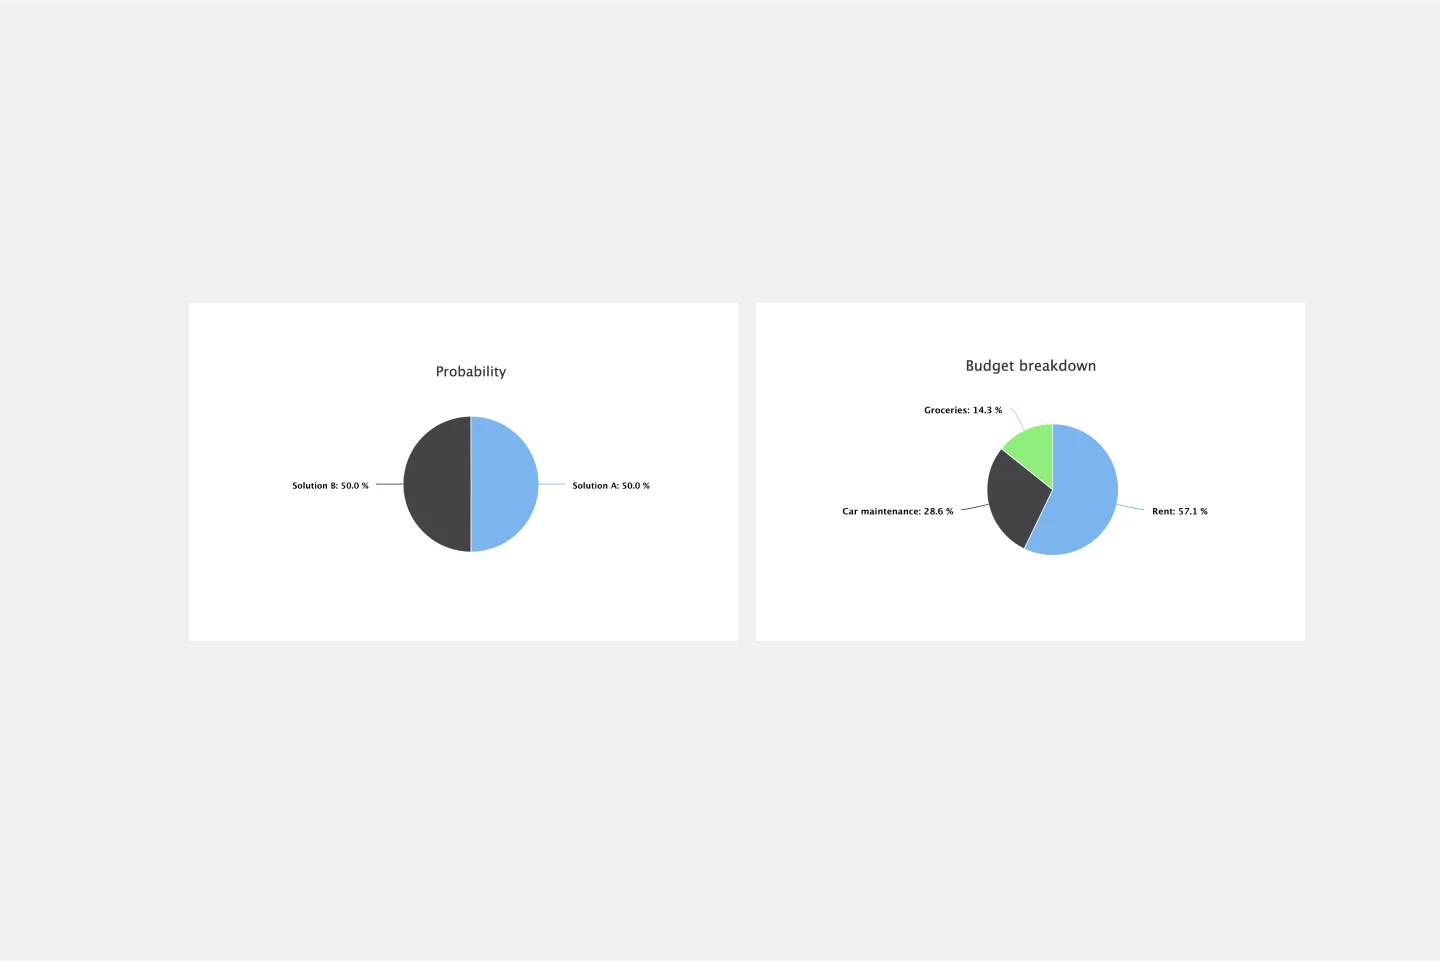
Pie Chart Template
Works best for:
Education, Operations
Pie charts are an excellent way to present relationships between datasets graphically, where you can quickly compare information and see contrast right away. Professionals from many fields use pie charts to support their presentations and enrich their storytelling as it’s one of the most commonly used data charts.
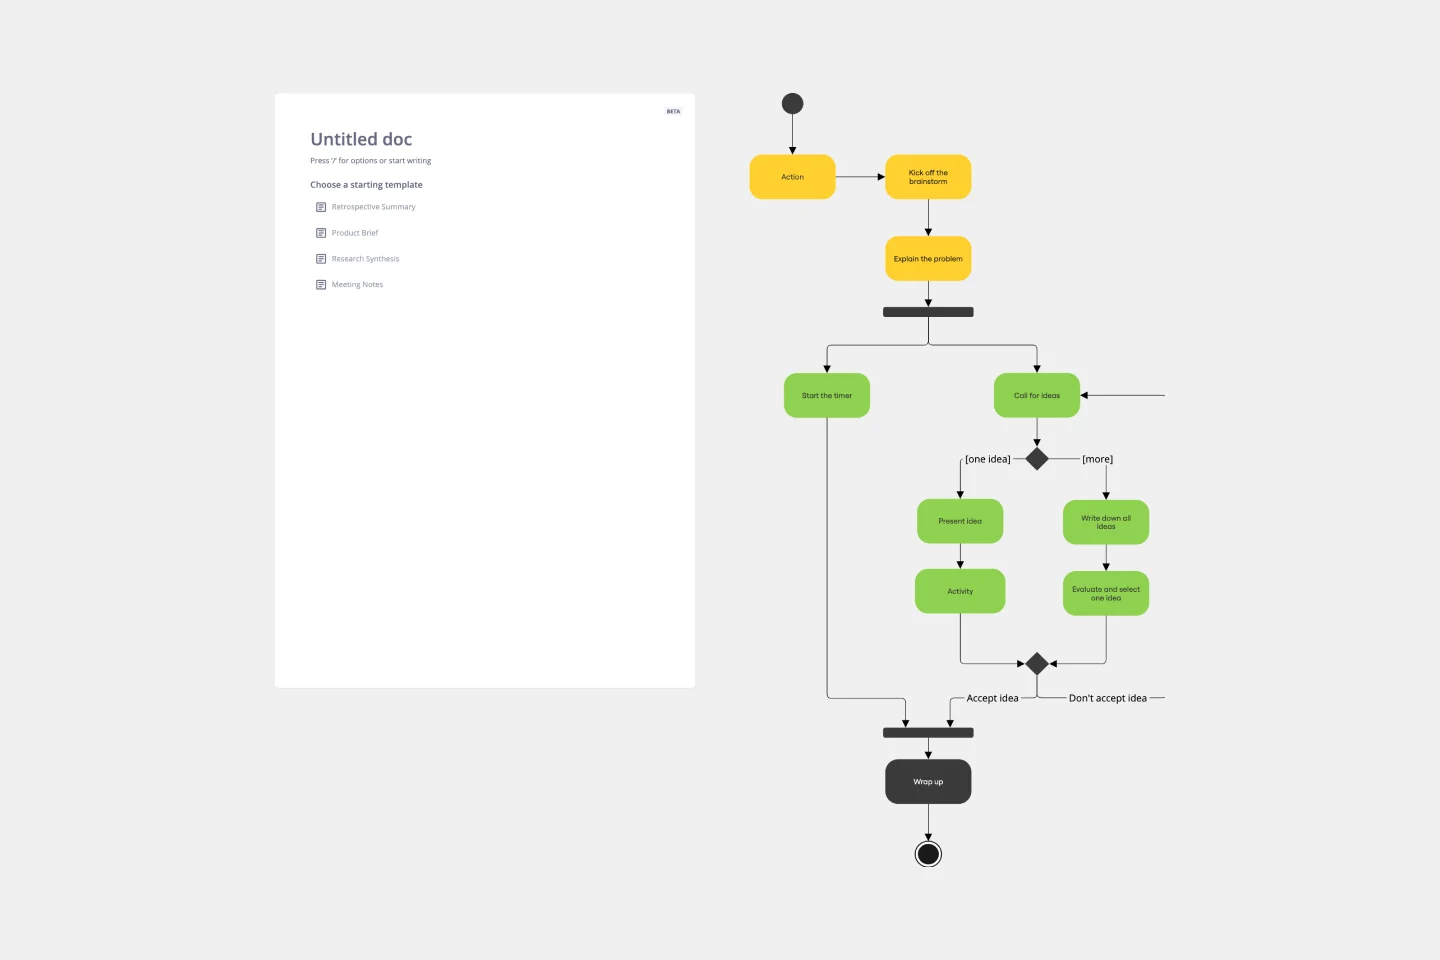
UML Activity Diagram Template
Works best for:
Diagrams
Use our Activity Diagram template to break down activities into smaller decisions and subprocesses. Improve and optimize systems and processes in I.T., business management, and more.