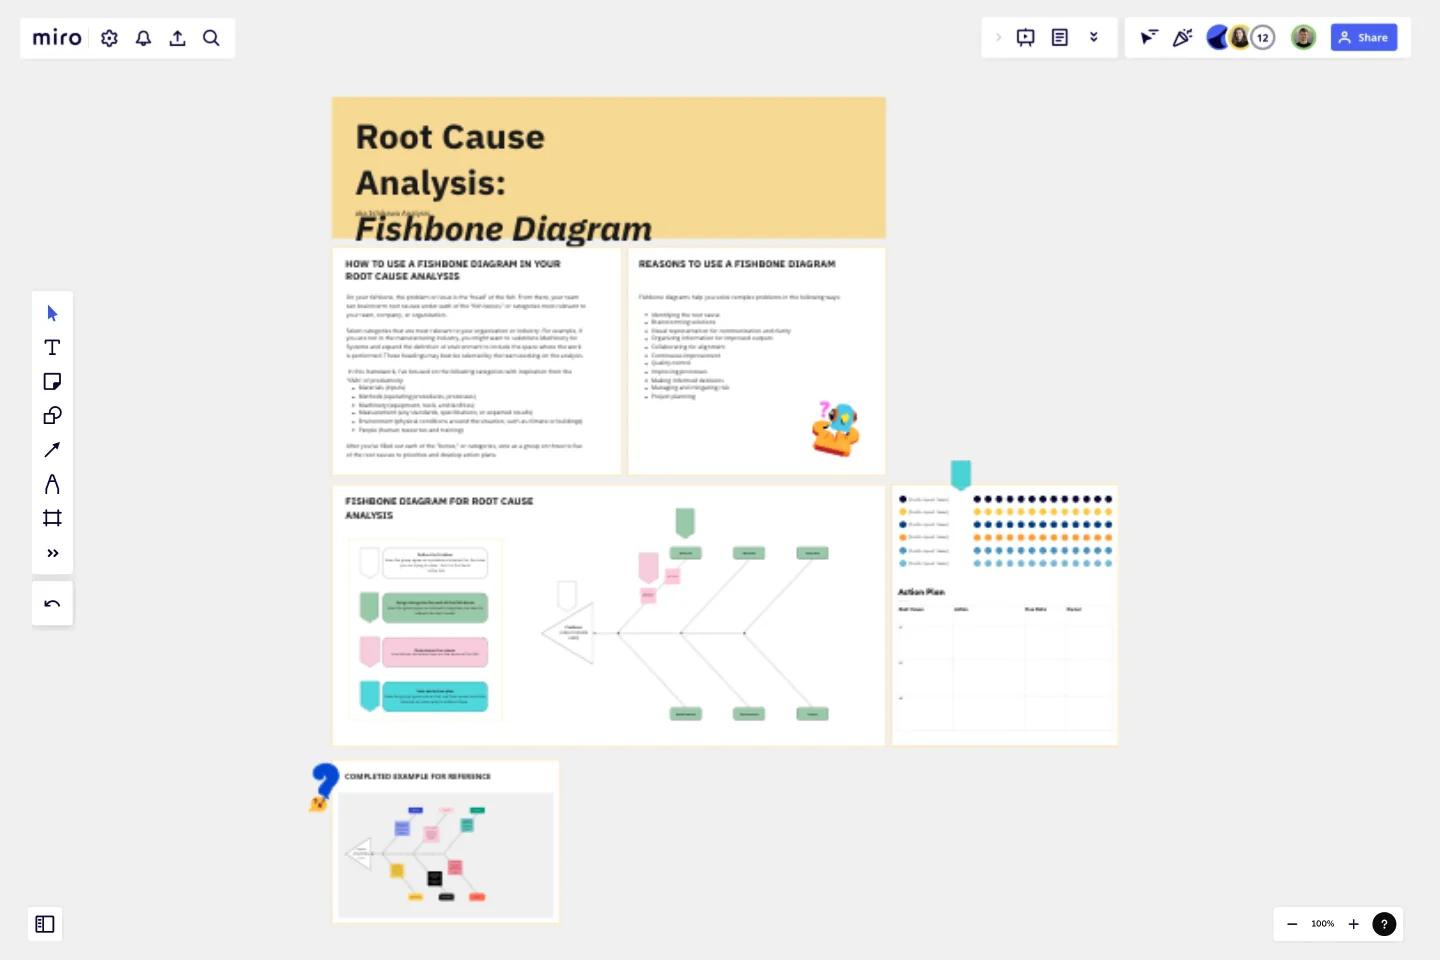
Fishbone RCA
Organizing your team with this Fishbone Diagram template in your next Root Cause Analysis is a systematic way to identify and solve problems.
Also known as the Ishikawa diagram, this technique provides a visual approach to understanding the root causes of complicated issues.
Overview of the Root Cause Analysis: Fish Diagram Template
The Fish Diagram is a visual representation of causal relationships, designed to uncover the underlying factors that contribute to a problem. Named after its resemblance to a fish's skeleton, the diagram segments a problem’s causes into different categories, such as People, Process, Equipment, Materials, Environment, and Management. By mapping out these categories, the Fish Diagram offers a holistic view of the issue, helping your team to identify the root cause.
Benefits of the Fish Diagram Template
Visual clarity: The Fish Diagram presents causes and their relationships visually, which facilitates a clear understanding of complex issues for individuals and teams.
Comprehensive analysis: The segmented categories ensure that all potential causes are explored, preventing oversight and leading to a thorough analysis.
Interdisciplinary collaboration: The diagram's structure encourages cross-functional collaboration, bringing together diverse expertise to address the issue.
Identifying root causes: By systematically mapping causes, the Fish Diagram enables the identification of the central issue, resulting in targeted solutions.
How to use the Fish Diagram Methodology
Define the problem: Begin by clearly defining the problem you're analyzing. This precise definition serves as a reference point throughout the process.
Work within the Fish Diagram: Attach your problem statement at the "head" of the fish within the template. Then, select relevant categories to label the "bones" extending from the spine (People, Process, etc.).
Brainstorm causes: Collaboratively brainstorm potential causes within each category, attaching them as branches to the corresponding diagonal lines.
Analyze relationships: Evaluate how causes within different categories might interact or contribute to the problem, adding sub-branches as needed.
Identify the root cause: Examine the diagram to identify the underlying factors that appear most influential. This will help you pinpoint the root cause.
Develop solutions: Based on the root cause, devise strategies to address the issue effectively. Ensure that solutions address the specific categories and sub-causes highlighted on the diagram.
Final thoughts
Whether you're working on a manufacturing issue, a project delay, the solution to a change request or a customer service concern, the Fish Diagram empowers you to see the bigger picture and take targeted action. With this Fish Diagram, you can steer your problem-solving efforts toward effective and lasting solutions with your team.
This templates was created by Project Management GameBoard.
Get started with this template right now.
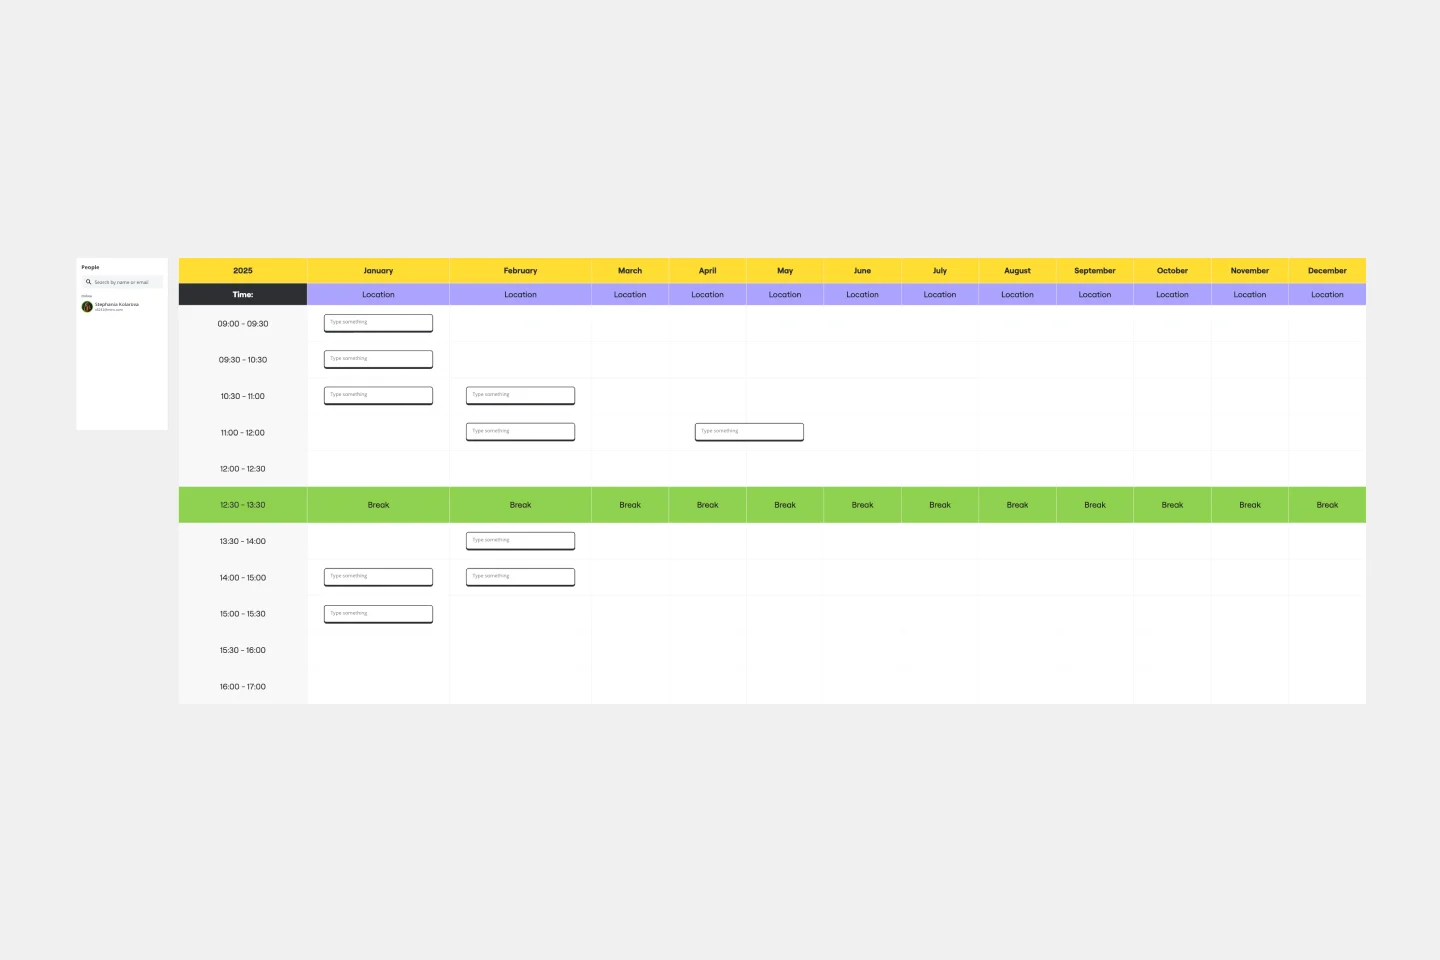
Monthly Schedule Template
Works best for:
Planning, Project Management
The Monthly Schedule Template is a flexible tool for long-term planning. It allows you to organize events, projects, and personal activities. You can easily adjust to accommodate changing priorities, unforeseen events, or long-term goals. This ensures sustained productivity and goal achievement.
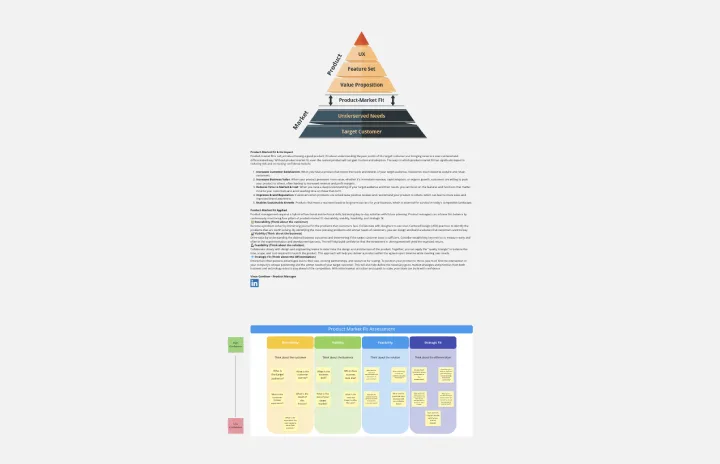
Product Market Fit Board
Works best for:
Product Management, Planning
The Product Market Fit Board template helps product teams assess and validate product-market fit. By capturing user feedback, analyzing market trends, and tracking key metrics, this template enables teams to evaluate product-market alignment objectively. With sections for defining target segments, identifying pain points, and prioritizing features, it guides teams through the process of optimizing product-market fit. This template serves as a tool for iteratively refining products to meet customer needs and drive market success.
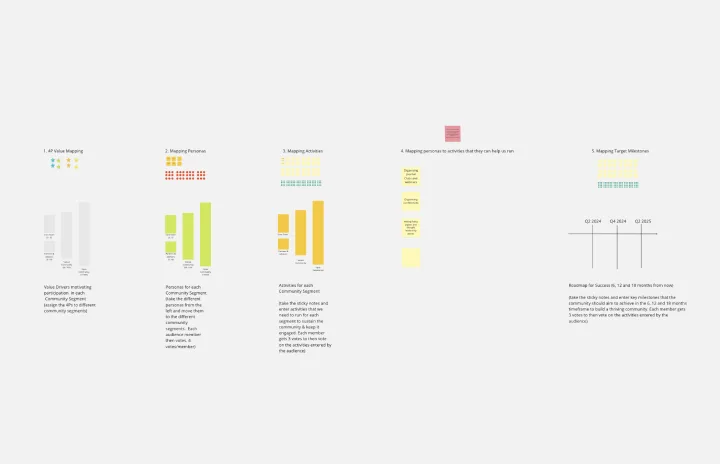
Community Building: A 5 Step Roadmap
Works best for:
Roadmap, Planning, Mapping
Use this five step process for building a community development roadmap.
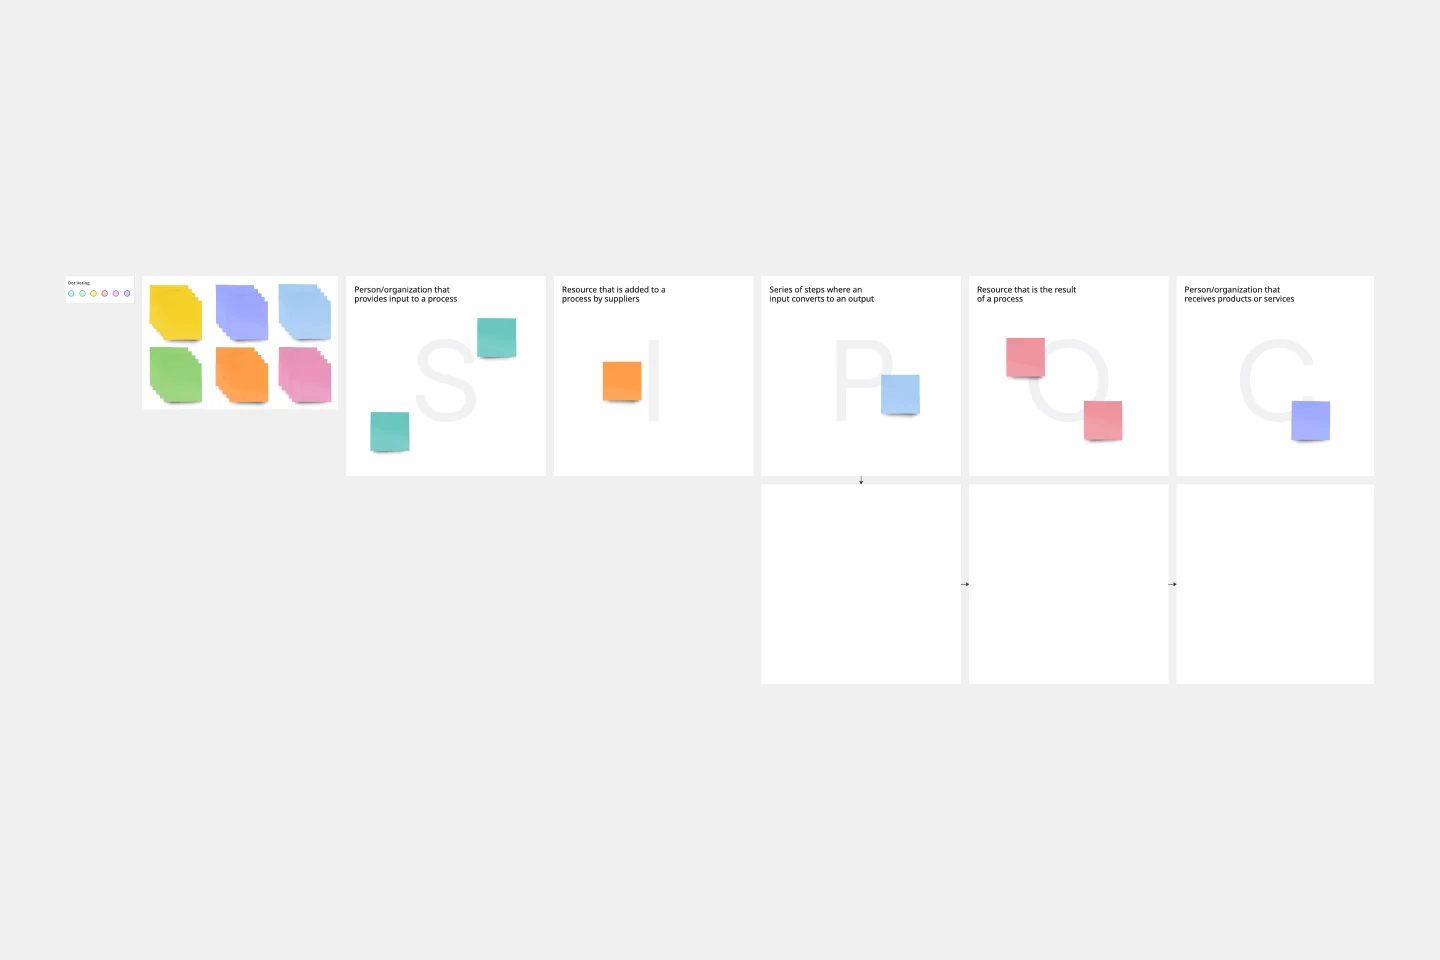
SIPOC Template
Works best for:
Agile Methodology, Strategic Planning, Mapping
A SIPOC diagram maps a process at a high level by identifying the potential gaps between suppliers and input specifications and between customers and output specifications. SIPOC identifies feedback and feed-forward loops between customers, suppliers, and the processes and jump-starts the team to think in terms of cause and effect.
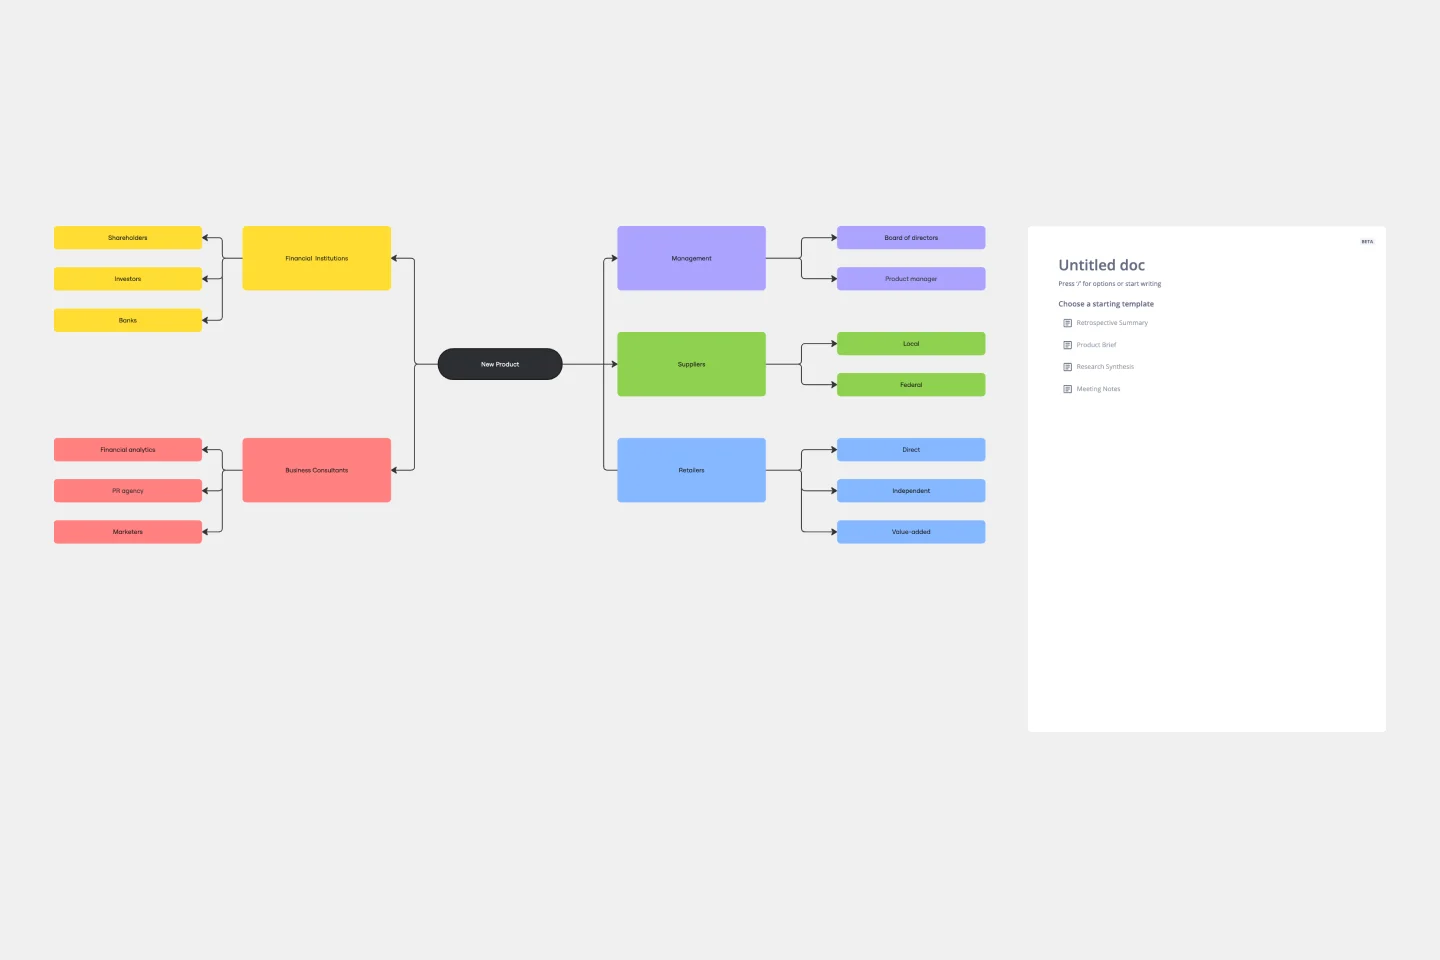
Stakeholder Mapping Template
Works best for:
Business Management, Mapping, Workflows
A stakeholder map is a type of analysis that allows you to group people by their power and interest. Use this template to organize all of the people who have an interest in your product, project, or idea in a single visual space. This allows you to easily see who can influence your project, and how each person is related to the other. Widely used in project management, stakeholder mapping is typically performed at the beginning of a project. Doing stakeholder mapping early on will help prevent miscommunication, ensure all groups are aligned on the objectives and set expectations about outcomes and results.
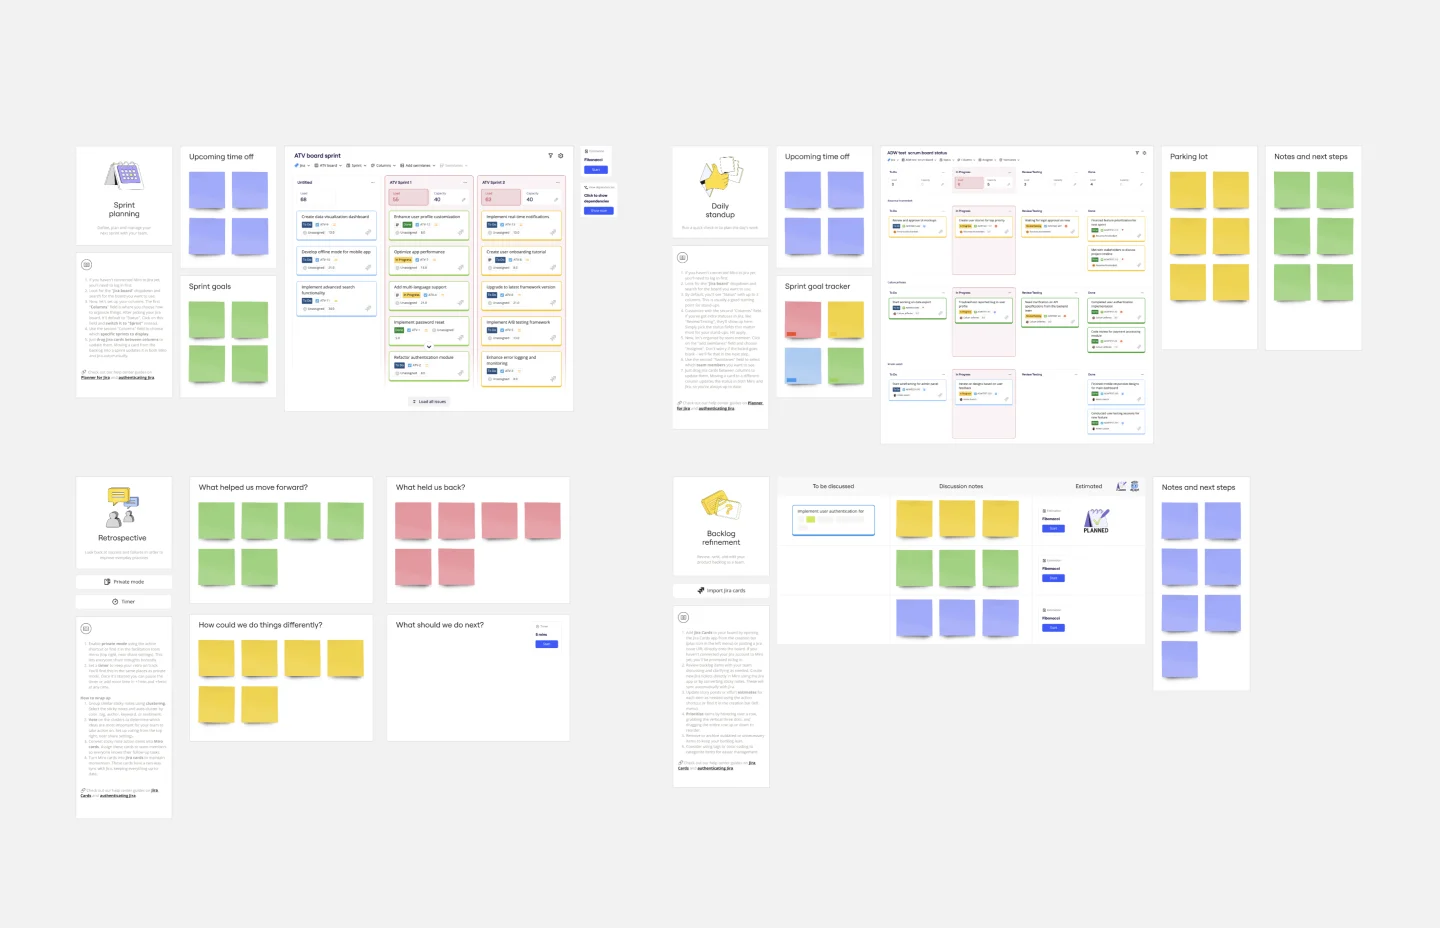
Agile Team Events with Jira Template
Works best for:
Agile , Agile workflows
The Agile Team Events with Jira template in Miro is designed to streamline Agile workflows and enhance team collaboration. This template integrates seamlessly with Jira, allowing teams to manage their Agile events such as sprint planning, daily stand-ups, sprint reviews, and retrospectives directly within Miro. One significant benefit of this template is its ability to provide real-time updates. Any changes made in Miro can be synced back to Jira, ensuring that all team members are on the same page and that the project management tool reflects the latest status. This feature helps in maintaining consistency and accuracy across all Agile processes, reducing the risk of miscommunication and enhancing overall productivity.