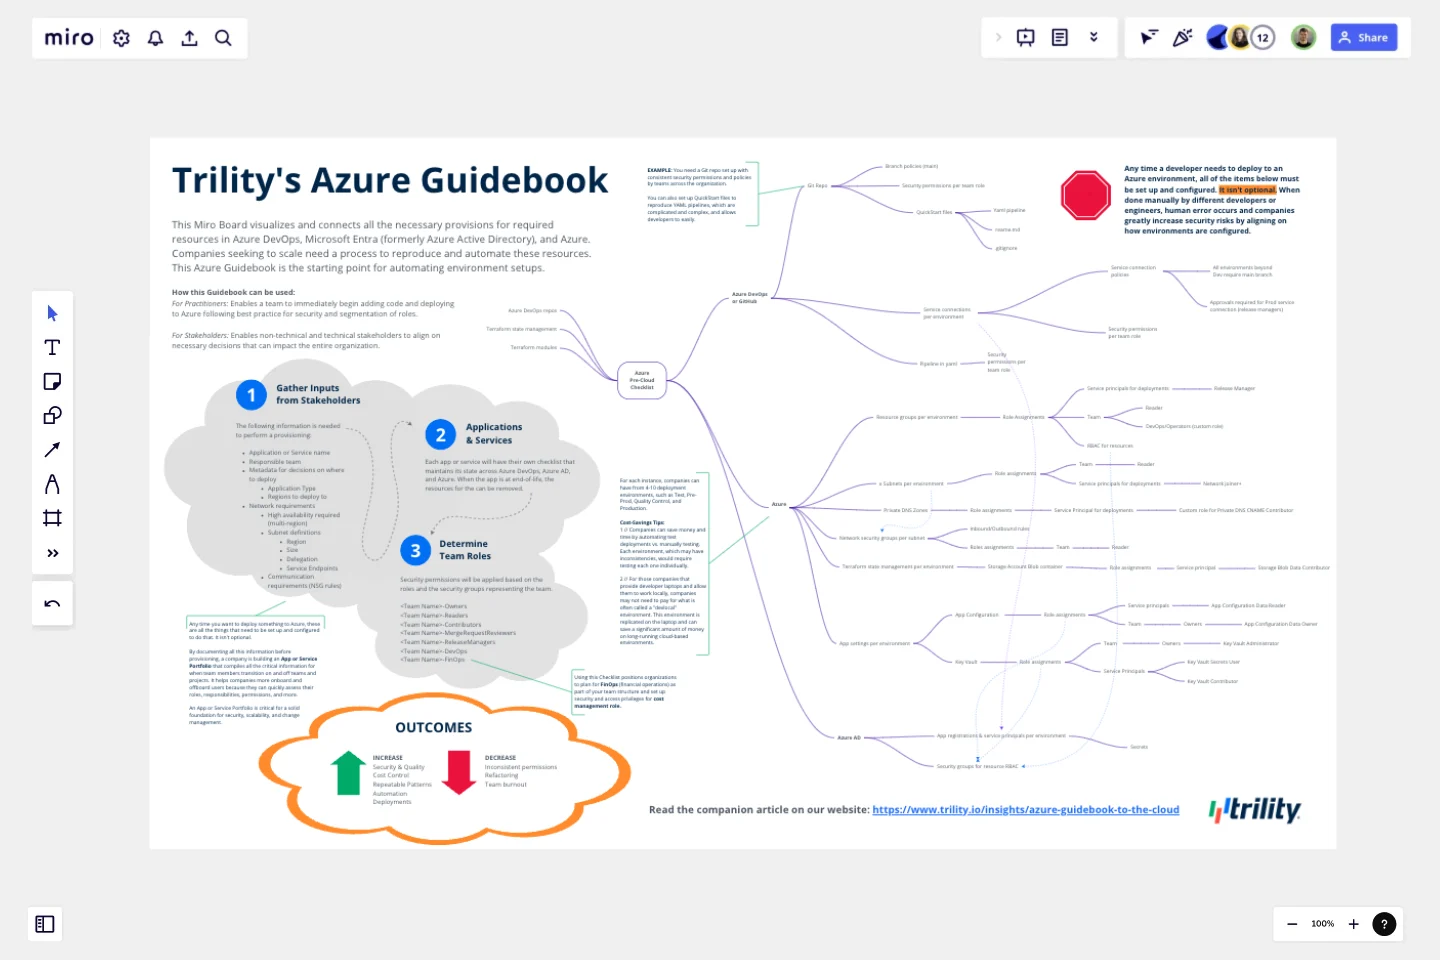
Azure Guidebook
This Miro Board visualizes and connects all the necessary provisions for required resources in Azure DevOps, Microsoft Entra (formerly Azure Active Directory), and Azure.
Companies seeking to scale need a process to reproduce and automate these resources. This Azure Guidebook is the starting point for automating environment setups.
This template was created by Trility Consulting.
Get started with this template right now.
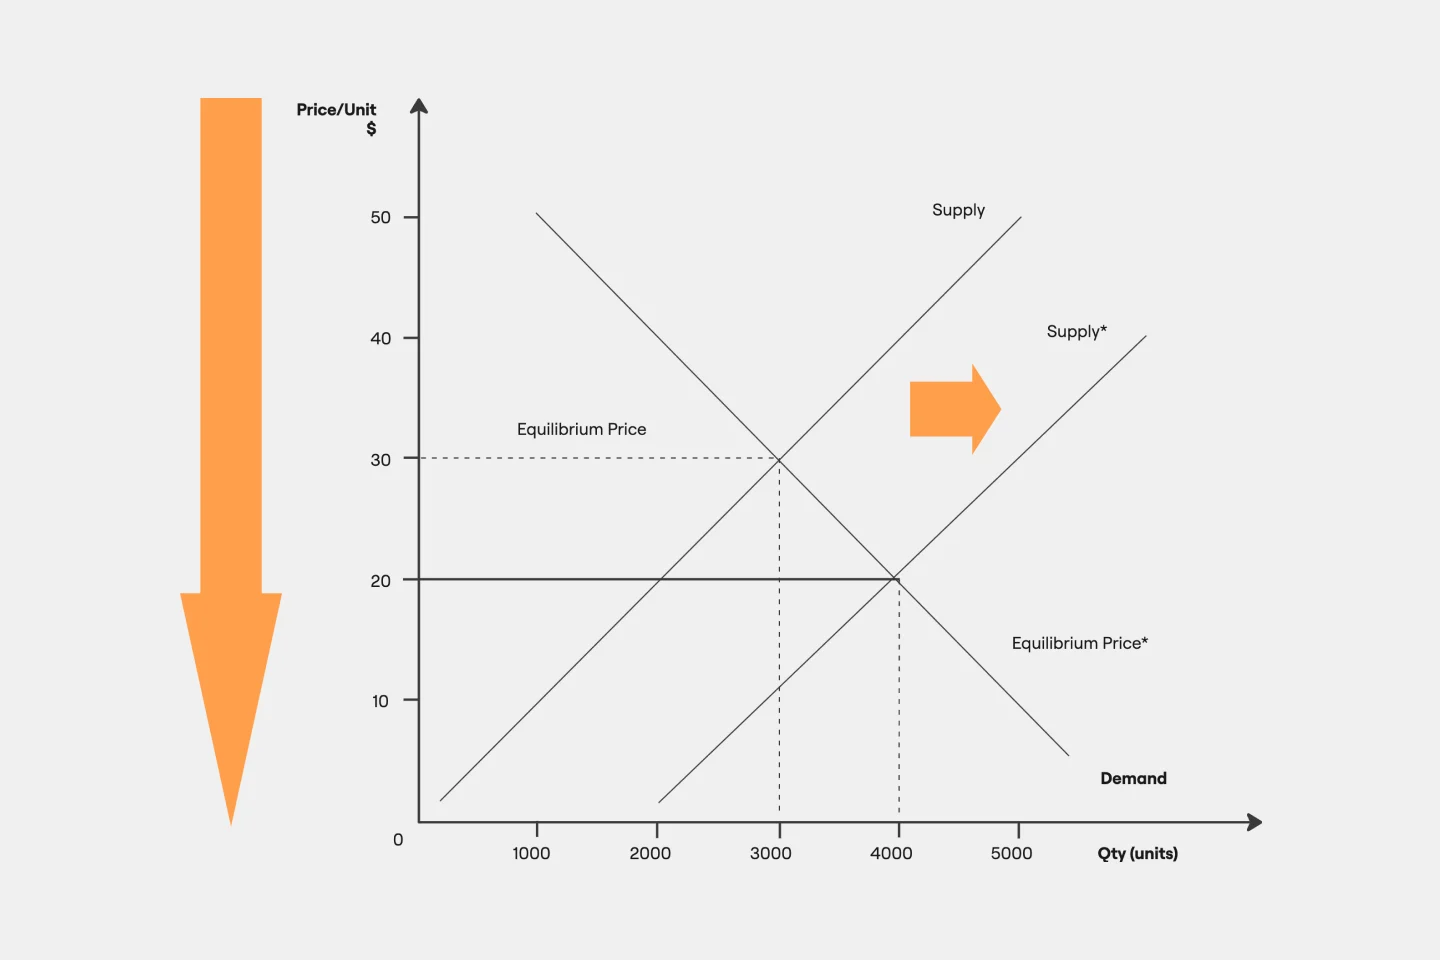
Supply and Demand Graph Template
Works best for:
Market Research, Mapping, Diagrams
How do you price your product so that you make a profit while keeping customers and manufacturers happy? By finding a fair price. A supply and demand diagram is a graph that visualizes how much demand there is for your product and how many products you need. This, in turn, helps you with product pricing.
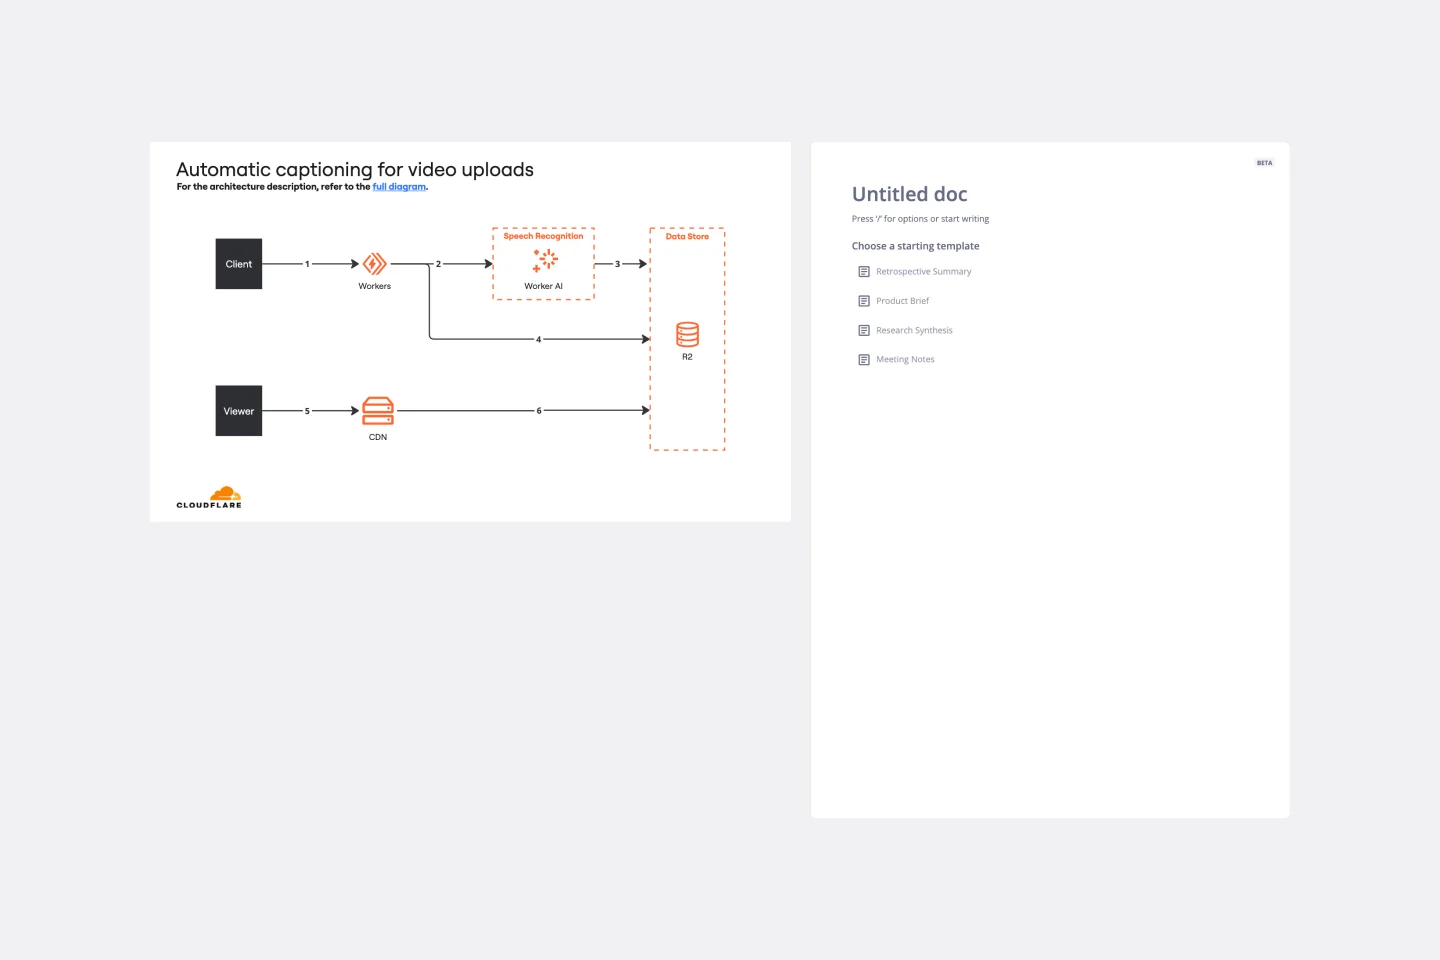
Cloudflare Automatic Captioning for Video Template
The Cloudflare Automatic Captioning for Video Template in Miro is a powerful tool designed to enhance the accessibility and engagement of video content. By leveraging Cloudflare's technology, this template helps outline the captioning process for videos. It not only makes content accessible to a broader audience, including those who are deaf or hard of hearing but also boost viewer engagement by making videos consumable in sound-sensitive environments or by individuals who prefer reading along.
Chat-Bot
Works best for:
Diagramming
The Chat Bot template is a visual tool for designing and mapping out chatbot interactions and functionalities. It provides a structured framework for visualizing conversation flows, user inputs, and bot responses. This template enables teams to collaborate on designing chatbot experiences that are intuitive and user-friendly, driving engagement and satisfaction. By promoting clarity and alignment, the Chat-Bot template empowers organizations to create effective chatbot solutions that meet user needs and business objectives.
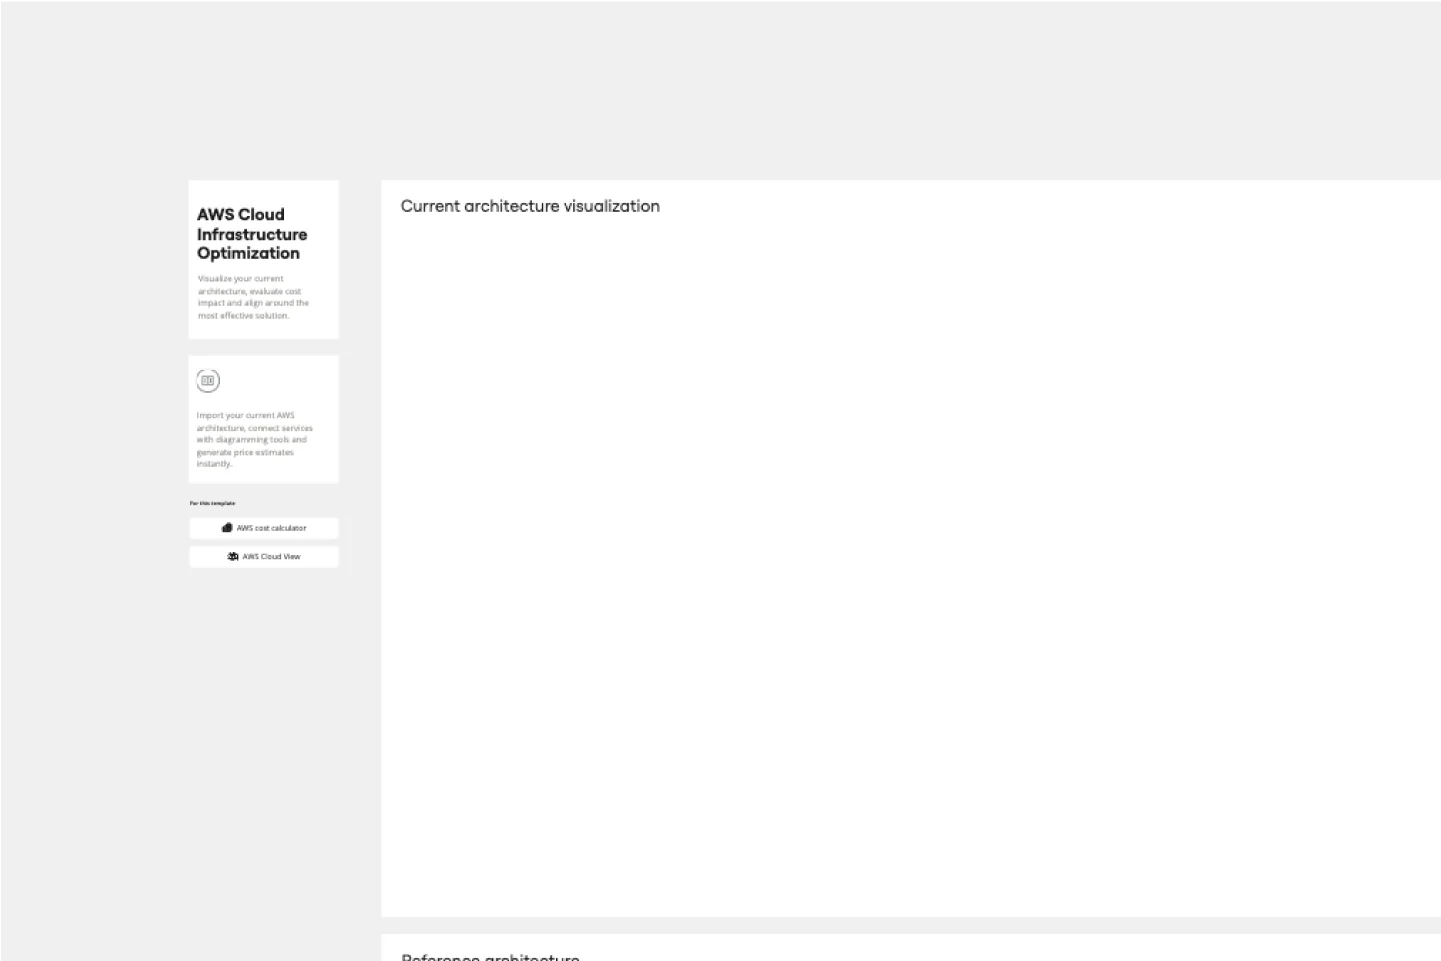
AWS Cloud Infrastructure Optimization Template
Works best for:
AWS , Diagramming
The AWS Cloud Infrastructure Optimization Template is part of Miro's Intelligent Templates collection, designed to streamline and enhance the management of your AWS cloud resources. This template leverages Miro's advanced diagramming tools and integrates seamlessly with AWS to provide real-time data visualization, cost analysis, and performance optimization. One key benefit of using this template is its ability to auto-generate detailed diagrams of your current AWS setup, providing a clear visual representation of your architecture. This feature saves time and reduces the manual effort required to visualize and optimize your AWS infrastructure, making it easier to manage and scale your cloud resources effectively.
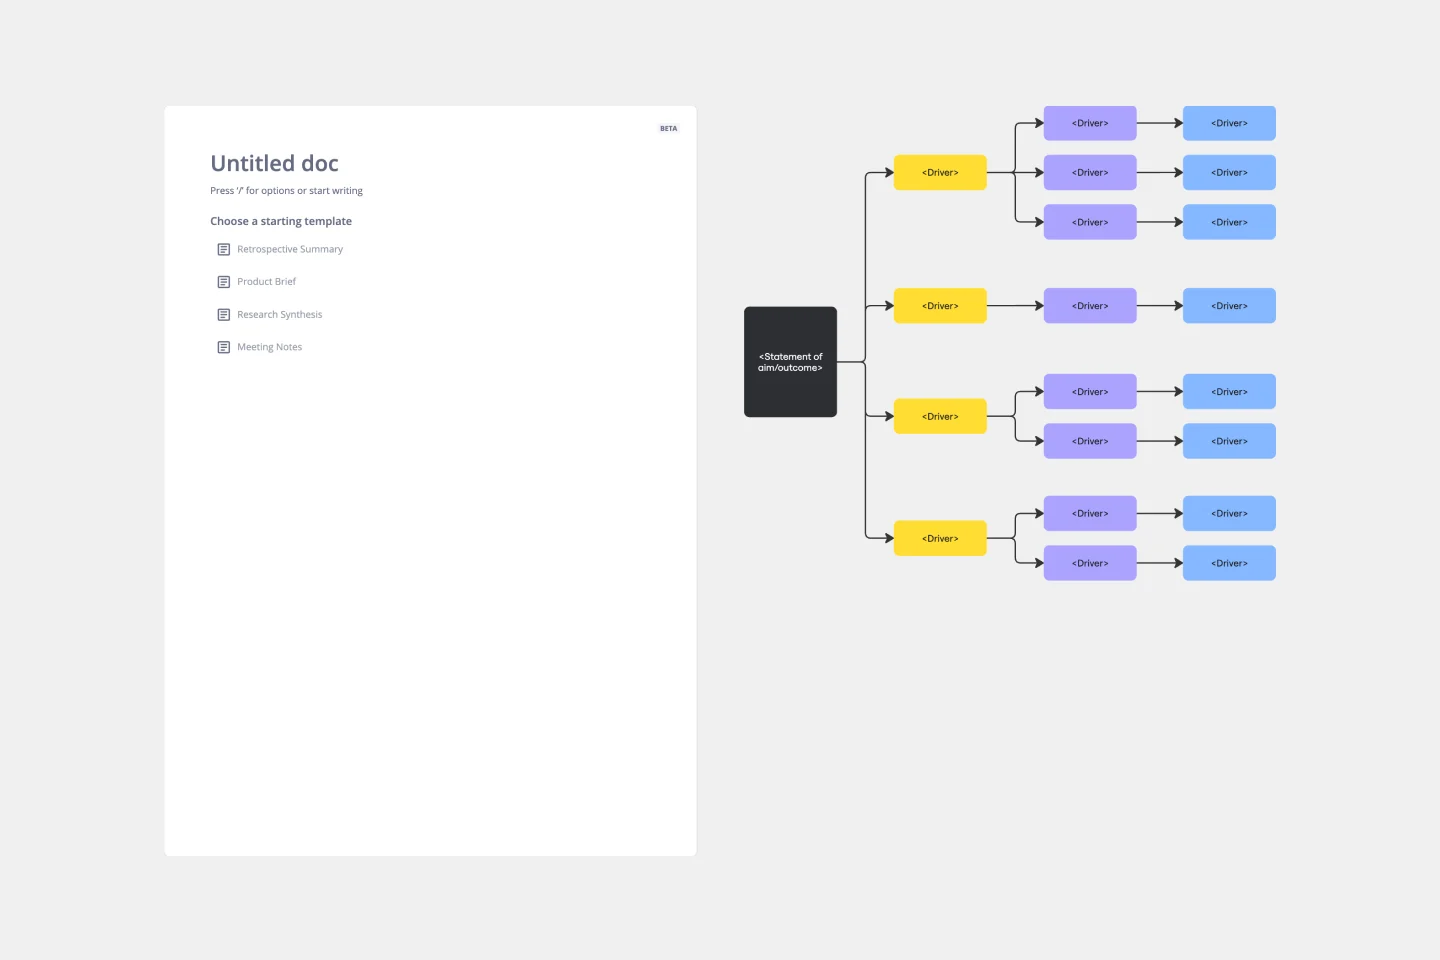
Driver Diagram Template
Works best for:
Diagramming
The driver diagram template is a strategic visual tool that helps teams map out their primary objectives and break them down into actionable components. It presents goals, drivers, and specific change ideas in a coherent and interconnected format, ensuring clarity of objective. By doing so, every team member is aligned towards a common endpoint, fostering unified efforts. The visual nature of the template simplifies complex objectives, making it easier for teams to stay on track and measure their progress effectively.
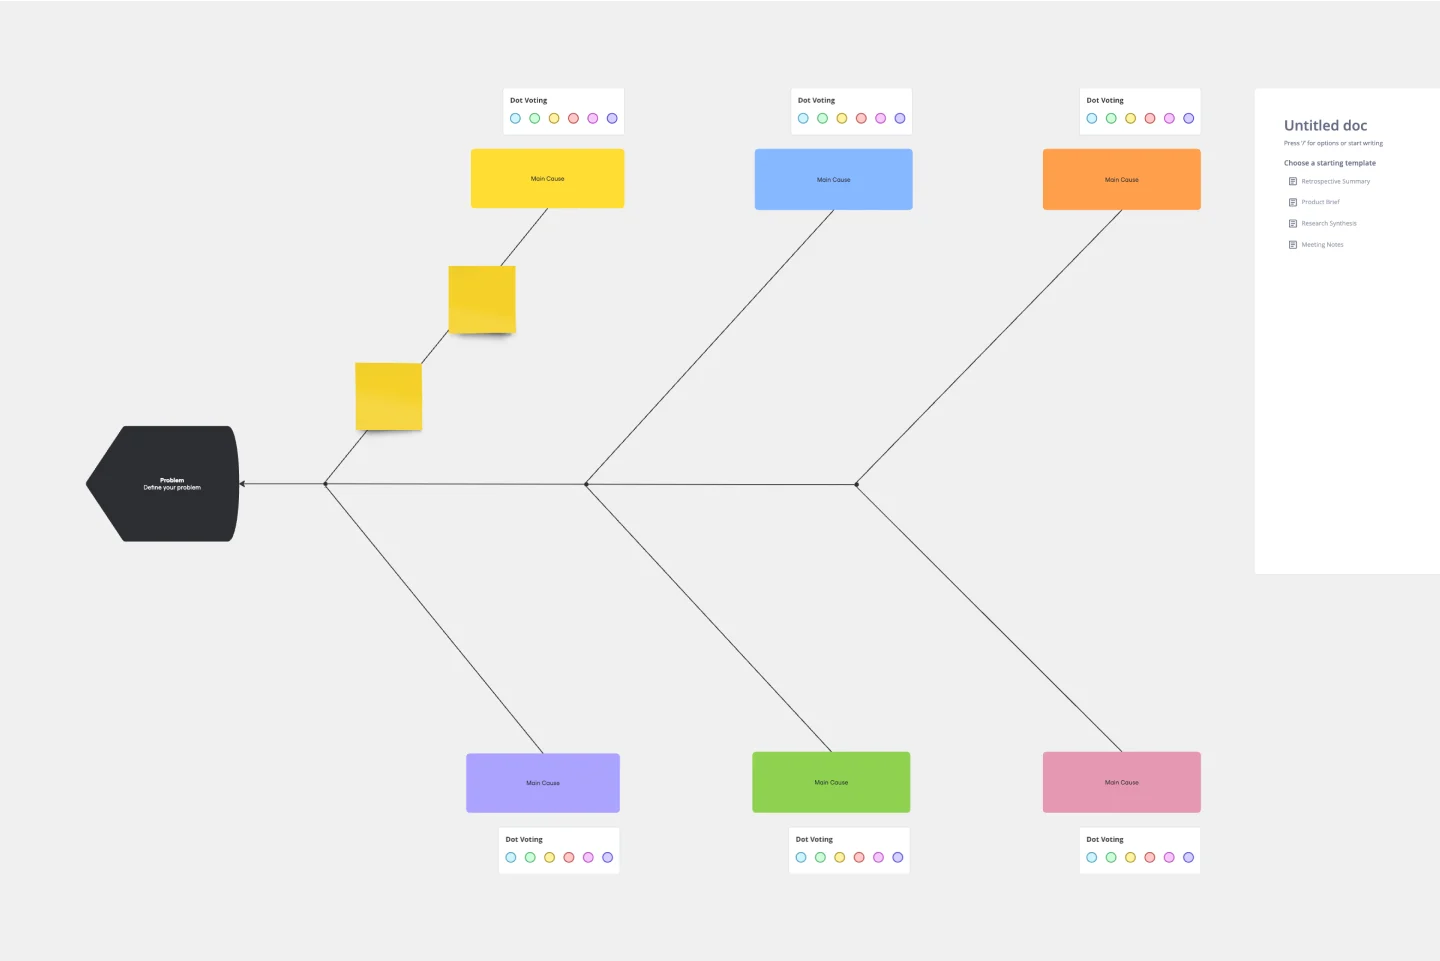
Fishbone Diagram Template
Works best for:
Operations, Diagrams, Workflows
What is the best way to solve any problem your team faces? Go straight to the root. That means identifying the root causes of the problem, and fishbone diagrams are designed to help you do it best. Also known as the Ishikawa Diagram (named after Japanese quality control expert Kaoru Ishikawa), fishbone diagrams allow teams to visualize all possible causes of a problem, to explore and understand how they fit together holistically. Teams can also use fishbone diagrams as a starting point for thinking about what the root cause of a future problem might be.