Azure Demand Forecasting Template
The Azure Demand Forecasting diagram will show the architecture of a demand forecast, making it easier for you to predict data consumption, costs, and forecast results.
Available on Enterprise, Business, Education plans.
About the Azure Demand Forecasting
The Azure Demand Forecasting diagram will show the architecture of a demand forecast, making it easier for you to predict data consumption, costs, and forecast results. Azure is Microsoft’s cloud computing platform, designed to provide cloud-based services such as remote storage, database hosting, and centralized account management.
Keep reading to learn more about the Azure Demand Forecasting Template.
What is an Azure Demand Forecasting Template
The Azure Demand Forecasting Template, like any other diagram, visually shows the necessary steps for demand forecasting. The Azure Demand Forecasting Template has unique icons categorized into Stencils. Each Stencil focuses on a specific task to make it easier for users to access the right set of icons.
When to use Azure Demand Forecasting Template
You can use the Azure Demand Forecasting Template to predict demand for a product in a retail/online store, forecast hospital visits, and anticipate power consumption.
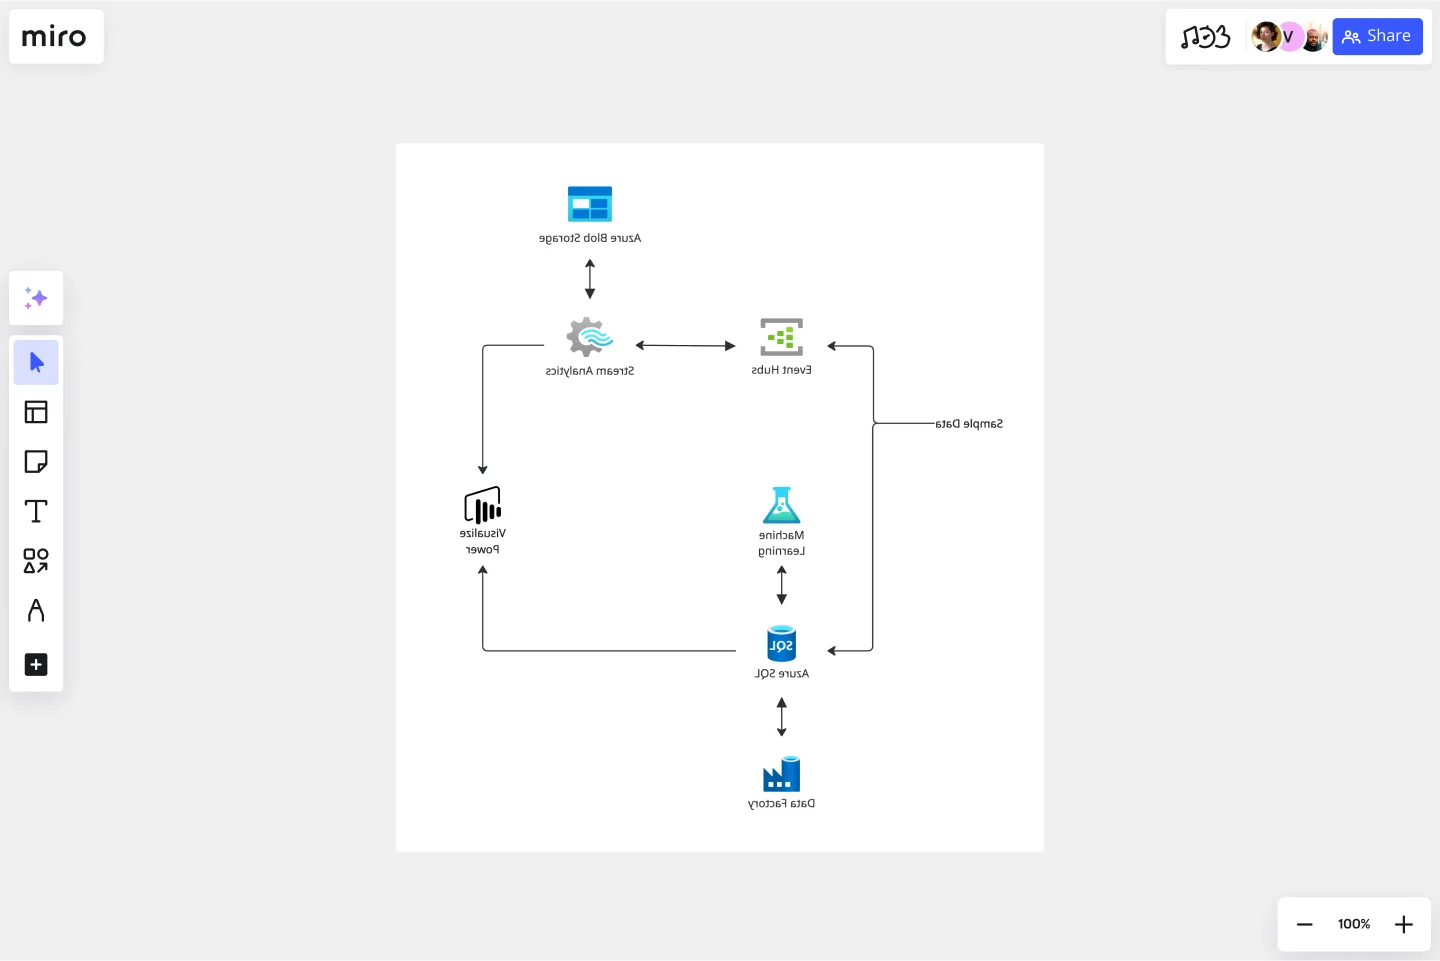
The Azure Demand Forecasting Template combines several Azure services to provide actionable predictions:
Event Hubs collects real-time consumption data.
Stream Analytics aggregates the streaming data and makes it available for visualization.
Azure SQL Database stores and transforms the consumption data.
Machine Learning implements and executes the forecasting model.
Power BI visualizes the real-time energy consumption and the forecast results.
Finally, Data Factory orchestrates and schedules the entire data flow.
How-To Section:
Here are some of the Stencils and their meaning when implementing the Azure Demand Forecasting Template:
How do I make an Azure Demand Forecasting Template?
To make an Azure Demand Forecasting in Miro is easy. You can use our Azure Demand Forecasting Template and customize it as you see fit. Once you have the diagram structure, you can start adding the icons. You can find the icons under our Azure Icon Set integration.
Get started with this template right now. Available on Enterprise, Business, Education plans.
AWS Control Tower Account Governance Template
Works best for:
AWS
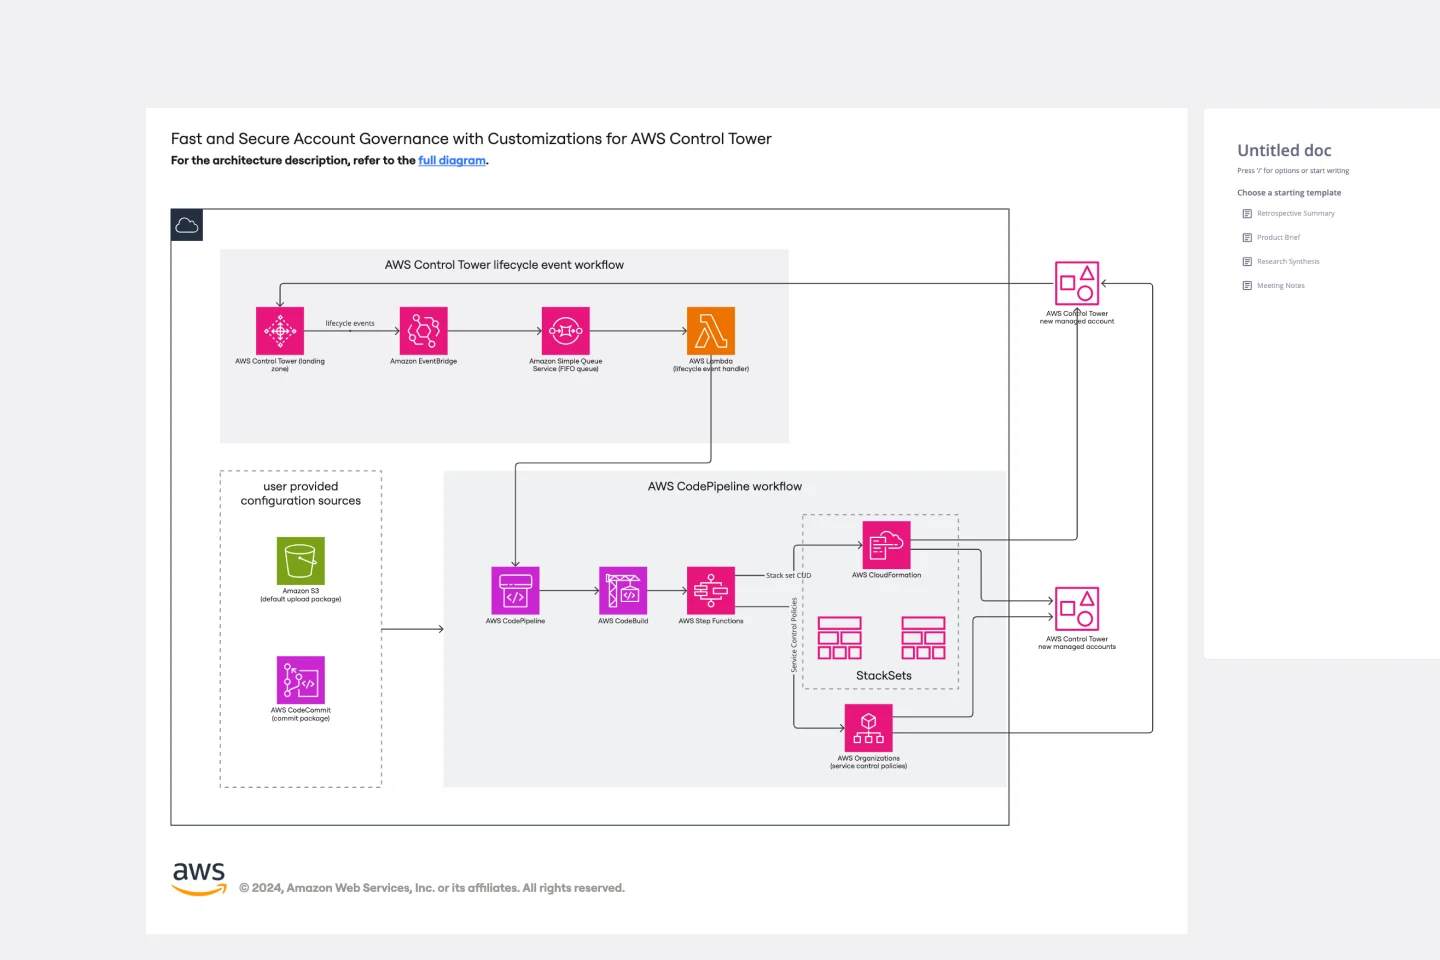
The AWS Control Tower Account Governance Template streamlines the setup and management of governance across multiple AWS accounts. It leverages AWS Control Tower to automate and simplify the governance process, ensuring that your AWS environment adheres to best practices for security, operations, and compliance. This template is highly customizable, allowing you to adjust governance controls and policies to meet the unique requirements of your organization. It provides a centralized view of your AWS environment, enhancing visibility and control, and scales with your organization as it grows.
Cisco Data Network Diagram Template
Works best for:
Software Development
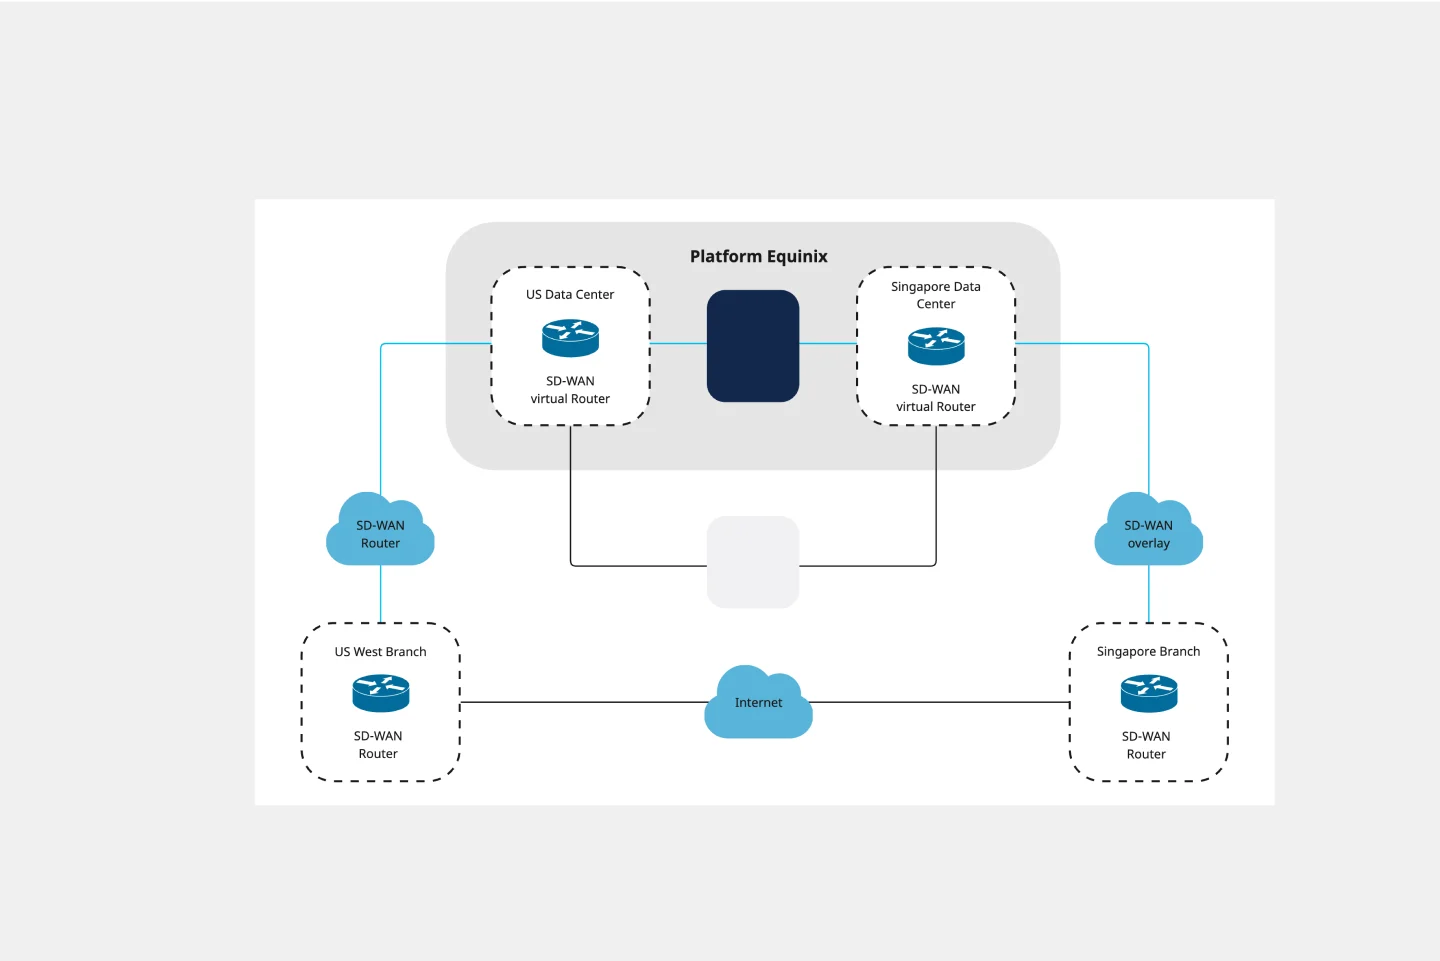
Cisco offers data center and access networking solutions built for scale with industry-leading automation, programmability, and real-time visibility. The Cisco Data Network Diagram uses Cisco elements to show the network design of Cisco Data Networks visually.
Interrelationship Diagram
Works best for:
Diagramming
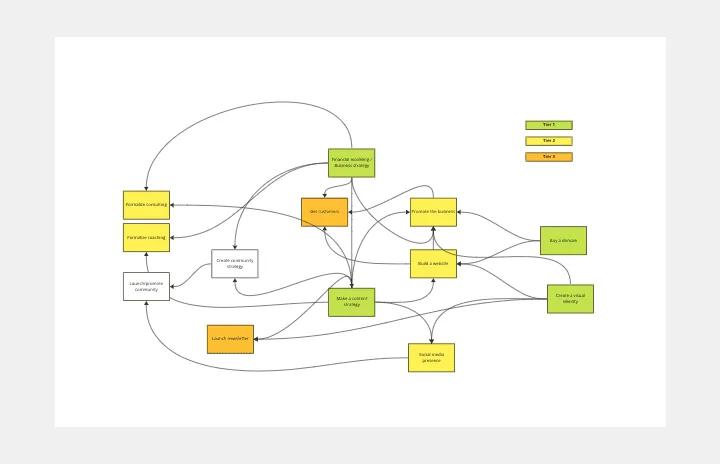
The Interrelationship Diagram template is a visual tool for analyzing and illustrating complex relationships between variables or elements within a system. It provides a structured framework for mapping out connections, dependencies, and interactions. This template enables teams to visualize patterns, identify causal relationships, and uncover insights into system behavior. By promoting systems thinking and understanding of interdependencies, the Interrelationship Diagram empowers organizations to make informed decisions and drive effective solutions to complex problems.
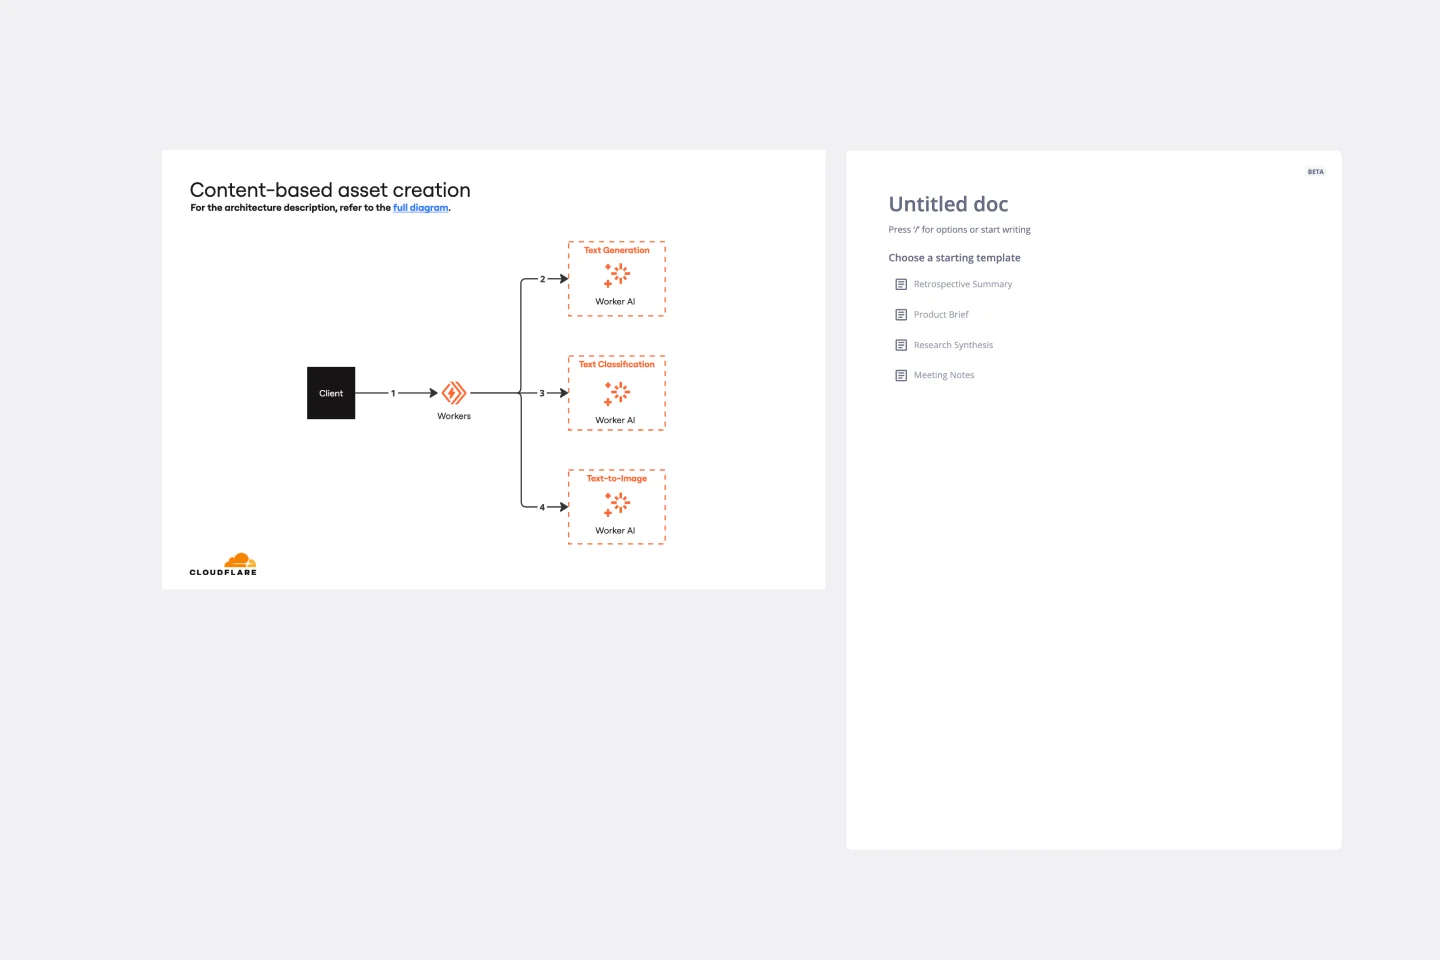
Cloudflare Content-based Asset Creation Template
The Cloudflare Content-based Asset Creation Template enhances efficiency and collaboration within teams working on cloud infrastructure projects. This template provides a structured and intuitive framework for creating and managing digital assets, which streamlines the asset creation process.
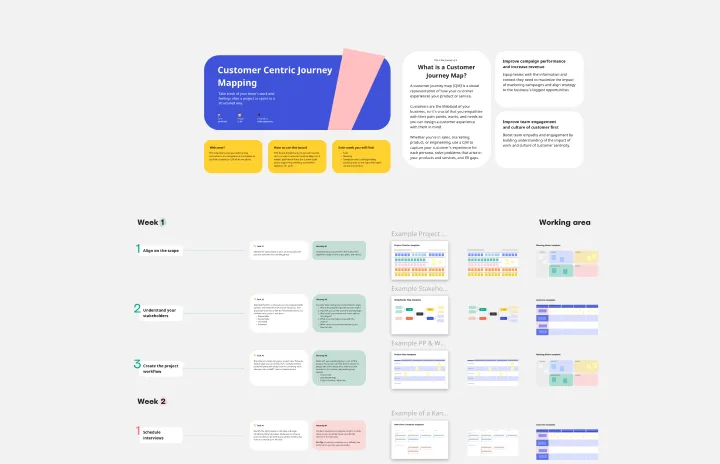
Customer Journey Mapping Template Pack
Works best for:
Mapping, User Experience, Workshops
A customer journey map (CJM) is a visual representation of your customer’s experience. It allows you to capture the path that a customer follows when they buy a product, sign up for a service, or otherwise interact with your site. Most maps include a specific persona, outlines their customer experience from beginning to end, and captures the potential emotional highs and lows of interacting with the product or service. Use this template to easily create customer journey maps for projects of all kinds.
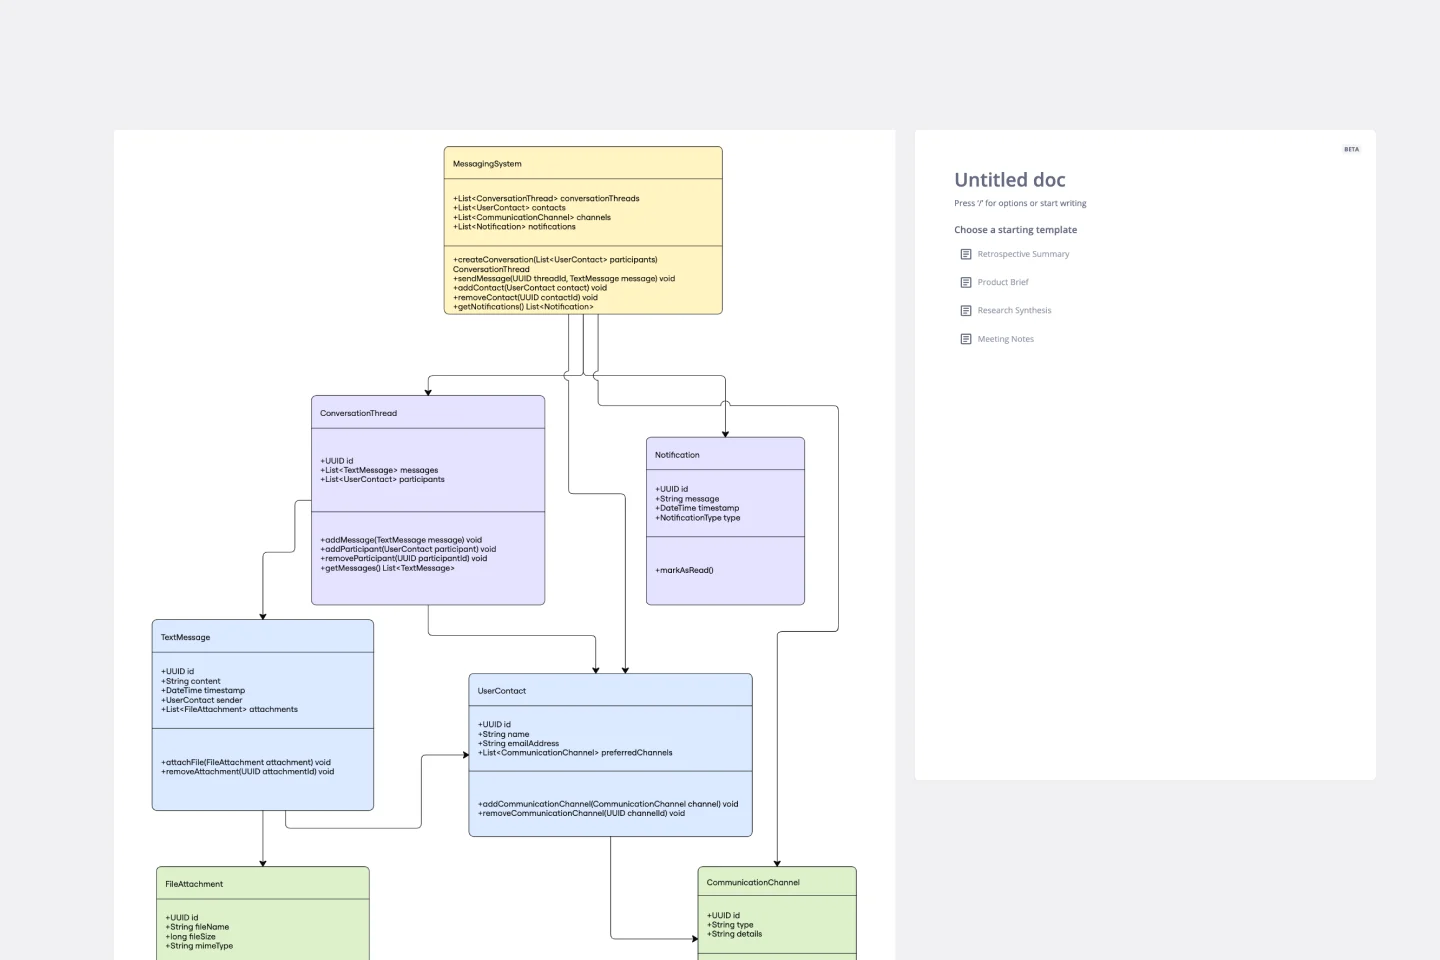
UML Class Messaging System Template
Works best for:
UML
The UML Class Messaging System Template streamlines the process of designing and analyzing messaging systems. It allows users to visually map out the structure of a system by detailing classes, their attributes, operations, and the relationships among objects. This template is particularly useful for illustrating the functionality of a messaging system, including the management of text messages, conversation threads, user contacts, notifications, and channels. It offers a clear visual representation of how all these elements interact within the system, making it an invaluable resource for developers, designers, and stakeholders aiming to enhance communication and reduce errors in the development phase.