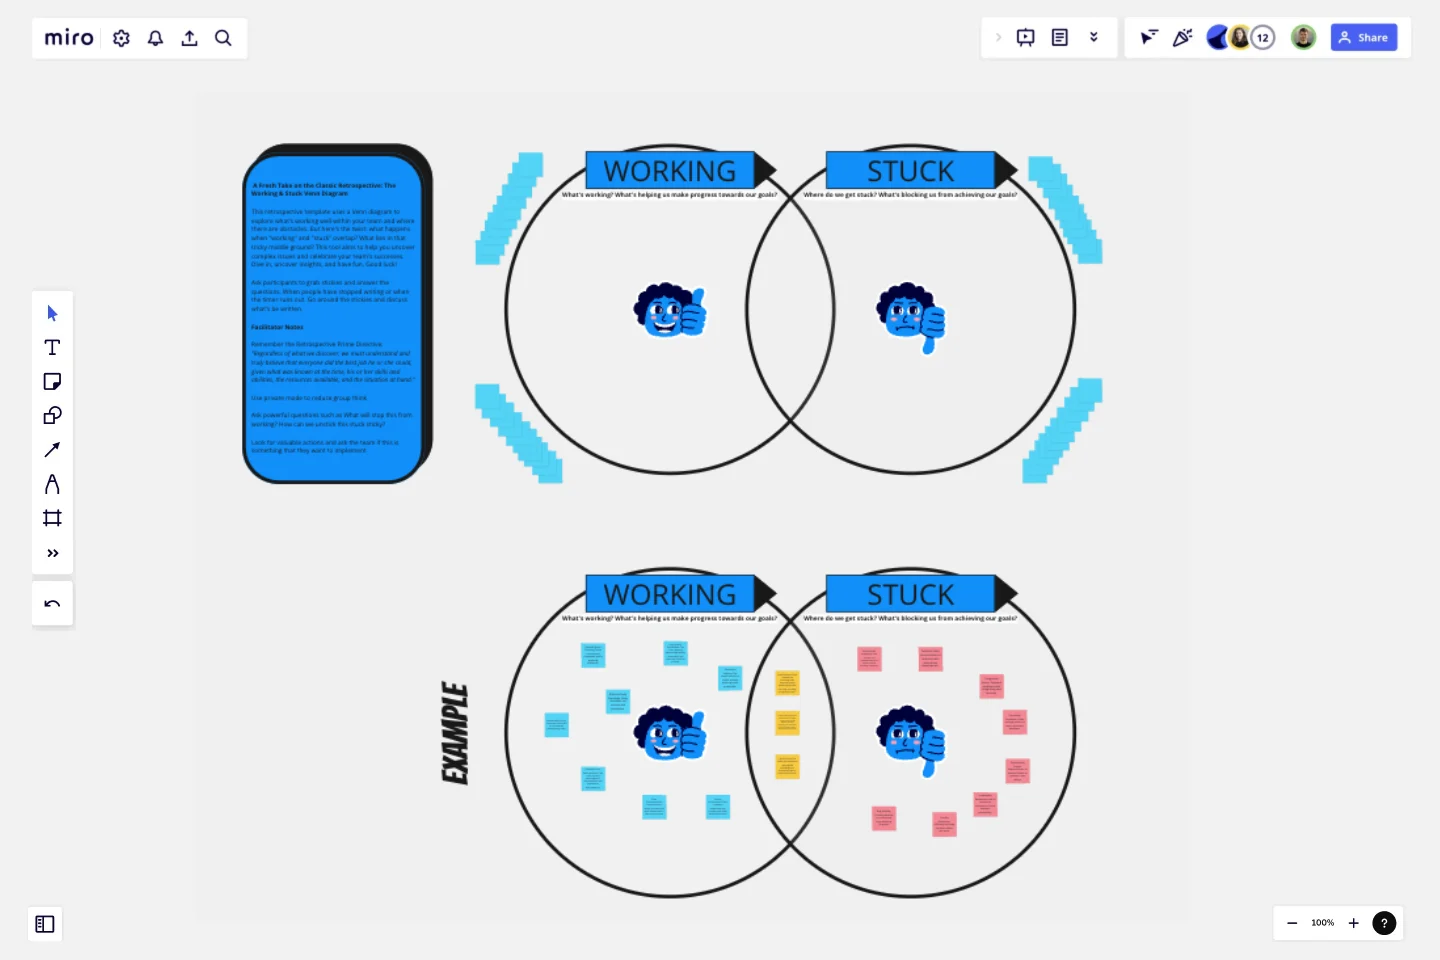
The Working & Stuck Venn Diagram
This retrospective template uses a Venn diagram to explore what's working well within your team and where there are obstacles.
But here's the twist: what happens when "working" and "stuck" overlap? What lies in that tricky middle ground? This tool aims to help you uncover complex issues and celebrate your team's successes. Dive in, uncover insights, and have fun. Good luck!
This template was created by Joe Fitzpatrick.
Get started with this template right now.
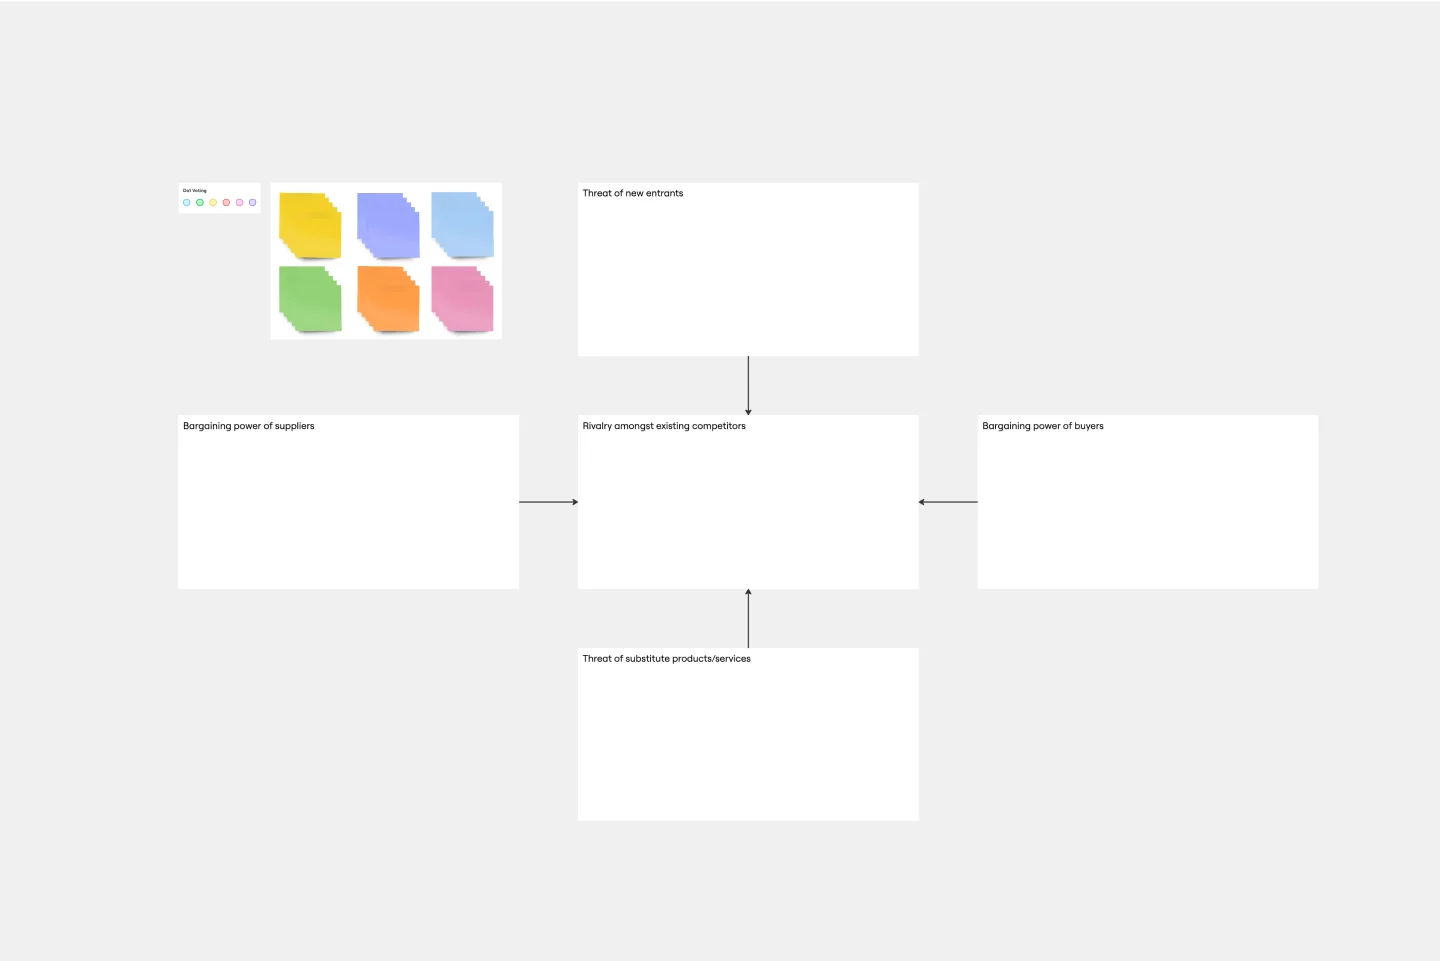
Porter's Five Forces Template
Works best for:
Leadership, Strategic Planning, Market Research
Developed by Harvard Business School professor Michael Porter, Porter’s Five Forces has become one of the most popular and highly regarded business strategy tools available for teams. Use Porter’s Five Forces to measure the strength of your current competition and decide which markets you might be able to move into. Porter’s Five Forces include: supplier power, buyer power, rivalry among existing competitors, the threat of substitute products or services, the threat of substitute products and services, and the threat of new entrants.
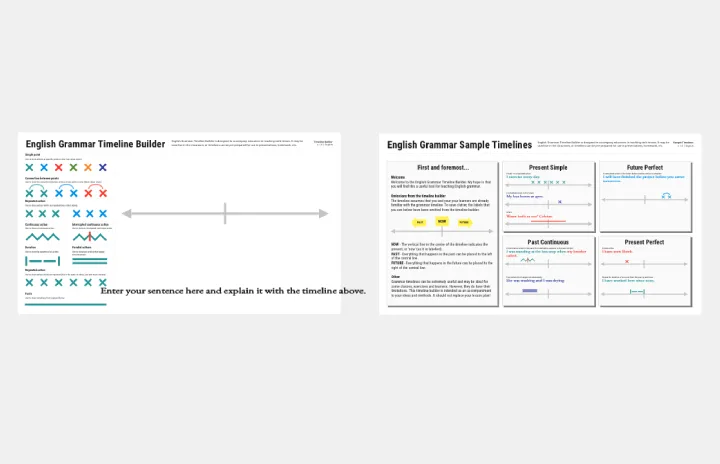
English Grammar Timeline Builder
The English Grammar Timeline template helps you map out the progression of grammar concepts over time. This is a great tool for educators and students to visualize the sequence and relationship between different grammar topics, making learning and teaching more effective.
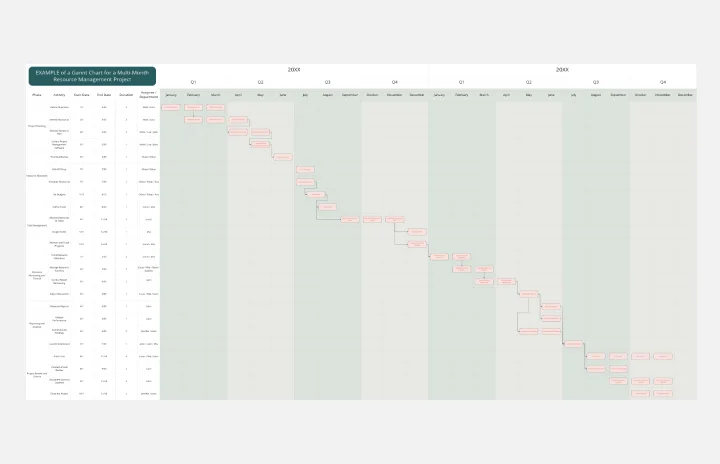
Resource Management Gantt Chart
Works best for:
Strategy, Planning
Efficient resource allocation is crucial for project success. The Resource Management Gantt Chart template helps you plan and manage your resources effectively. Use it to track the availability and allocation of personnel, equipment, and materials throughout your project. This template ensures resources are optimally utilized, reducing waste and avoiding delays, providing a clear overview of assignments and workload balance.
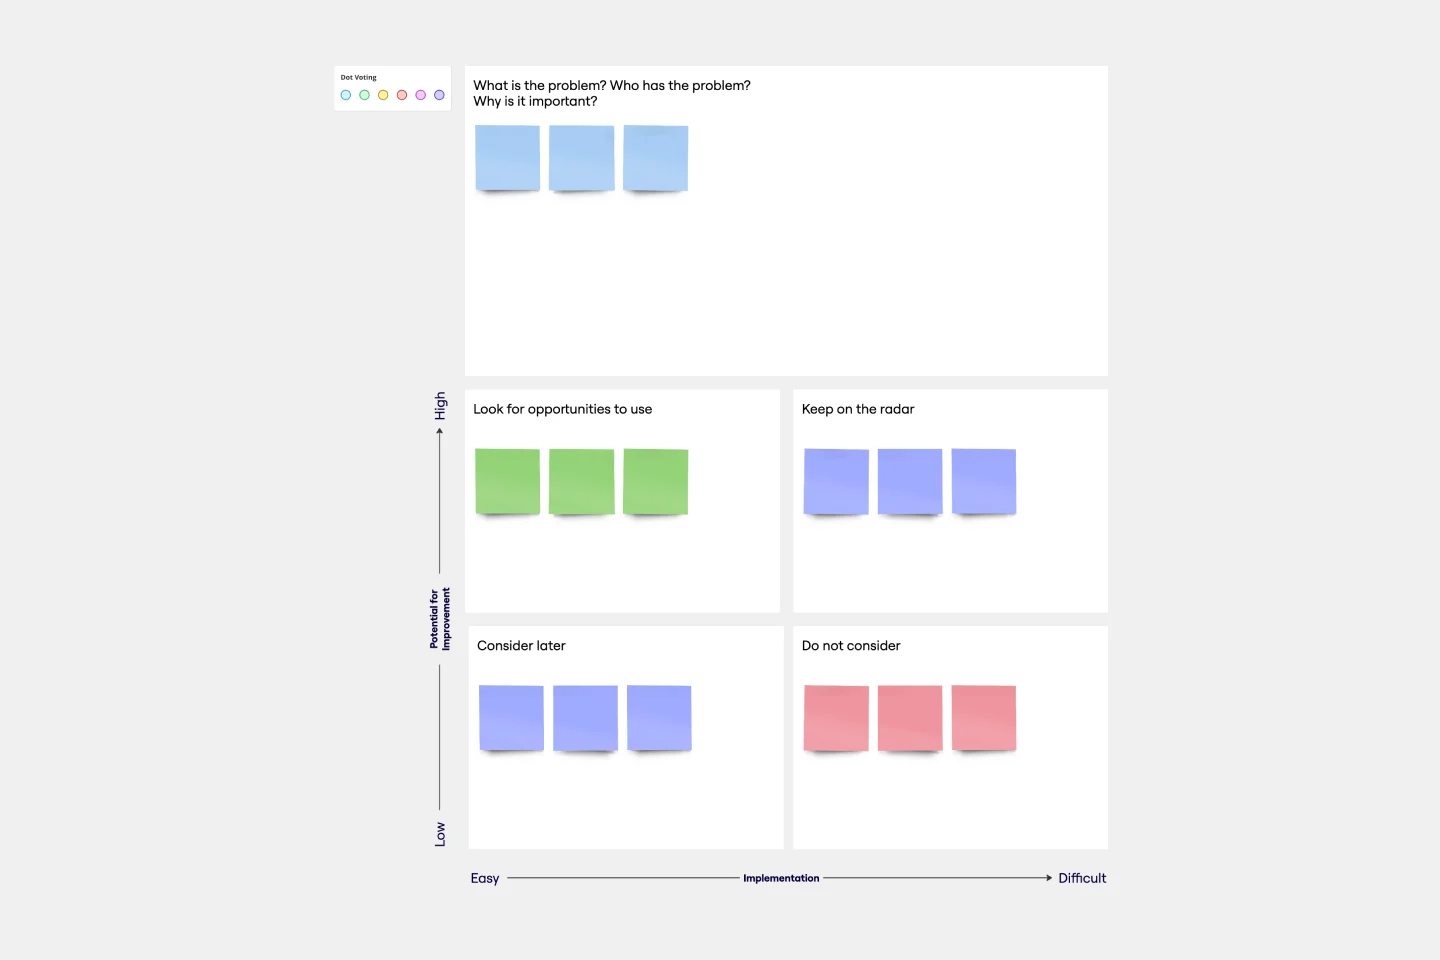
Parking Lot Matrix Template
Works best for:
Project Management, Ideation, Meetings
When the creative energy is flowing, a workshop or meeting will yield a lot of new ideas — but not all are on-topic or currently feasible. Roll them right onto a parking lot matrix, a simple, effective tool for separating the best ideas from those that are promising but could use more research or discussion. This template will let you easily make your own parking lot matrix, which will come in especially handy during long meetings (and when you have teammates who tend to go off-topic).

BPM
Works best for:
Diagramming
The BPM (Business Process Management) template is a visual tool for modeling, analyzing, and optimizing business processes. It provides a structured framework for documenting process flows, identifying bottlenecks, and improving efficiency. This template enables organizations to streamline operations, enhance productivity, and drive business performance. By promoting process transparency and agility, the BPM template empowers teams to achieve operational excellence and deliver value to stakeholders.
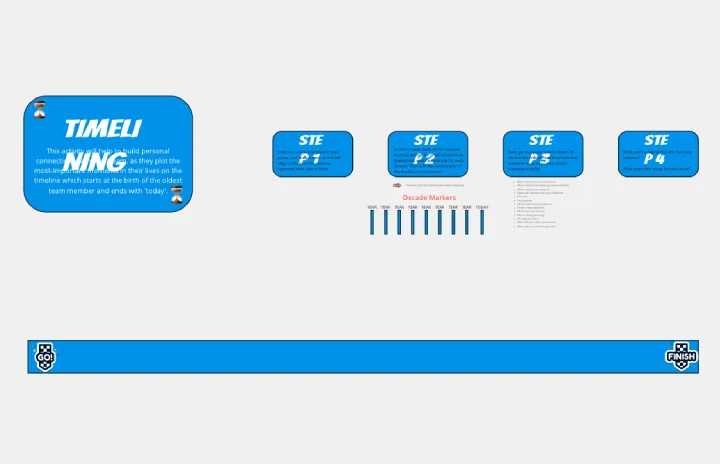
Timelining
Works best for:
Planning, Timeline
Timelining is a versatile template designed for creating detailed project timelines. It allows you to outline tasks, milestones, and deadlines, helping you manage projects efficiently. Whether for business or personal use, this template ensures you stay organized and on schedule.