Website Flowchart Template
Organize and clarify your website content with the Website Flowchart Template. Build user-centric experiences and have customers always coming back.
About the Website Flowchart Template
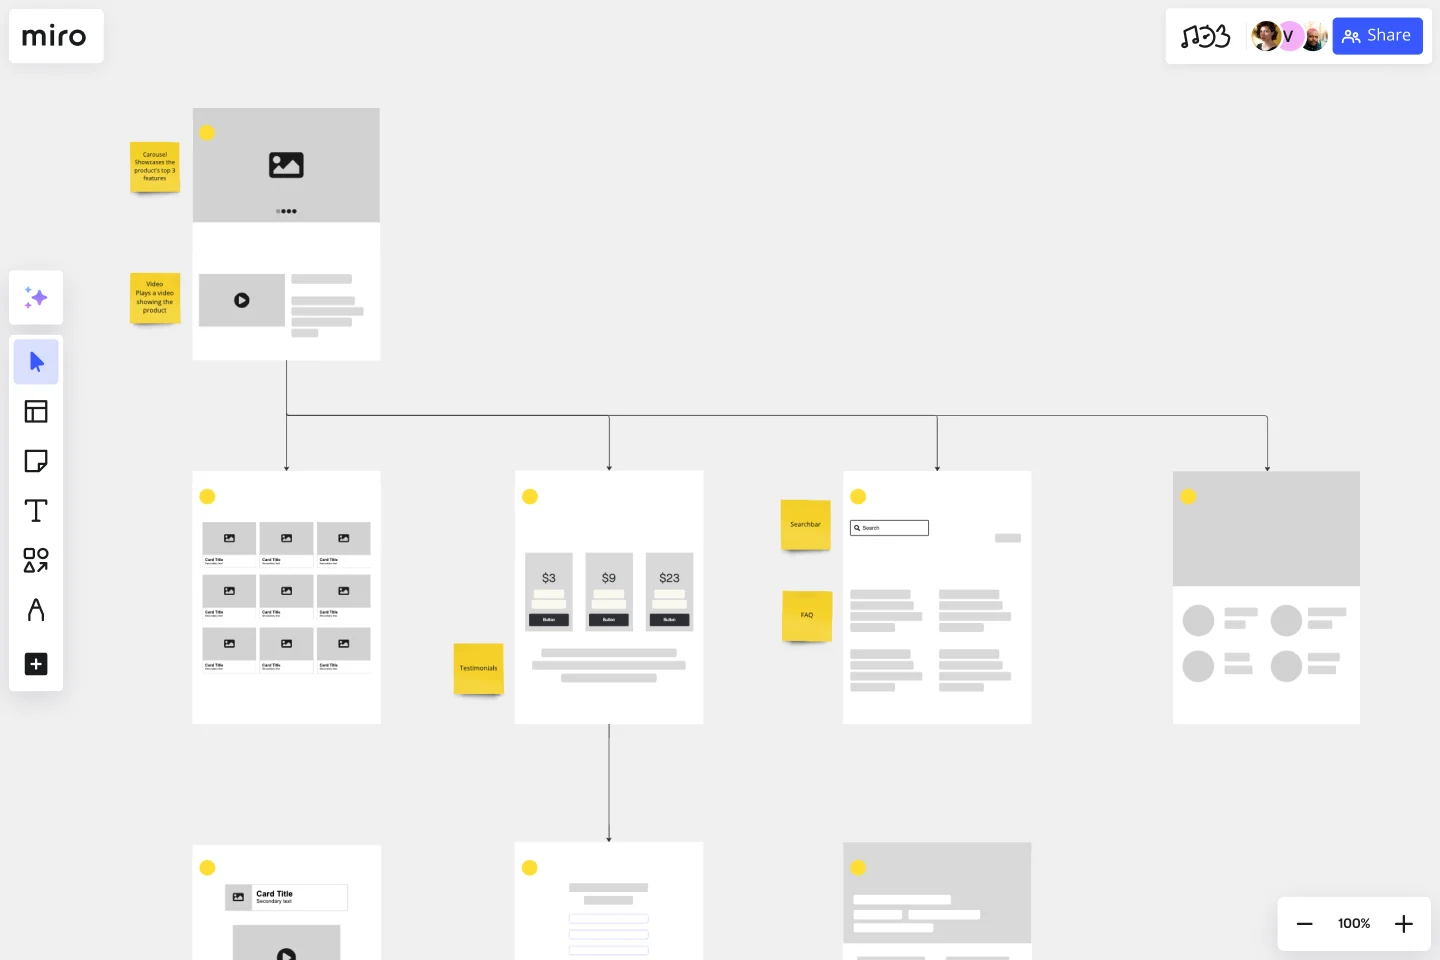
A website flowchart (also known as a sitemap) maps out the structure and complexity of your current or future website.
A well-structured sitemap or flowchart makes your website easily searchable. Each piece of content should ideally give users accurate search results, based on keywords connected to your web content.
Product, UX, and content teams use flowcharts or sitemaps to understand everything contained in a website, and plan to add or restructure content to improve a website’s user experience.
Keep reading to learn more about website flowcharts.
What is a website flowchart?
A website flowchart can be used as a planning tool to help organize and clarify existing content, and get rid of unnecessary or duplicate content. The flowchart also helps your team identify knowledge gaps for future content.
Website flowcharts help you stay focused on your user and your goals when working on website projects, from website launches, audits, or redesigns.
Ideally, your users shouldn’t be confused when navigating your website (whether it’s their first time or a returning visit), or interacting with any of your content. Website flowcharts help you spot areas of friction or dead-end points across user flows.
Create your own website flowchart
Making your own website flowchart is easy and Miro is the perfect flowchart creator. Get started by selecting the Website Flowchart Template, then take the following steps to make one of your own.
1. Clarify your website’s purpose and goals
Websites should be focused and easy to navigate. Ask your team to articulate your website’s high-level goals and purpose on sticky notes. These can be broken down into specific, color-coded goals for each webpage. Your sitemap should help you determine whether every page on your website truly reinforces your goals.
2. Add website wireframes and set your website flow
You can build your website flowchart based on a website wireframe or build a quick mock-up with the shapes and images from our library. Make sure what you build is showing your user experience accurately and indicates flow direction with arrows.
3. Identify duplicate content and flag it for review
Use the number labels on each webpage to map out the user flow or rank the relevance of each website from highest to lowest possible. Flag duplicate content with relevant symbols like emojis to mark potential conflicting information or pages that don’t convert.
4. Streamline your conversion funnel
After you’ve finished adding the necessary new pages to your sitemap, map out and combine any duplicate steps a user must take to complete a sign-up or purchase. The fewer steps, the sooner your potential user can convert. In this step, it’s also helpful to build a customer touchpoint map.
5. Share your sitemap cross-functionally
Lots of people are involved in website launches, audits, or redesigns: from web designers, project managers, and developers, to copywriters, and sales and marketing (at least!). To align everyone on the goals and progress of your website project, keep the flowchart visible and easily accessible to all.
Why use a website flowchart?
A sitemap can help your product, UX, or content teams:
Clarify content themes or focuses so the user understands your products and services
Reduce broken links across your website
Streamline the conversion funnel so the user takes fewer steps before converting
Maintain higher search engine rankings by planning regular content refreshes to maintain a competitive edge
Kickstart a new business or initiative, especially since sitemaps help content get discovered faster
Invite cross-functional input and collaborate, as the needs of the users and website or content architecture evolve
Use your website flowchart as a web design project tracker, too. Keep an eye on finalized website elements, what areas need development, and how much your team progresses.
How do you create a flowchart for a website?
There are many ways to create a website flowchart, but some of the best practices include conducting user research to understand your customer’s pain points, and collaborating with other teams such as design, product, and development to assess what’s feasible or not. Finally, test your prototypes, to be sure your website flowchart is good, user-friendly, and will reach your company’s goals.
Get started with this template right now.
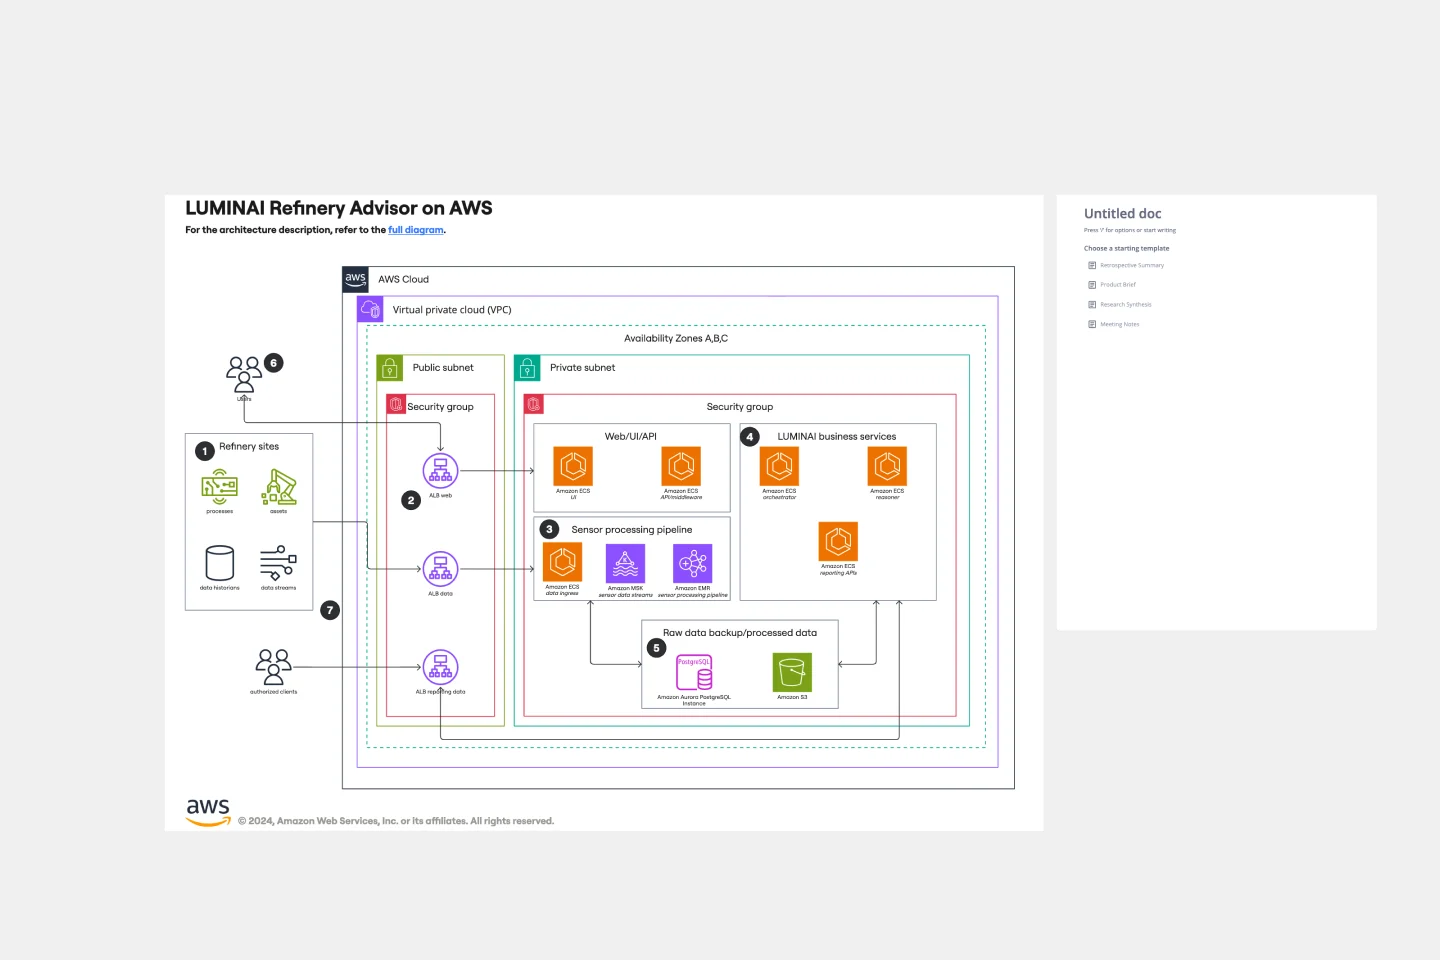
LUMINAI Refinery Advisor on AWS Template
Works best for:
AWS
The LUMINAI Refinery Advisor on AWS template streamlines and optimizes refinery operations through AWS. It provides a structured approach to setting up and managing AWS services, tailored specifically for engineers, developers, and data scientists in the refinery sector. This template not only saves time and effort by offering a predefined structure and best practices but also allows for customization to meet specific operational needs. With its focus on enhancing data processing capabilities, the LUMINAI Refinery Advisor on AWS template is an invaluable resource for improving the efficiency, effectiveness, and optimization of refinery processes on the AWS platform.
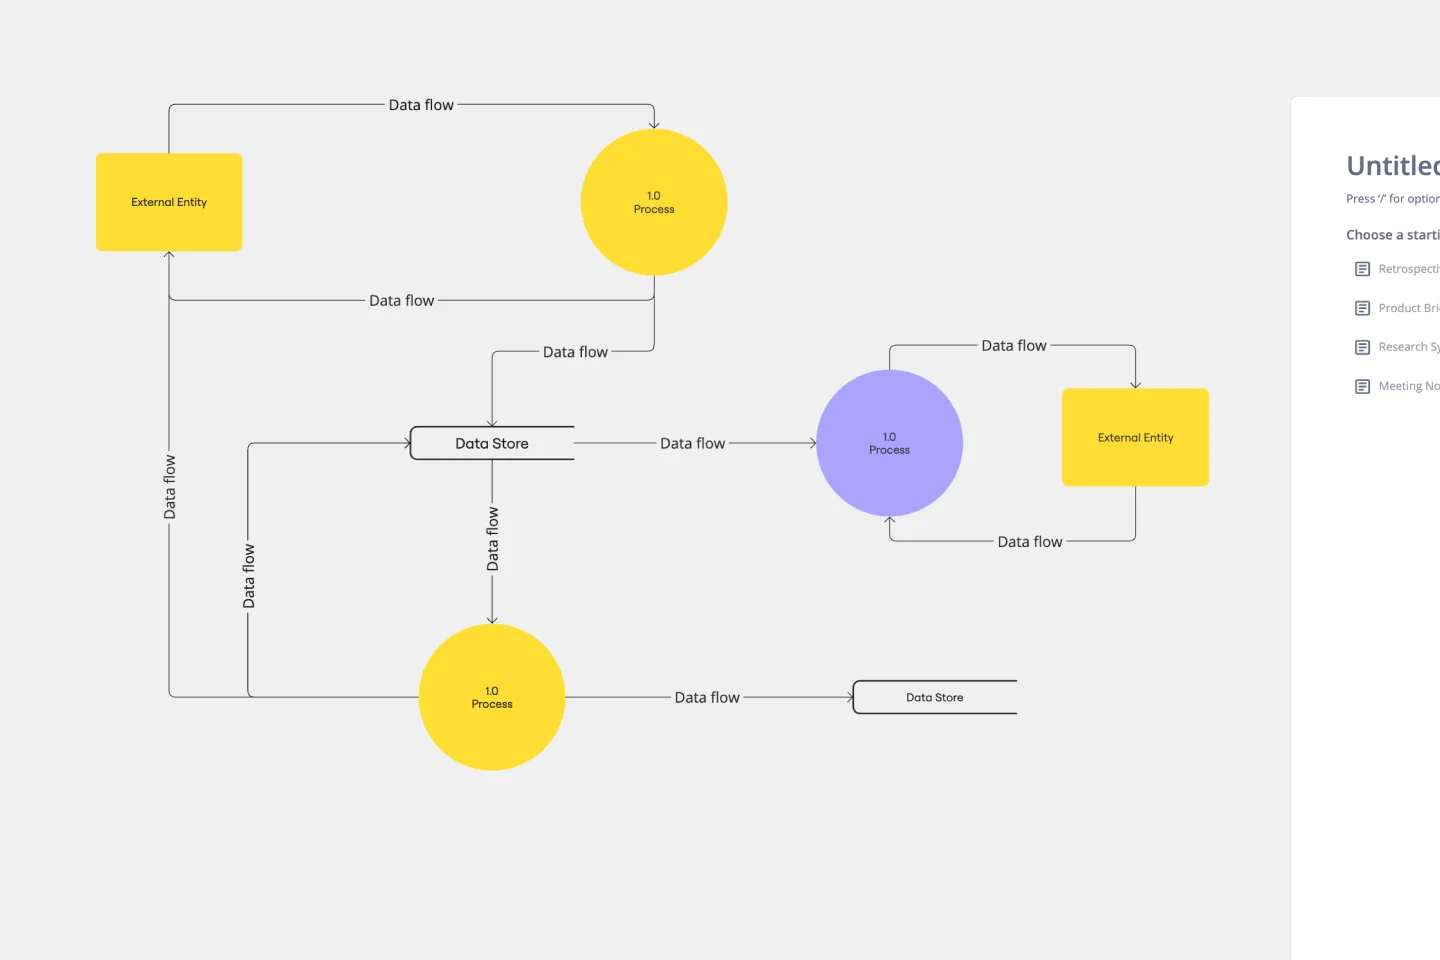
Data Flow Diagram Template
Works best for:
Flowcharts, Software Development, Diagrams
Any process can get pretty complex, especially when it has multiple components. Get a better grasp of your process through a data flow diagram (DFD). DFDs create a simple visual representation of all components in the flow of data and requirements in an entire system. They’re most often used by growth teams, data analysts, and product teams, and they’re created with one of three levels of complexity—0, 1, or 2. This template will help you easily build the best DFD for your process.
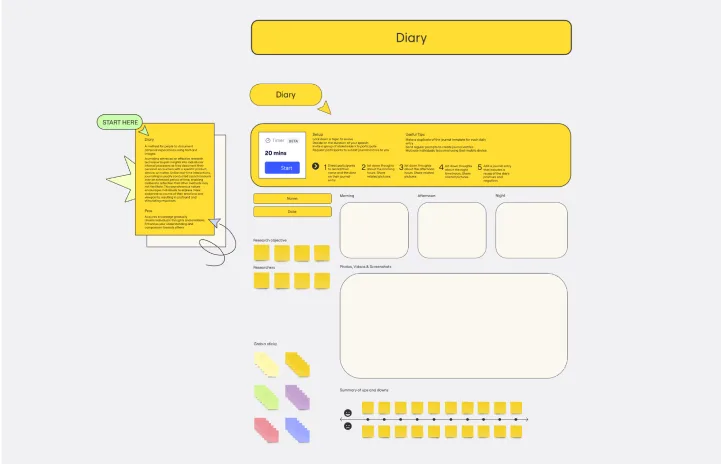
Diary Template
Works best for:
Design
The Diary Template is an effective research tool to gain insights into individuals' internal processes as they document their encounters with a specific product, service, or matter. Unlike real-time interactions, journaling is usually conducted asynchronously over an extended period of time, enabling deliberate reflection that other methods may not facilitate. This asynchronous nature encourages individuals to express more elaborate accounts of their emotions and viewpoints, resulting in profound and stimulating responses.
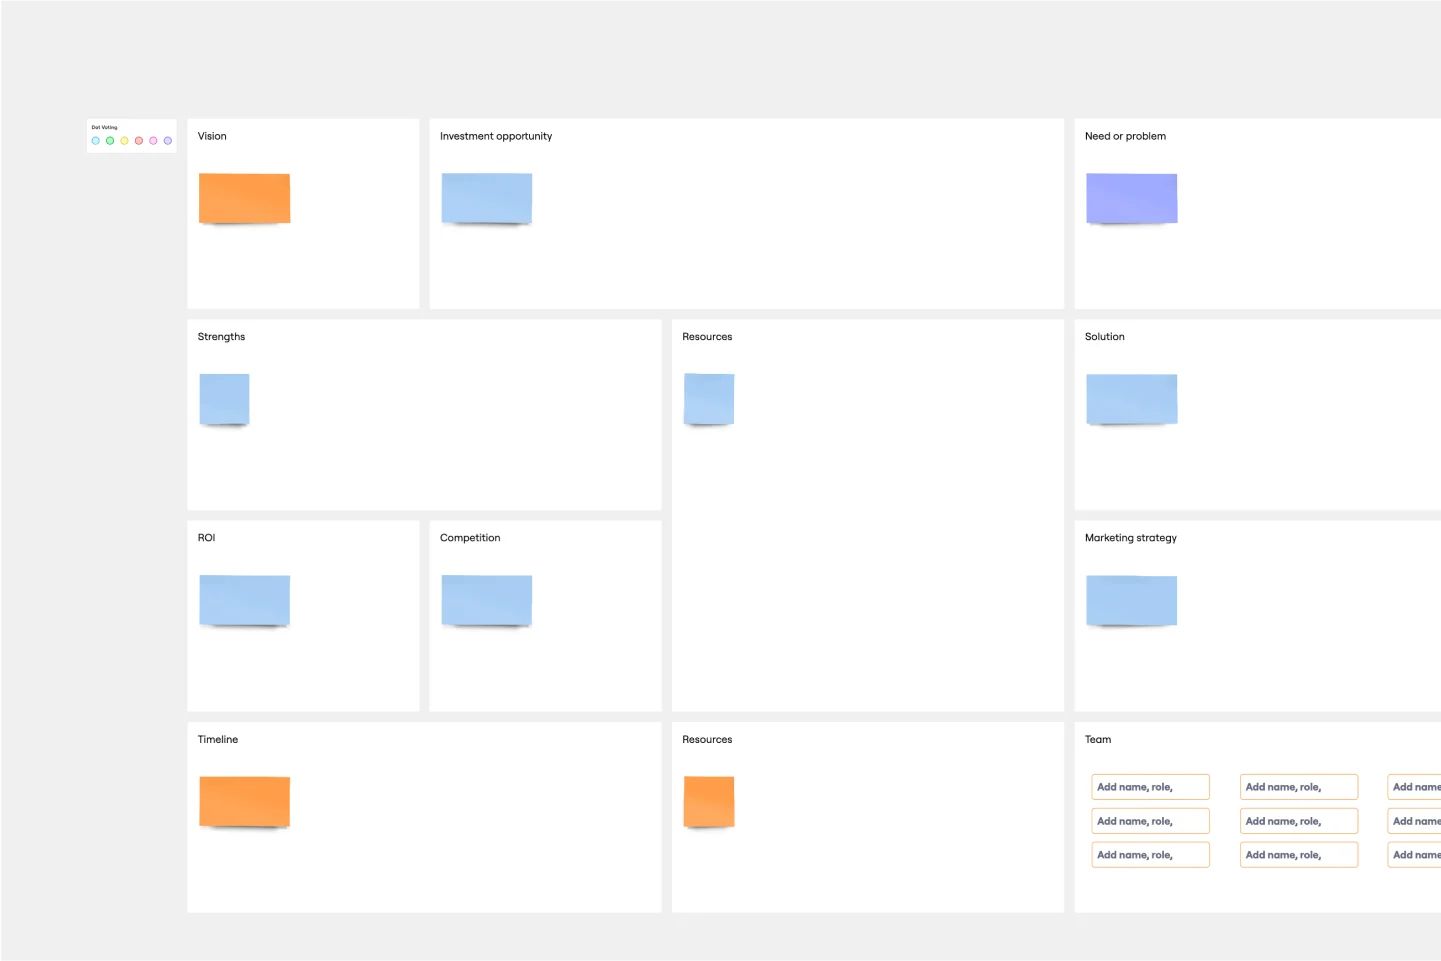
Executive Summary Template
Works best for:
Leadership, Project Management, Documentation
Pique their curiosity. Get them excited. Inspire them to keep reading, diving further into your proposal details. That’s what a good executive summary has the power to do—and why it’s a crucial opening statement for business plans, project plans, investment proposals, and more. Use this template to create an executive summary that starts building belief, by answering high-level questions that include: What is your project? What are the goals? How will you bring your skills and resources to the project? And who can expect to benefit?
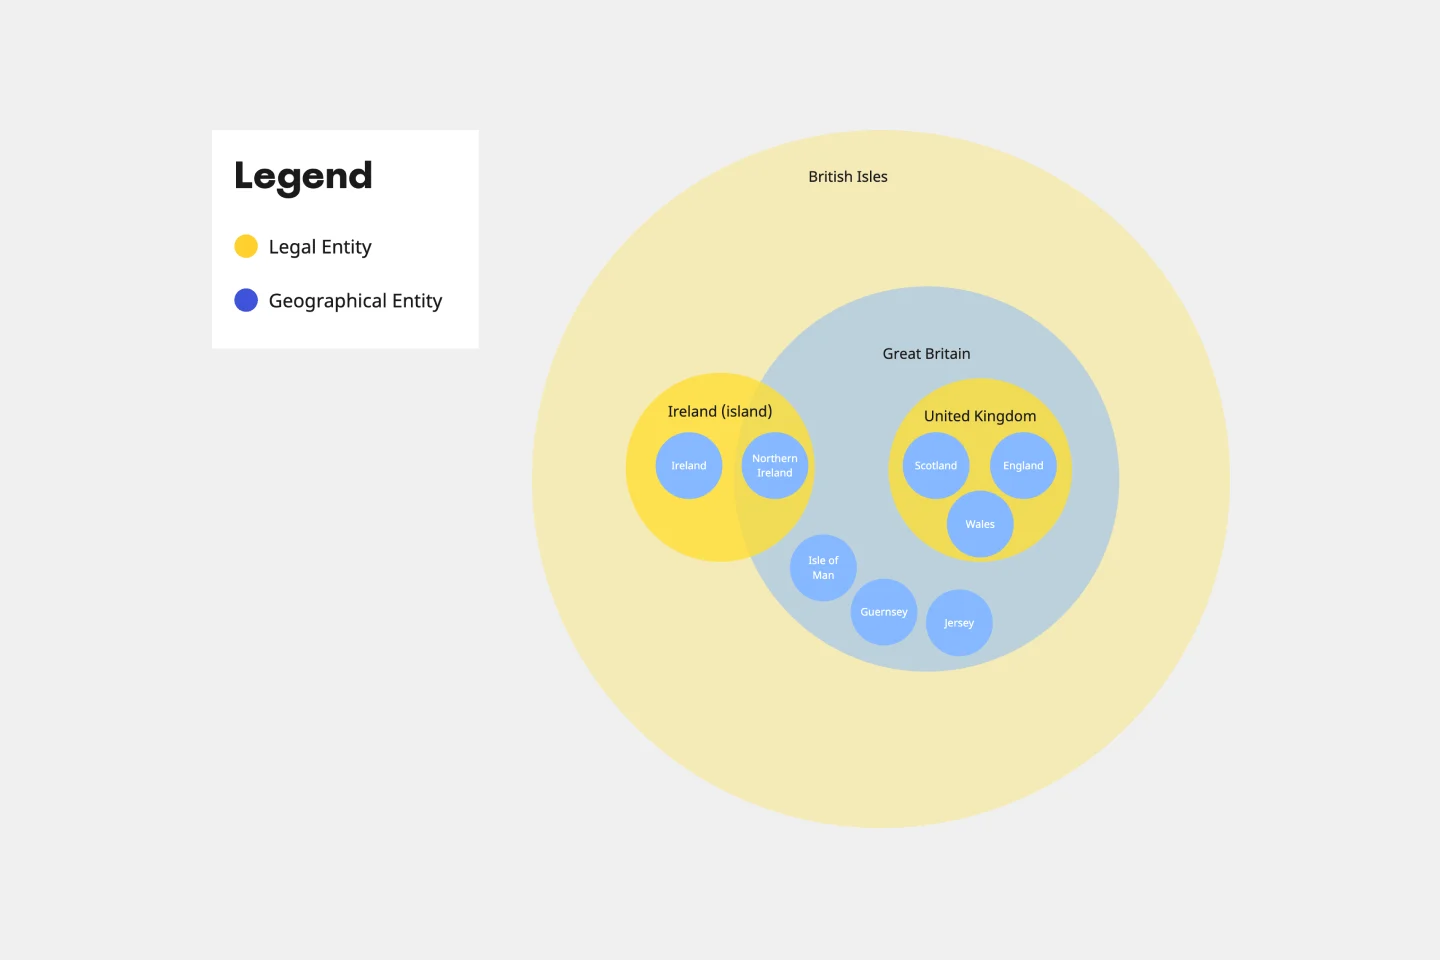
Euler Diagram Template
Works best for:
Business Management, Operations, Diagrams
Euler diagrams are valuable for showing different relationships between subjects by representing them with circles or "cells." Euler diagrams are frequently used in IT systems to show how objects relate to one another and how they interact. However, you can use them for any sort of explanation that needs to show connections.
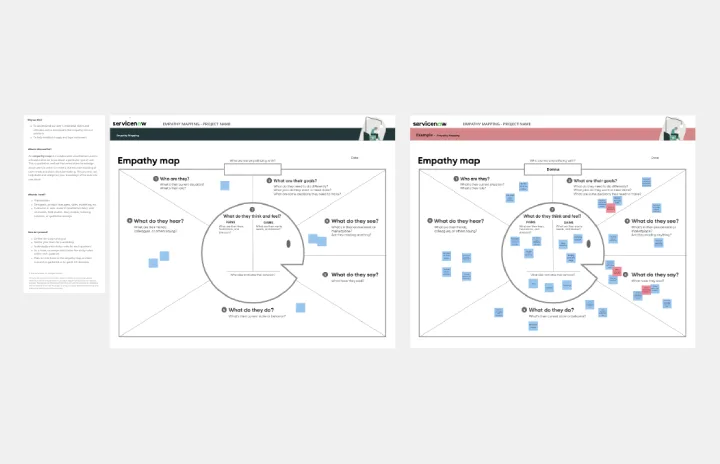
Empathy Mapping by ServiceNow
Works best for:
Research & Design, Market Research
The Empathy Mapping template helps teams capture detailed user insights. By understanding user perspectives, you can improve product features and customer satisfaction. This template is perfect for user research and product development.