Web Diagram Template
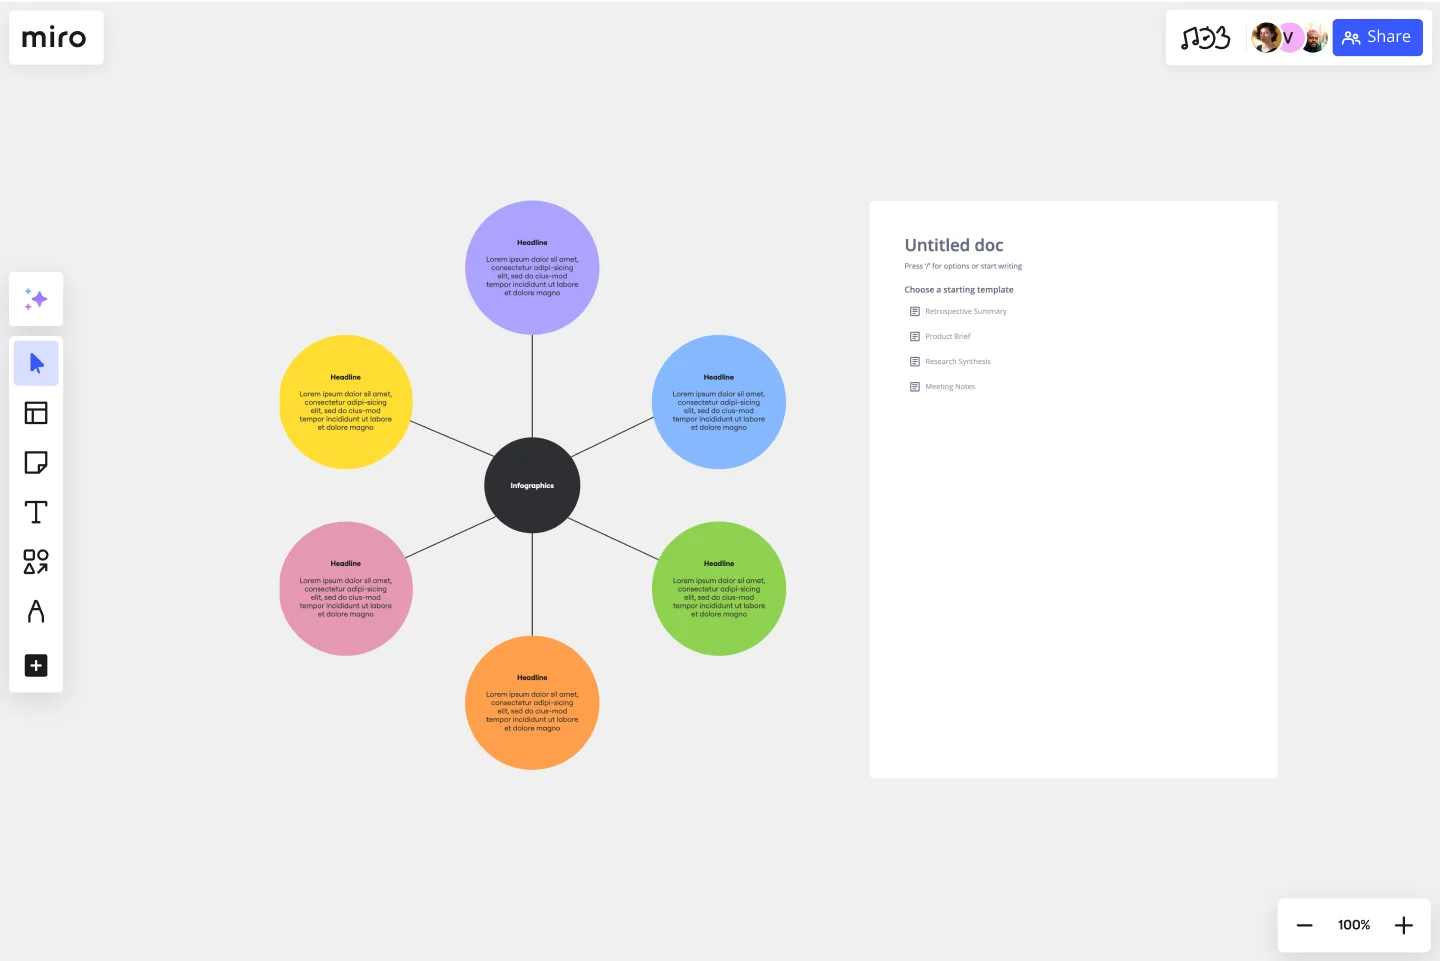
Effortlessly interconnect elements and bring clarity to your ideas across diverse projects with the web diagram template.
About the Web Diagram Template
The web diagram template is a useful visual tool that works like a spider diagram. It helps in connecting various elements to create a comprehensive visual story. Whether you are working on web projects, brainstorming sessions, or strategic planning, this template can help you explore and weave a network of ideas that is clear and coherent. It helps in presenting your concepts in a more organized and easy-to-understand manner.
Understanding the web diagram template
The web diagram template is an adaptable canvas that enables you to delineate relationships and connections among diverse elements, encouraging a comprehensive overview of your ideas. The template's flexibility makes it a valuable asset for various projects, allowing you to navigate complexities and showcase the intricate web of relationships inherent in any concept or strategy.
How to use the web diagram template in Miro
Easy editing: Customize your diagram easily by adding, removing, or repositioning elements. Miro's intuitive interface ensures seamless editing with just a few clicks.
Flexible diagram: As your project progresses, dynamically expand your diagram. The template accommodates the growth of your ideas, ensuring your interconnected web remains a vivid and accurate representation.
Add context: Enhance your diagram with contextual artifacts such as notes, comments, or attachments. This adds depth and clarity, ensuring your visual narrative is informative and interconnected.
Why should you use a web diagram template?
Clear relationships: Demonstrate the connections between different elements to help you better understand your concepts.
Flexible: It can be applied to various scenarios where interconnectedness is essential.
Efficient creation: Use Miro's automated diagramming tools to save time and effort while creating your interconnected web.
Collaborative space: Foster a collaborative environment where team members can contribute and provide insights into the interconnected nature of your ideas.
Adaptability: Navigate through the complexity of any project, adapting your interconnected web as it evolves to ensure relevance and accuracy.
Can I collaborate in real-time on the web diagram with team members?
Yes, Miro's real-time collaboration features allow multiple users to work seamlessly on the same diagram, fostering teamwork and shared insights.
How does the web diagram template maintain clarity as the diagram expands?
Miro's automated diagramming features intelligently adjust as you expand your interconnected web, ensuring that clarity is maintained throughout the evolution of your visual narrative.
Get started with this template right now.
ERD Customer Relationship Management (CRM) Template
Works best for:
ERD, CRM
The ERD Customer Relationship Management (CRM) template streamlines and enhances the management of customer relationships within businesses. It focuses on organizing customer information and interactions in a visually intuitive manner. Key entities such as Customer, Interaction, Sales Opportunity, Product, and Support Ticket are central to the template, facilitating the tracking of customer relationships, sales funnel activities, product purchases, and customer service interactions. This structured approach is critical for boosting customer satisfaction and optimizing sales strategies, making the ERD CRM template an invaluable asset for businesses aiming to improve their CRM processes.
Flow Diagrams
Works best for:
Diagramming
The Flow Diagrams template offers a versatile tool for visualizing processes, workflows, and systems. It provides a range of shapes and connectors for creating flowcharts, process maps, and data flow diagrams. This template enables teams to represent complex systems and processes in a clear and structured manner, facilitating communication and decision-making. By promoting visual clarity and understanding, Flow Diagrams empower teams to analyze and optimize processes effectively, driving efficiency and productivity.
Cycle Diagram Template
Works best for:
Diagramming
The cycle diagram template empowers professionals to visually represent complex cycles with precision and clarity. This template maps out cyclical processes, relationships, or events, ensuring that complex concepts are communicated seamlessly. One key benefit that sets this template apart is its ability to streamline communication and enhance understanding. By crafting visually appealing cycle diagrams, professionals can distill complex information into a clear visual language, making it easier for teams and stakeholders to grasp complex relationships. This ultimately fosters more effective collaboration and decision-making.
BPM
Works best for:
Diagramming
The BPM (Business Process Management) template is a visual tool for modeling, analyzing, and optimizing business processes. It provides a structured framework for documenting process flows, identifying bottlenecks, and improving efficiency. This template enables organizations to streamline operations, enhance productivity, and drive business performance. By promoting process transparency and agility, the BPM template empowers teams to achieve operational excellence and deliver value to stakeholders.
Insightful Venn
Works best for:
Venn Diagram
Discover insights and visualize data relationships with the Insightful Venn template. This tool helps you compare multiple datasets, identify intersections, and understand unique and common elements. Use it for data analysis, research, and presentations to communicate complex information effectively. Perfect for analysts, educators, and researchers aiming to convey data-driven insights visually.
Chat-Bot
Works best for:
Diagramming
The Chat Bot template is a visual tool for designing and mapping out chatbot interactions and functionalities. It provides a structured framework for visualizing conversation flows, user inputs, and bot responses. This template enables teams to collaborate on designing chatbot experiences that are intuitive and user-friendly, driving engagement and satisfaction. By promoting clarity and alignment, the Chat-Bot template empowers organizations to create effective chatbot solutions that meet user needs and business objectives.
