Venn Diagram Practical Applications
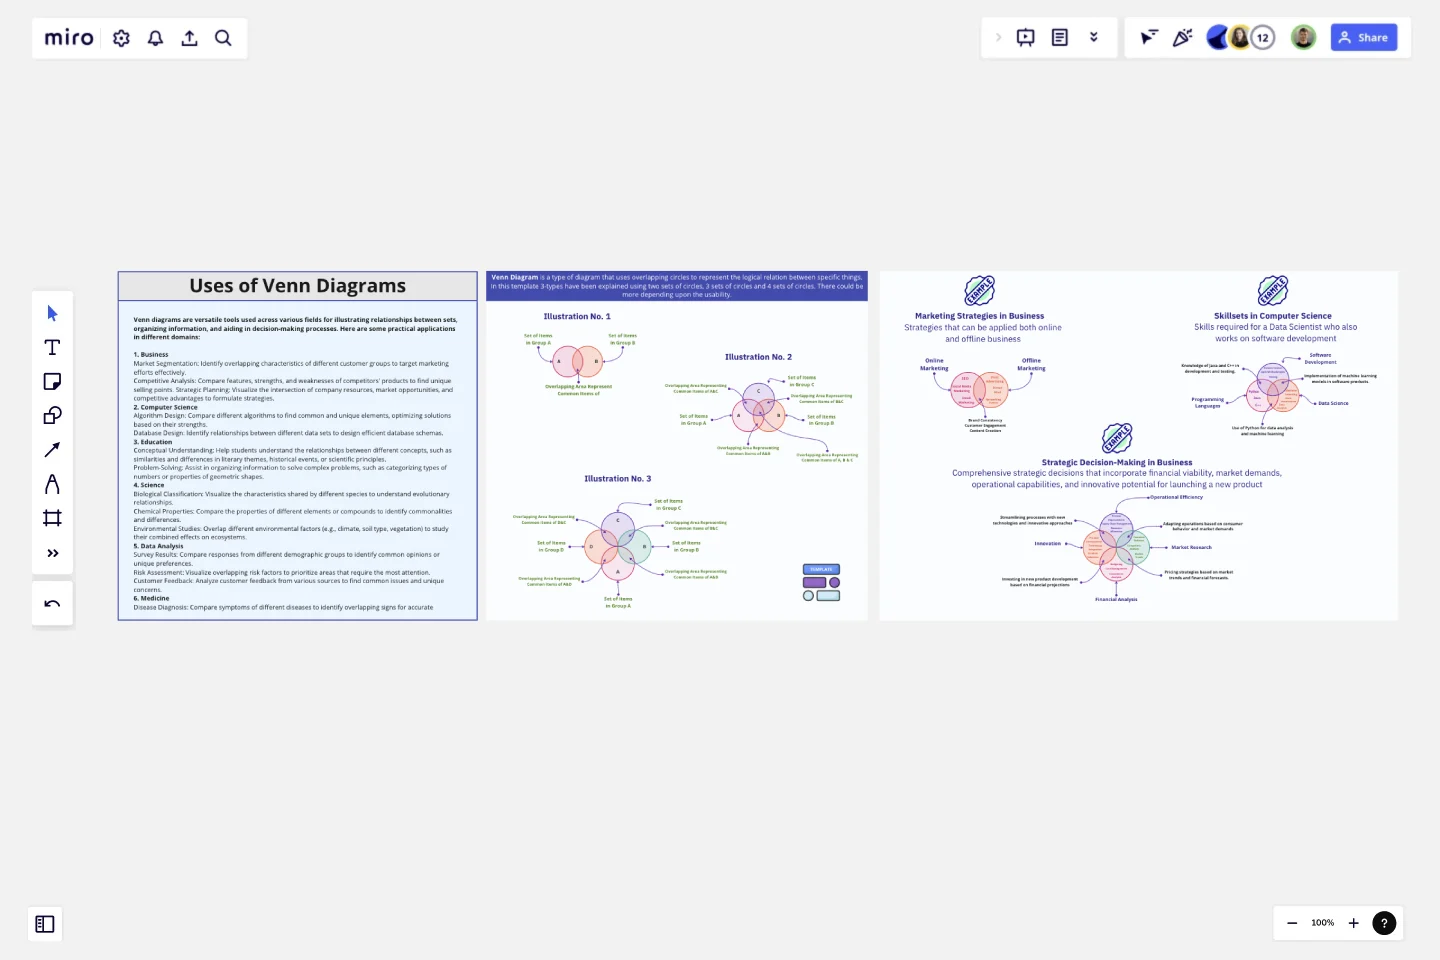
The "Venn Diagram Practical Applications" template is designed to help users visualize and analyze the relationships between different sets of data using Venn diagrams.
This template is ideal for professionals, educators, and students across various fields such as business, computer science, and strategic planning. It provides a clear and effective way to compare and contrast different elements, identify commonalities, and uncover unique attributes.
Key Features:
Versatile Use Cases: Demonstrates practical applications of Venn diagrams in real-life scenarios across multiple domains.
Different Diagram Configurations: Includes examples with two-circle, three-circle, and four-circle Venn diagrams to cater to varying levels of complexity.
Interactive Elements: Allows users to add, edit, and customize the diagram content based on their specific needs and data sets.
Visual Clarity: Uses distinct colors and overlapping areas to clearly depict intersections and differences between sets.
How to Use:
Two-Circle Venn Diagram:
Description: Ideal for comparing two different sets or groups.
Example: Comparing the features of two competing products in the market.
Set A: Product X features (e.g., Price, User Interface)
Set B: Product Y features (e.g., Battery Life, Customer Support)
Intersection: Common features (e.g., Availability, Warranty)
Three-Circle Venn Diagram:
Description: Useful for comparing three different sets or groups to find commonalities and unique characteristics.
Example: Overlapping skill sets in a project team.
Set A: Skills of Team Member A (e.g., Coding, Design)
Set B: Skills of Team Member B (e.g., Marketing, Design)
Set C: Skills of Team Member C (e.g., Coding, Project Management)
Intersections: Areas where two or three members share skills.
Four-Circle Venn Diagram:
Description: Best for complex comparisons involving four different sets or groups.
Example: Market segmentation analysis for a new product launch.
Set A: Segment 1 (e.g., Age Group 18-25)
Set B: Segment 2 (e.g., Income Level High)
Set C: Segment 3 (e.g., Geographical Region A)
Set D: Segment 4 (e.g., Interest in Technology)
Intersections: Identifying the core target audience that falls into multiple segments.
Practical Applications:
Business: Analyzing market segments, comparing product features, and identifying strategic opportunities.
Computer Science: Visualizing algorithm performance, comparing programming languages, and mapping software functionalities.
Strategies: Developing strategic plans, understanding competitive landscapes, and aligning organizational goals.
Benefits:
Enhanced Understanding: Simplifies the comparison and analysis of multiple sets of data.
Improved Decision Making: Helps identify commonalities and differences that can inform strategic decisions.
Versatile Tool: Applicable across various fields and scenarios, making it a valuable tool for diverse users.
This template was created by Khawaja Rizwan.
Get started with this template right now.
V2MOM Salesforce Template
Works best for:
Meetings, Strategic Planning
Align goals and strategies across your organization with the Salesforce V2MOM Template. Bring everyone together towards the same goals.
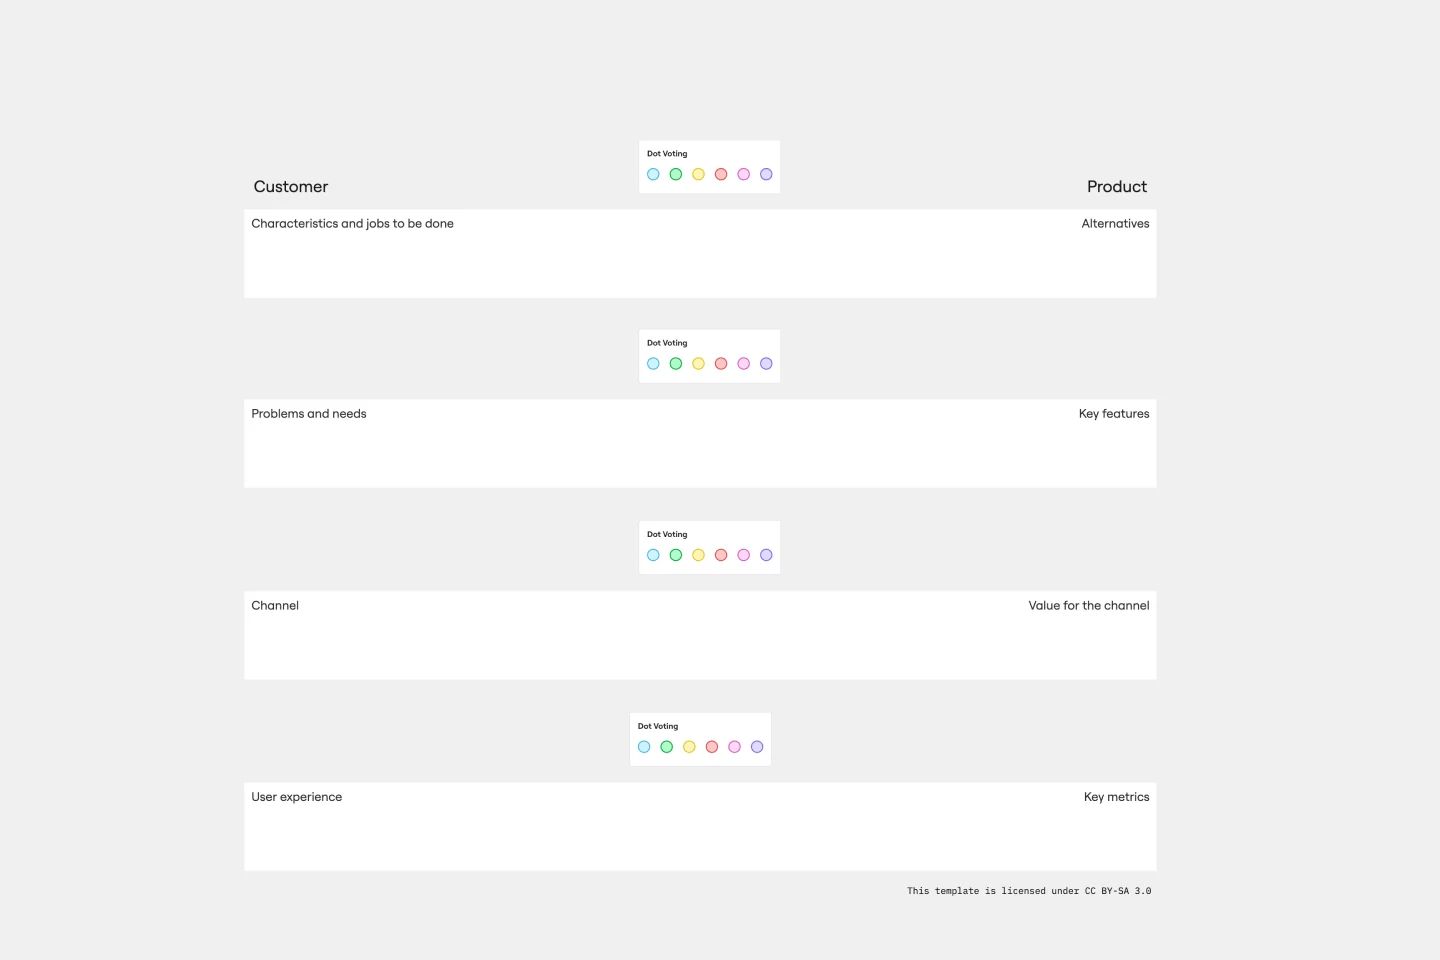
Product / Market Fit Canvas Template
Works best for:
Market Research, Strategic Planning, Product Management
The product/market fit canvas template is used to help product teams meet customer and market needs with their product design. This template looks at a product in two dimensions: first, how the product fits user needs, and second, how the fully designed product fits within the market landscape. This combined metric understands a product holistically from the way customers use and desire a product, to the market demand. By comparing customer and product qualities side by side, users should better understand their product space and key metrics.
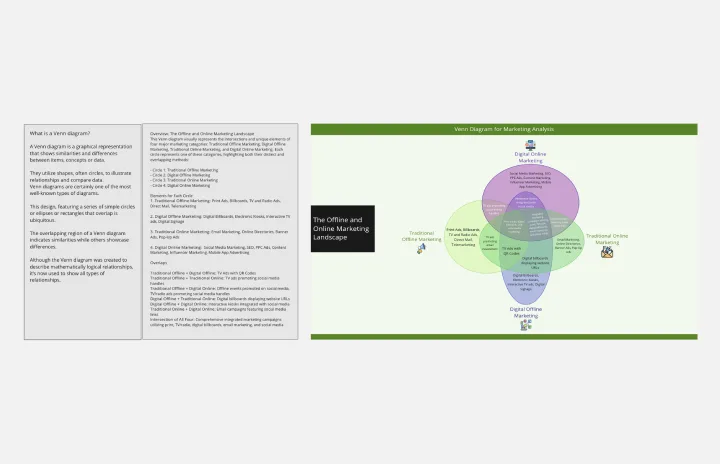
Venn Diagram for Marketing Analysis
Works best for:
Venn Diagram
Optimize your marketing strategies with the Venn Diagram for Marketing Analysis template. Use it to compare different market segments, identify overlapping interests, and analyze competitive landscapes. This tool helps you visualize data, uncover insights, and make informed marketing decisions. Perfect for marketing professionals, strategists, and business analysts looking to enhance their marketing analysis and planning efforts through visual tools.
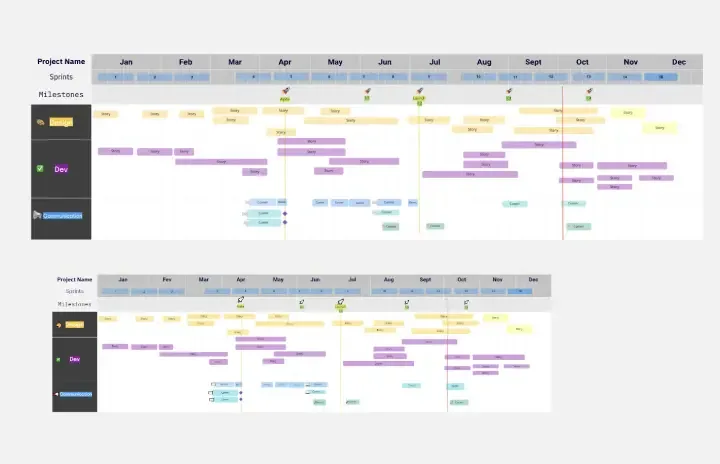
Project - Timeline & Key Infos
Works best for:
Agile, Project Management
The Project - Timeline & Key Infos template provides a visual framework for planning and tracking project timelines, milestones, and key information. It enables teams to align on project objectives, allocate resources, and monitor progress effectively. With customizable timelines and informative dashboards, this template empowers project managers and stakeholders to stay organized and informed throughout the project lifecycle, ensuring successful delivery within scope, time, and budget constraints.
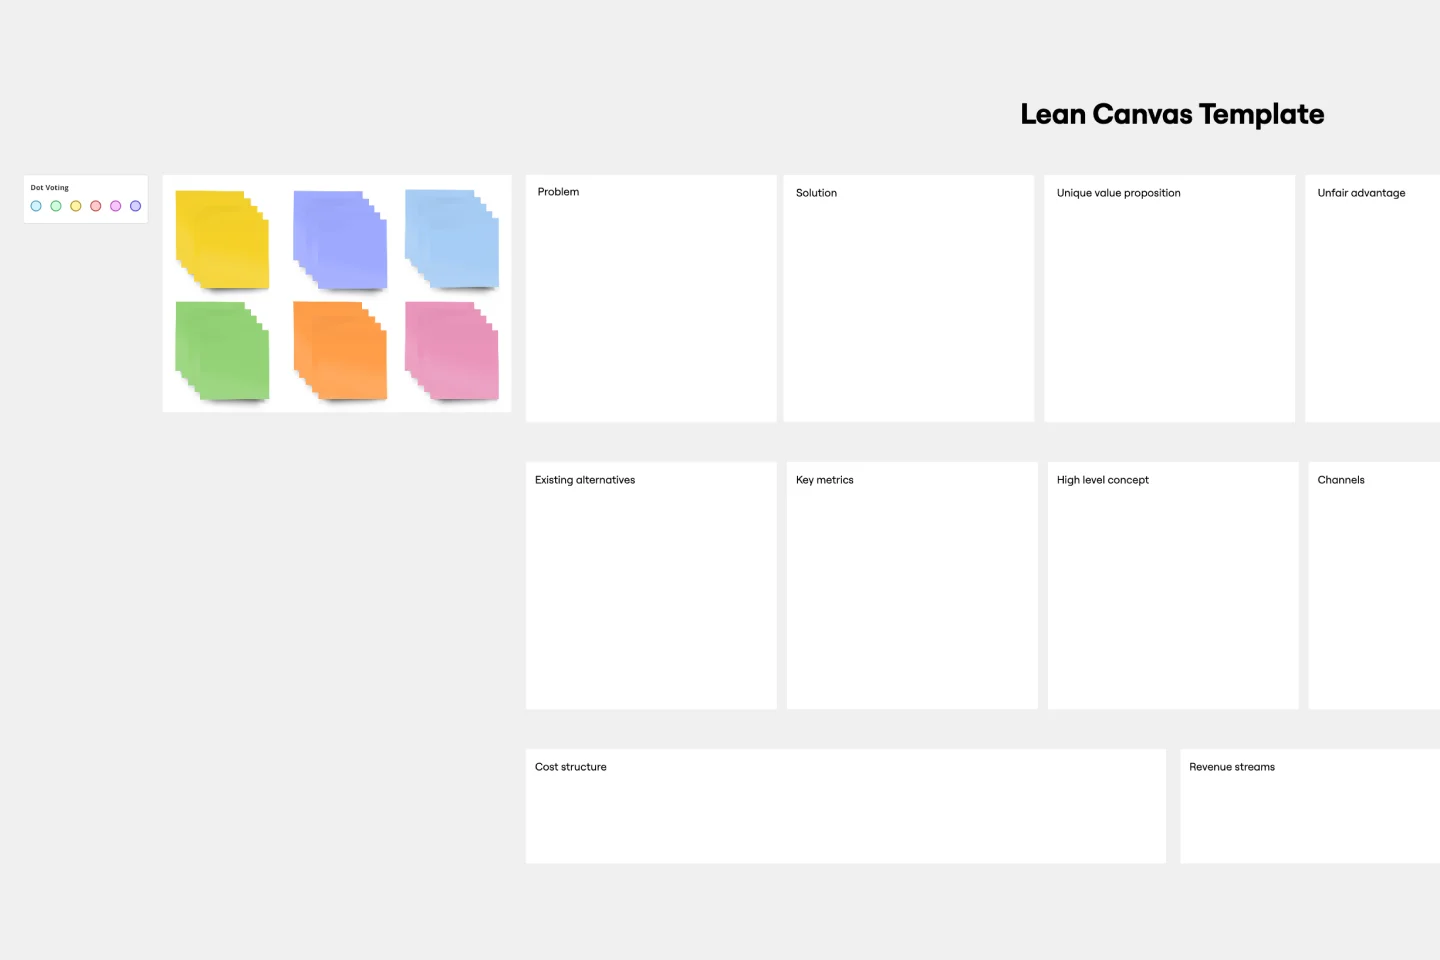
Lean Canvas Template
Works best for:
Agile Methodology, Strategic Planning, Agile Workflows
Business opportunities can get dense, cumbersome, and complex, and evaluating them can be a real challenge. Let a lean canvas streamline things and break down your business idea for you and your team. A great tool or entrepreneurs and emerging businesses, this one-page business model gives you an easy, high-level view of your idea — so you can stay focused on overall strategy, identify potential threats and opportunities, and brainstorm the various factors at play in determining your potential profitability in an industry.