Venn Diagram for Marketing Analysis
A Venn diagram is a graphical representation that shows similarities and differences between items, concepts or data.
They utilize shapes, often circles, to illustrate relationships and compare data. Venn diagrams are certainly one of the most well-known types of diagrams. This design, featuring a series of simple circles or ellipses or rectangles that overlap is ubiquitous. The overlapping region of a Venn diagram indicates similarities while others showcase differences. Although the Venn diagram was created to describe mathematically logical relationships, it’s now used to show all types of relationships.
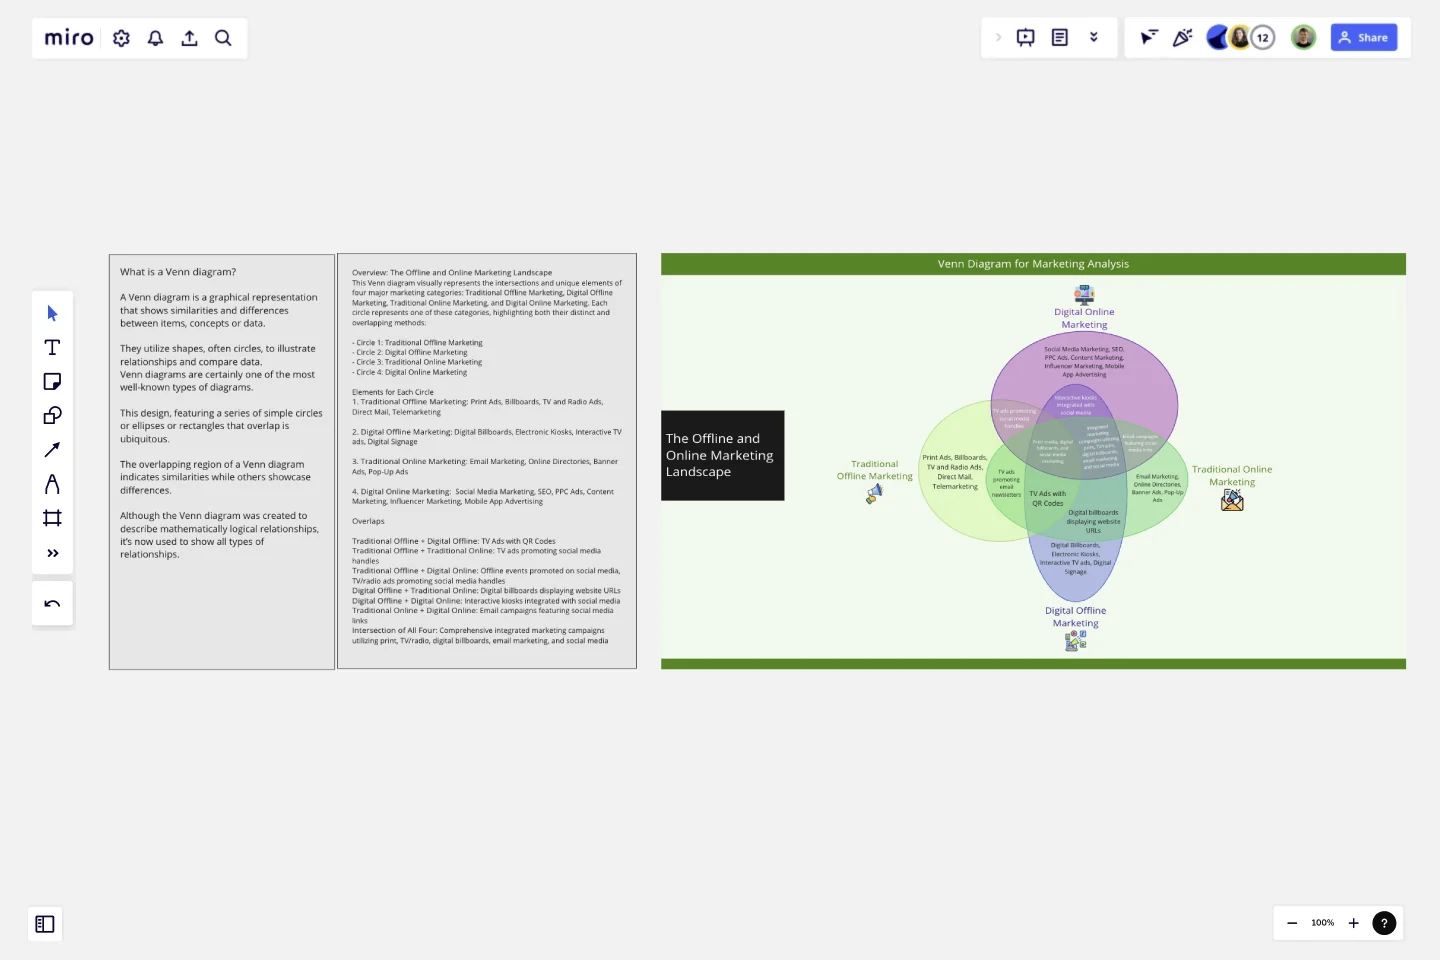
Overview: The Offline and Online Marketing Landscape
This Venn diagram visually represents the intersections and unique elements of four major marketing categories: Traditional Offline Marketing, Digital Offline Marketing, Traditional Online Marketing, and Digital Online Marketing. Each circle represents one of these categories, highlighting both their distinct and overlapping methods:
- Circle 1: Traditional Offline Marketing
- Circle 2: Digital Offline Marketing
- Circle 3: Traditional Online Marketing
- Circle 4: Digital Online MarketingElements for Each Circle
1. Traditional Offline Marketing: Print Ads, Billboards, TV and Radio Ads, Direct Mail, Telemarketing
2. Digital Offline Marketing: Digital Billboards, Electronic Kiosks, Interactive TV ads, Digital Signage
3. Traditional Online Marketing: Email Marketing, Online Directories, Banner Ads, Pop-Up Ads
4. Digital Online Marketing: Social Media Marketing, SEO, PPC Ads, Content Marketing, Influencer Marketing, Mobile App Advertising
Overlaps
Traditional Offline + Digital Offline: TV Ads with QR Codes
Traditional Offline + Traditional Online: TV ads promoting social media handles
Traditional Offline + Digital Online: Offline events promoted on social media, TV/radio ads promoting social media handles
Digital Offline + Traditional Online: Digital billboards displaying website URLs
Digital Offline + Digital Online: Interactive kiosks integrated with social media
Traditional Online + Digital Online: Email campaigns featuring social media links
Intersection of All Four: Comprehensive integrated marketing campaigns utilizing print, TV/radio, digital billboards, email marketing, and social media.
Above elaborated marketing analysis venn-diagram will help you understand its application to your problem statement.
This template was created by Khawaja Rizwan.
Get started with this template right now.
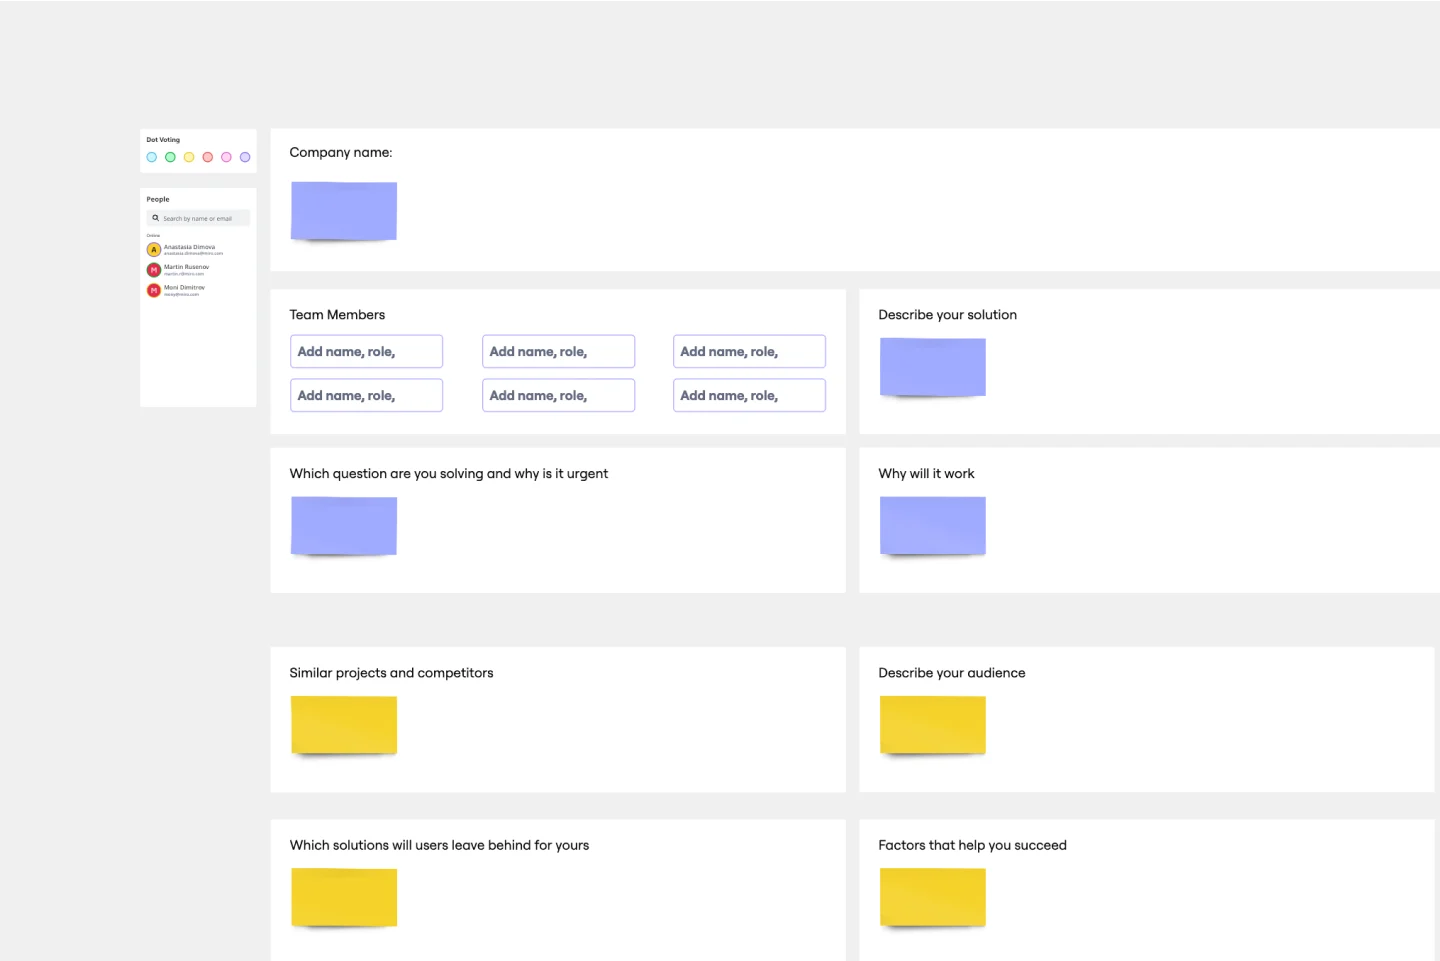
Startup Canvas Template
Works best for:
Leadership, Documentation, Strategic Planning
A Startup Canvas helps founders express and map out a new business idea in a less formal format than a traditional business plan. Startup Canvases are a useful visual map for founders who want to judge their new business idea’s strengths and weaknesses. This Canvas can be used as a framework to quickly articulate your business idea’s value proposition, problem, solution, market, team, marketing channels, customer segment, external risks, and Key Performance Indicators. By articulating factors like success, viability, vision, and value to the customer, founders can make a concise case for why a new product or service should exist and get funded.
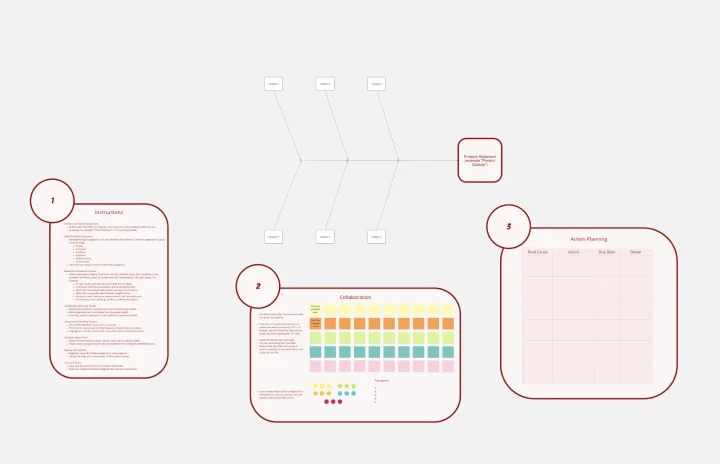
Fishbone Diagram for Quality Control
Works best for:
Fishbone diagram
Maintaining high standards of quality is vital in any industry. The Fishbone Diagram for Quality Control template helps you identify and analyze the root causes of quality issues. Use it to categorize potential causes into areas such as materials, methods, manpower, and machinery. This structured approach ensures a thorough examination of all possible factors affecting quality, leading to more effective solutions and continuous improvement.
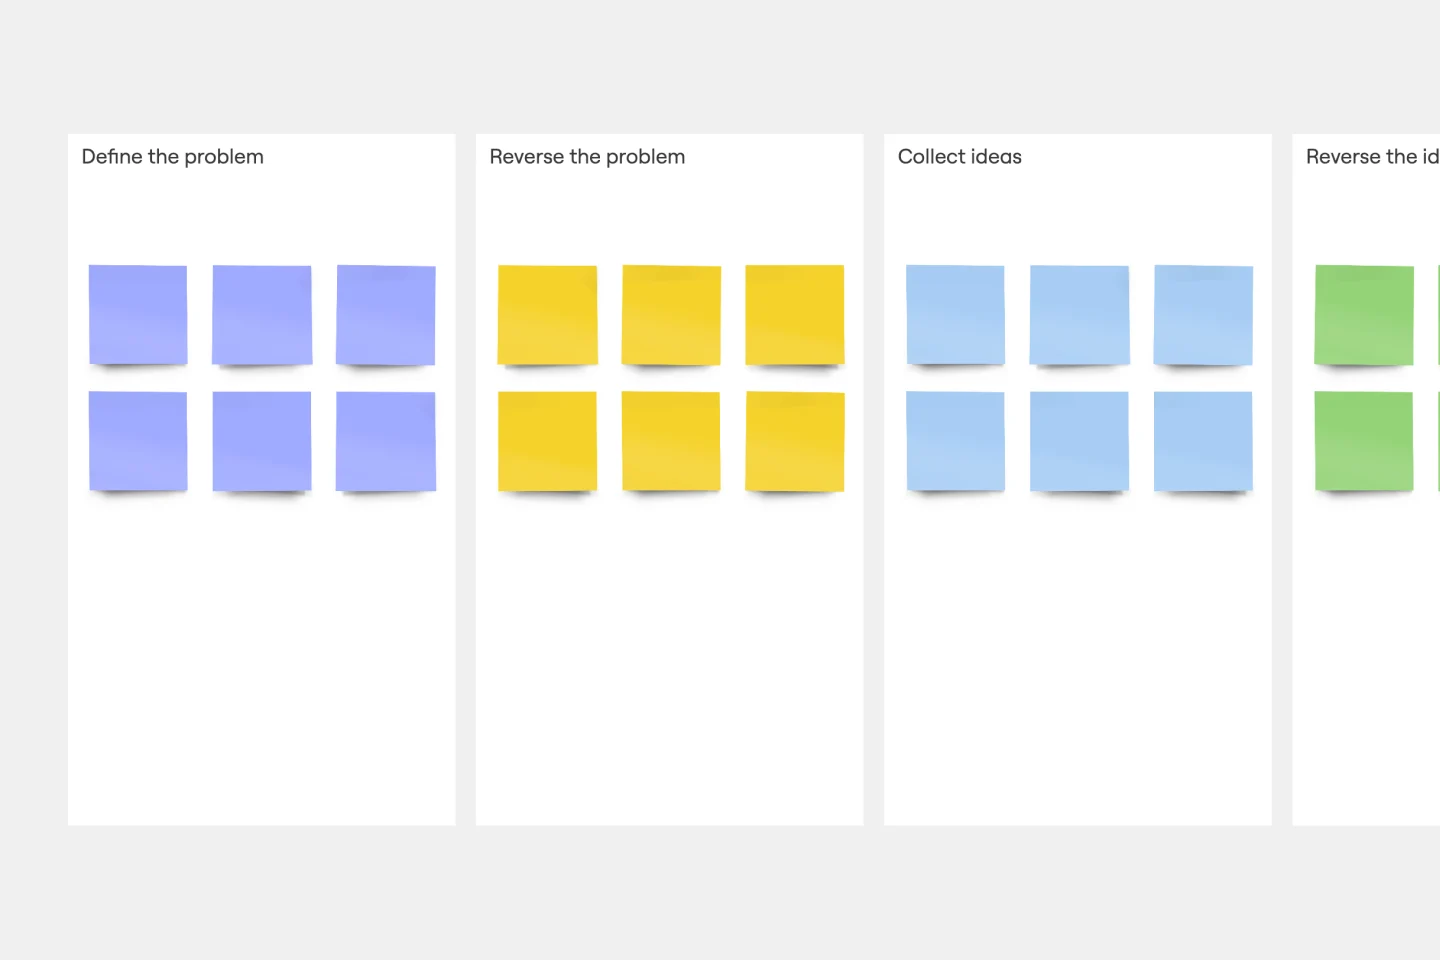
Reverse Brainstorming Template
Works best for:
Ideation, Brainstorming, Team Meetings
Reverse brainstorming is a technique that prompts a group to think of problems, rather than solutions. Because we naturally think of problems, it’s a great way to get a group to anticipate problems that may occur during a project. To engage in reverse brainstorming, start by identifying the problem, and then think of things that might exacerbate it. Ask your team to generate ideas around ways in which the problem could get worse. Reverse the problems into solutions again, and then evaluate your ideas.
Mandala Chart Template
Works best for:
Planning, Brainstorming, Goal setting
The Mandala Chart Template helps you visualize the relationships between a central theme and its sub-themes. One of the key benefits is how it fosters a holistic understanding of any topic. This perspective ensures every detail is noticed, making it an invaluable asset for those aiming for comprehensive insight and thorough planning or a better understanding of their goals.
Venn Diagram for Learning and Education
Works best for:
Venn Diagram
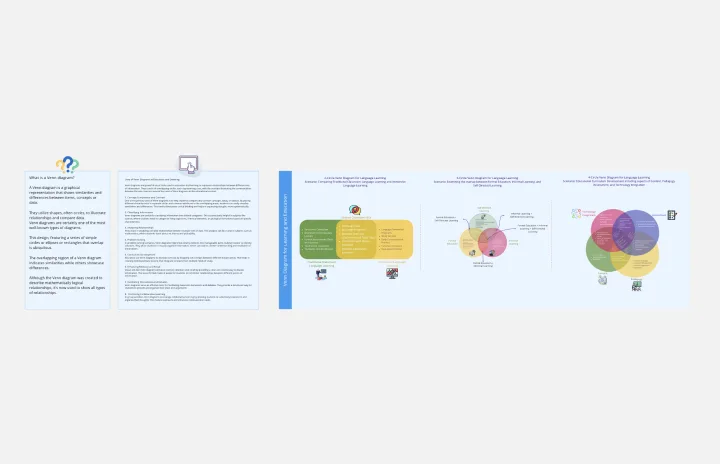
Enhance learning and teaching with the Venn Diagram for Learning and Education template. Use it to compare concepts, illustrate relationships, and facilitate discussions. This template helps students and educators organize information visually, making complex ideas easier to understand and retain. It's an excellent tool for classrooms, study groups, and professional training sessions, promoting deeper understanding and active learning.
Project - Timeline & Key Infos
Works best for:
Agile, Project Management
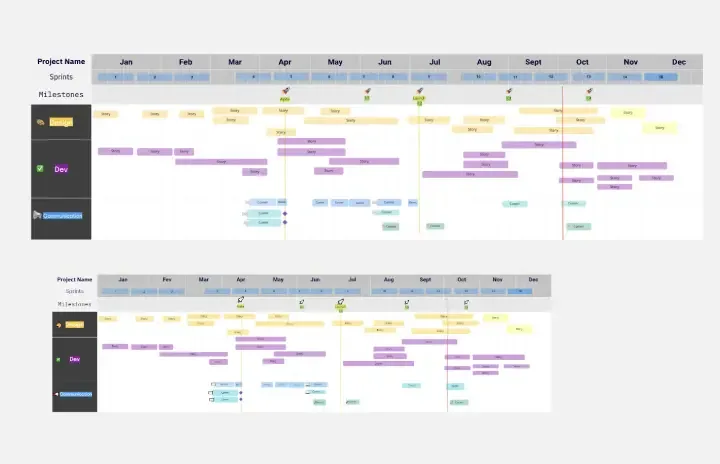
The Project - Timeline & Key Infos template provides a visual framework for planning and tracking project timelines, milestones, and key information. It enables teams to align on project objectives, allocate resources, and monitor progress effectively. With customizable timelines and informative dashboards, this template empowers project managers and stakeholders to stay organized and informed throughout the project lifecycle, ensuring successful delivery within scope, time, and budget constraints.