Venn Diagram for Research
The Venn Diagram for Research template is an essential tool designed to help researchers visually organize, compare, and contrast different datasets, concepts, or variables.
By clearly displaying the relationships and overlaps between categories, this template aids in uncovering insights and drawing meaningful conclusions.
Why Use This Template?
Organize Complex Data:
Visual Clarity: The template simplifies the organization of complex data, making it easier to understand and analyze.
Structured Comparison: Helps in systematically comparing and contrasting different research elements.
Enhance Analytical Insights:
Identify Patterns: Easily spot patterns, trends, and relationships between different datasets or variables.
Highlight Gaps: Quickly identify gaps or areas needing further investigation.
Facilitate Collaboration:
Team Alignment: Use the template in collaborative research settings to ensure all team members have a clear understanding of the relationships between different research elements.
Interactive Discussions: Ideal for group discussions, brainstorming sessions, and collaborative analysis.
Support Decision-Making:
Informed Conclusions: Helps in making informed decisions by clearly showing the intersection of different research categories.
Strategic Planning: Assists in planning research focus areas, methodologies, and further investigations.
Ease of Use:
Pre-Defined Sections: Comes with pre-defined sections for various categories and their overlaps, making it quick and easy to start using.
Editable Placeholders: Includes editable placeholders for notes, allowing for customization based on specific research needs.
Versatile Application:
Adaptable: Suitable for various types of research, including qualitative, quantitative, and mixed-methods studies.
Reusable: Can be reused across different research projects, making it a valuable tool for ongoing research activities.
Use Cases:
Comparative Studies: Compare different datasets, such as qualitative and quantitative data, or different sources of information.
Thematic Analysis: Identify common themes and unique insights across various research categories.
Data Integration: Integrate findings from different studies or sources to draw comprehensive conclusions.
Research Planning: Plan and prioritize research activities based on identified overlaps and gaps.
Template Features:
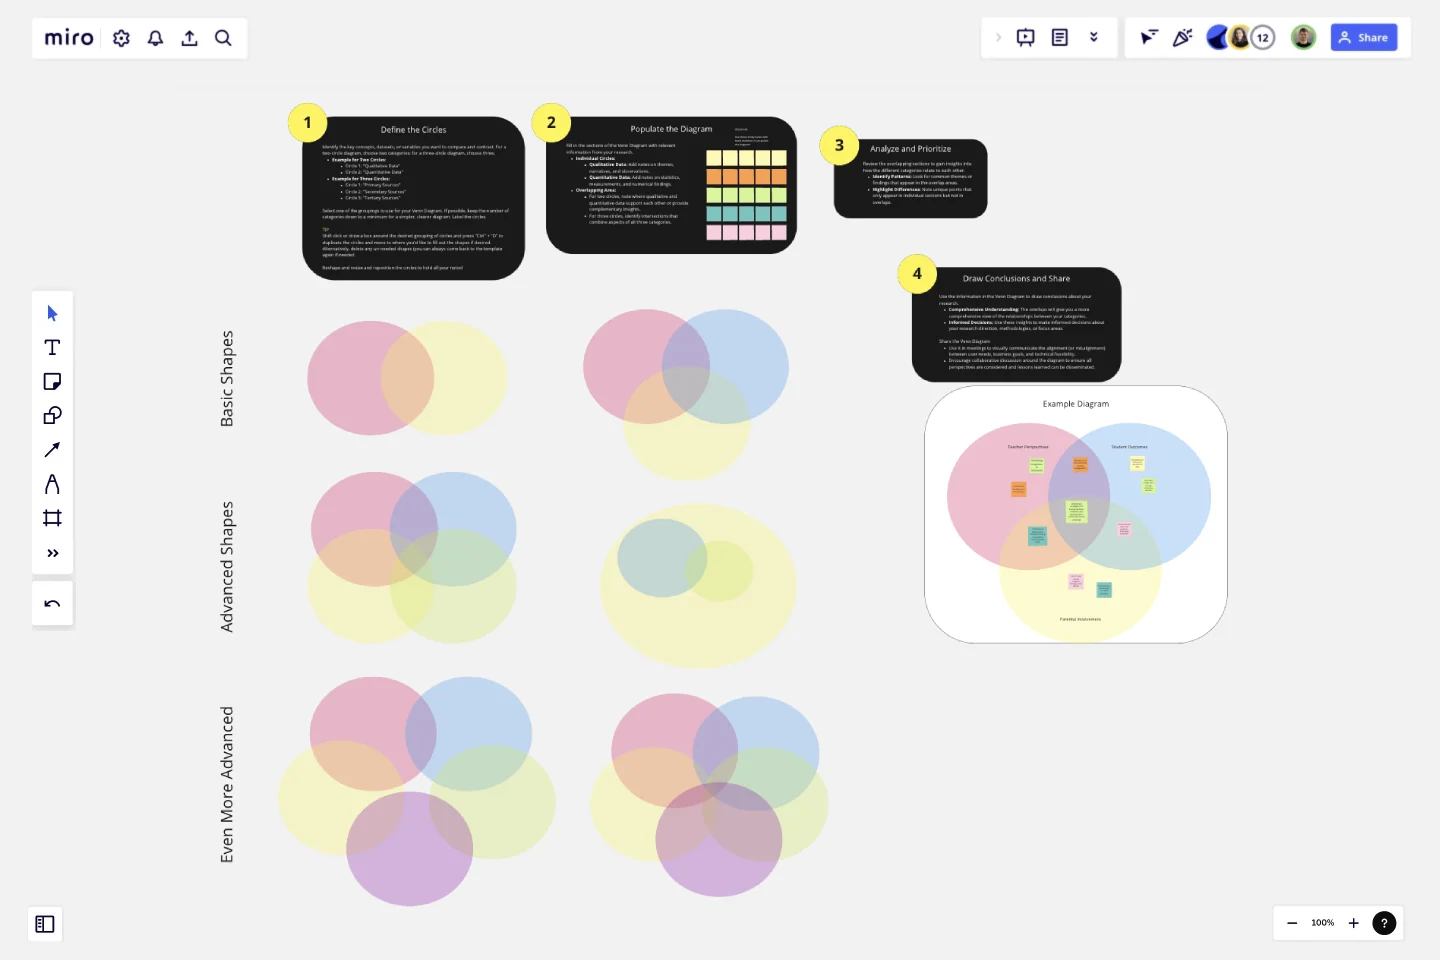
Instructions Section:
Step-by-Step Guide: Simple instructions on how to fill out and use the Venn Diagram effectively.
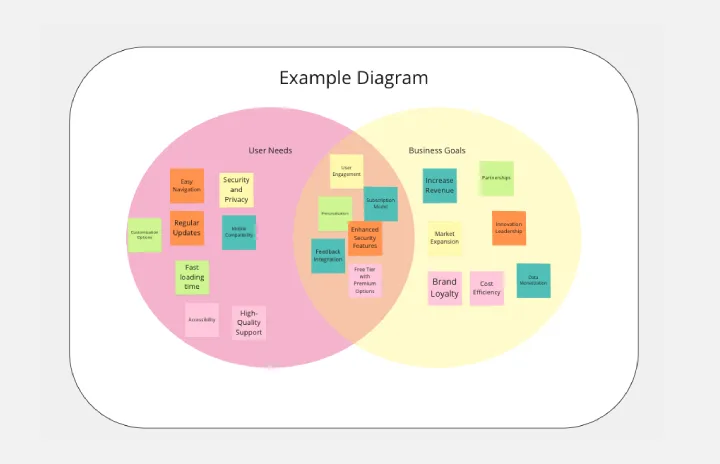
Example Notes:
Pre-Populated Examples: Examples of notes for each section to help users understand how to populate the diagram.
By choosing the Venn Diagram for Research template, researchers can effectively organize and analyze their data, leading to deeper insights and more robust conclusions. This template is ideal for anyone looking to streamline their research process and enhance collaborative efforts.
This template was created by Anthony.
Get started with this template right now.
Fishbone Diagram for Marketing
Works best for:
Fishbone Diagram
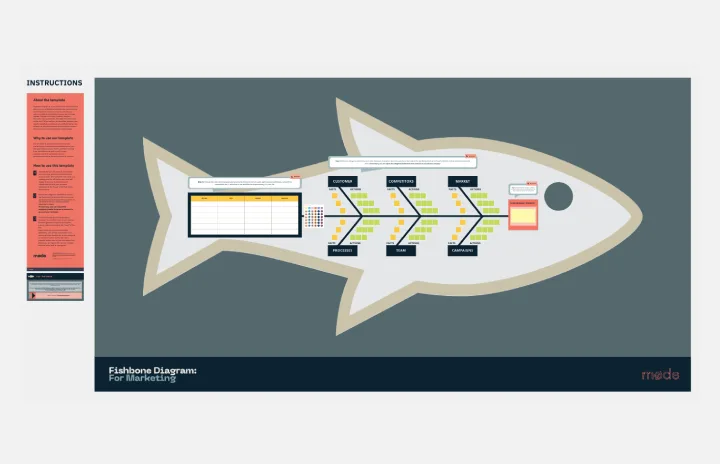
Optimizing marketing strategies requires identifying underlying issues. The Fishbone Diagram Marketing template helps you systematically explore factors affecting your campaigns. Categorize potential causes into areas such as market research, product positioning, promotional strategies, and distribution channels. This structured analysis enables your team to pinpoint and address issues, enhancing marketing effectiveness and achieving better results.
Venn Diagram for Product Development
Works best for:
Venn Diagrams
Streamline your product development process with the Venn Diagram for Product Development template. Use it to compare product features, identify market needs, and explore design options. This template helps you visualize relationships and prioritize features based on customer requirements and competitive analysis. It's an essential tool for product managers, designers, and development teams aiming to create successful and user-centric products.
Crazy Eights Template
Works best for:
Design Thinking, Brainstorming, Ideation
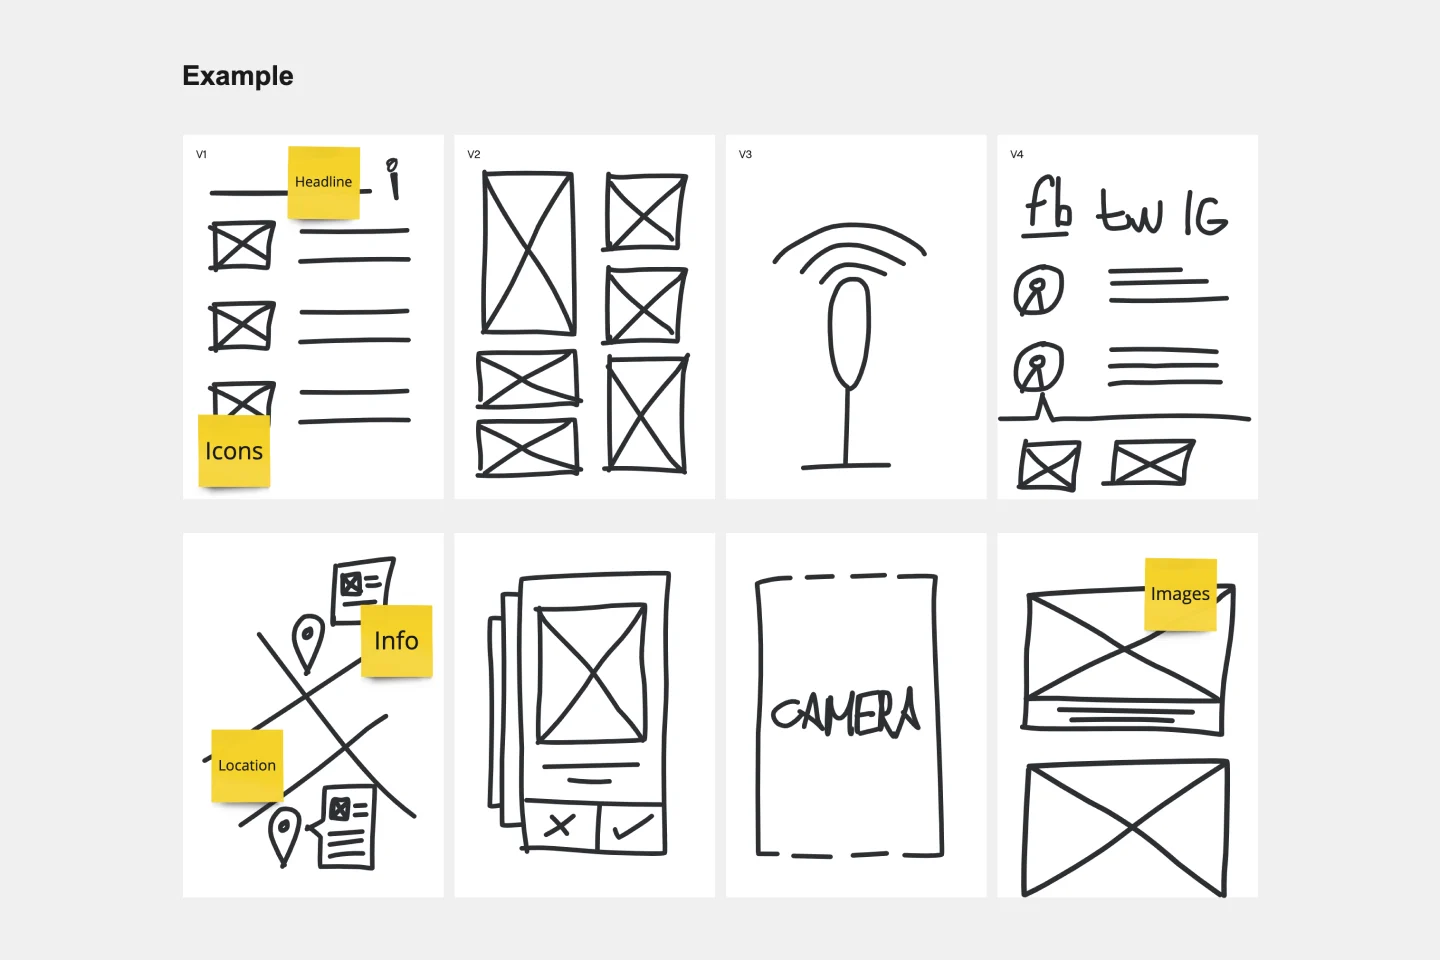
Sometimes you just need to get the team’s creative juices flowing for a brainstorm—and get them thinking of as many ideas as they can, as fast as they can. Crazy Eights will do it in a hurry. Favoring quantity over quality, this sketch brainstorming exercise challenges them to come up with eight ideas in eight minutes, which leaves no time to second guess ideas. It’s perfect for early stages of development, and it’s a team favorite for being fast paced and fun.
Lean UX Canvas Template
Works best for:
Desk Research, Product Management, User Experience
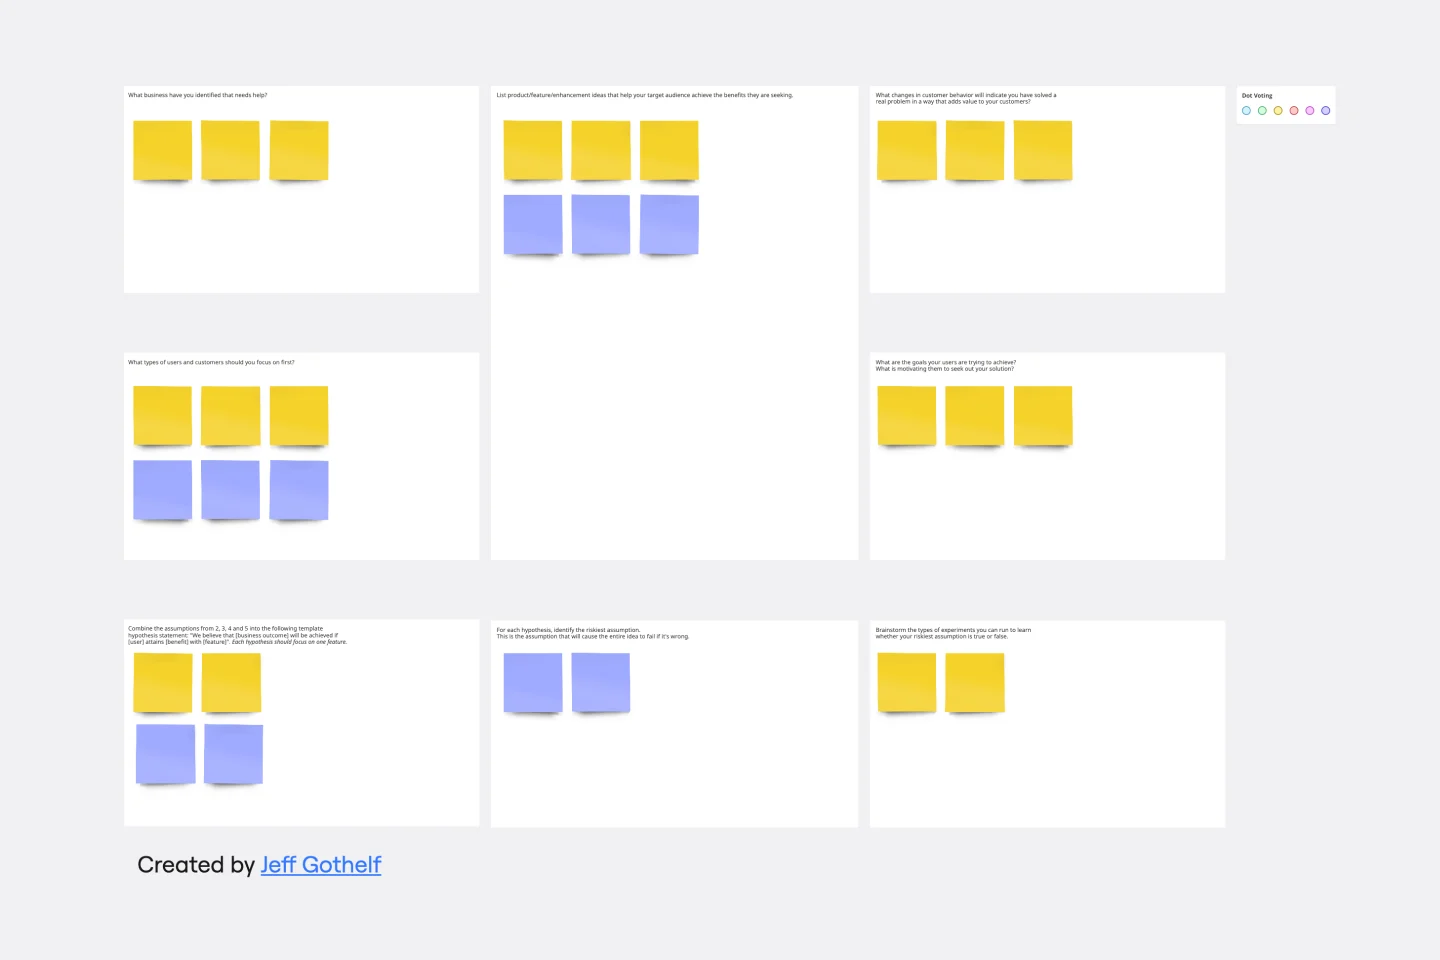
What are you building, why are building it, and who are you building it for? Those are the big pictures questions that guide great companies and teams toward success — and Lean UX helps you find the answers. Especially helpful during project research, design, and planning, this tool lets you quickly make product improvements and solve business problems, leading to a more customer-centric product. This template will let you create a Lean UX canvas structured around eight key elements: Business problem, Business outcome, Users and customers, User benefits, Solution ideas, Hypothesis, Assumptions, Experimentation.
Business Model Canvas Template
Works best for:
Leadership, Agile Methodology, Strategic Planning
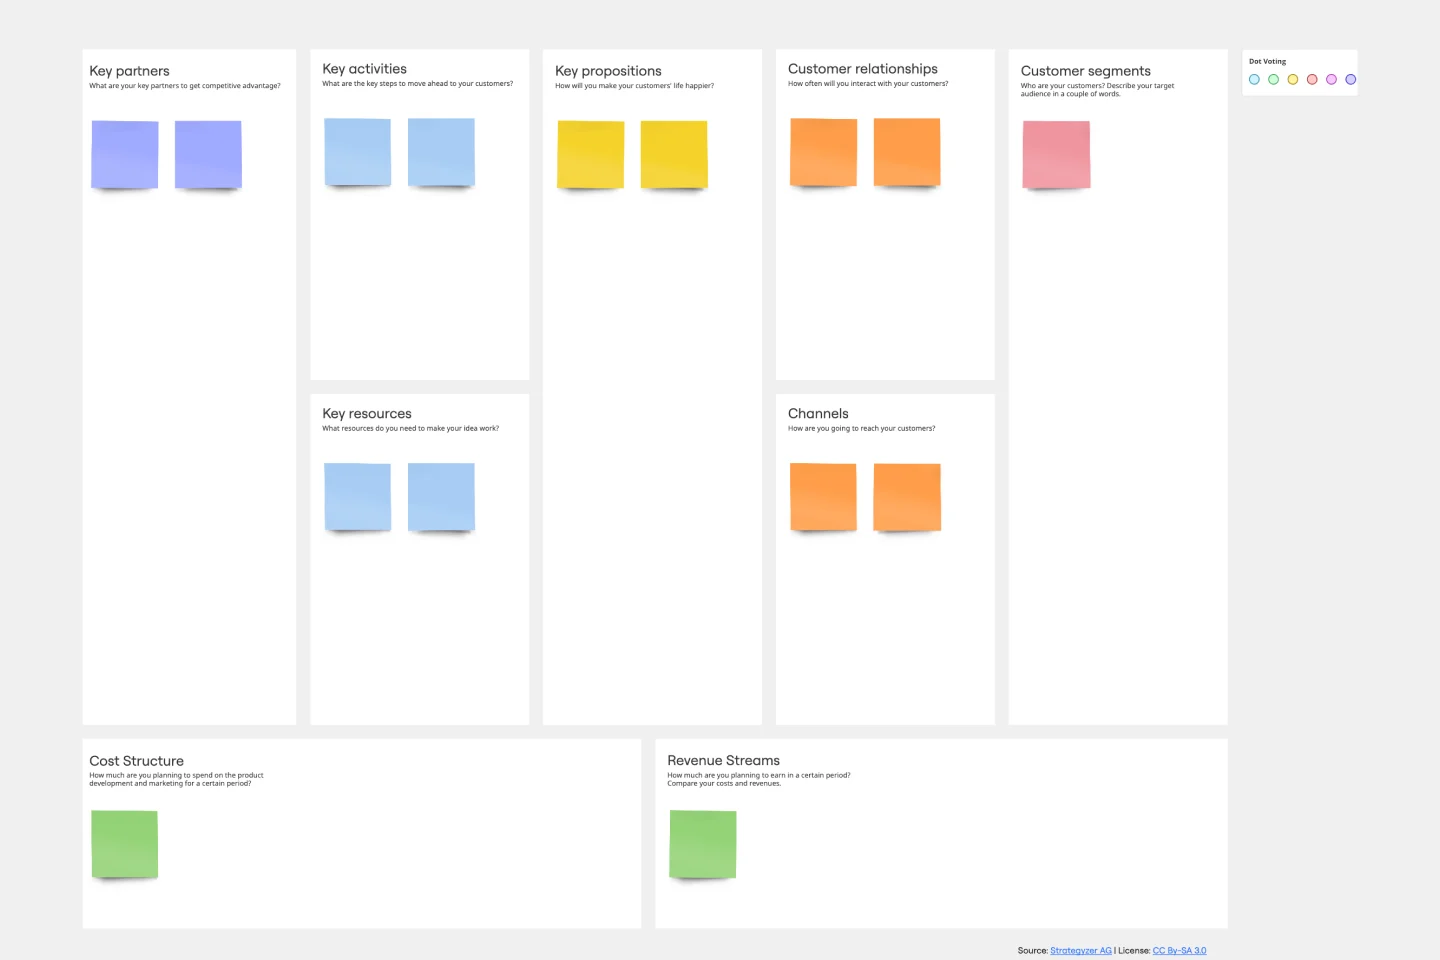
Your business model: Nothing is more fundamental to who you are, what you create and sell, or ultimately whether or not you succeed. Using nine key building blocks (representing nine core business elements), a BMC gives you a highly usable strategic tool to develop and display your business model. What makes this template great for your team? It’s quick and easy to use, it keeps your value proposition front and center, and it creates a space to inspire ideation.
Pros and Cons List Template
Works best for:
Decision Making, Documentation, Strategic Planning
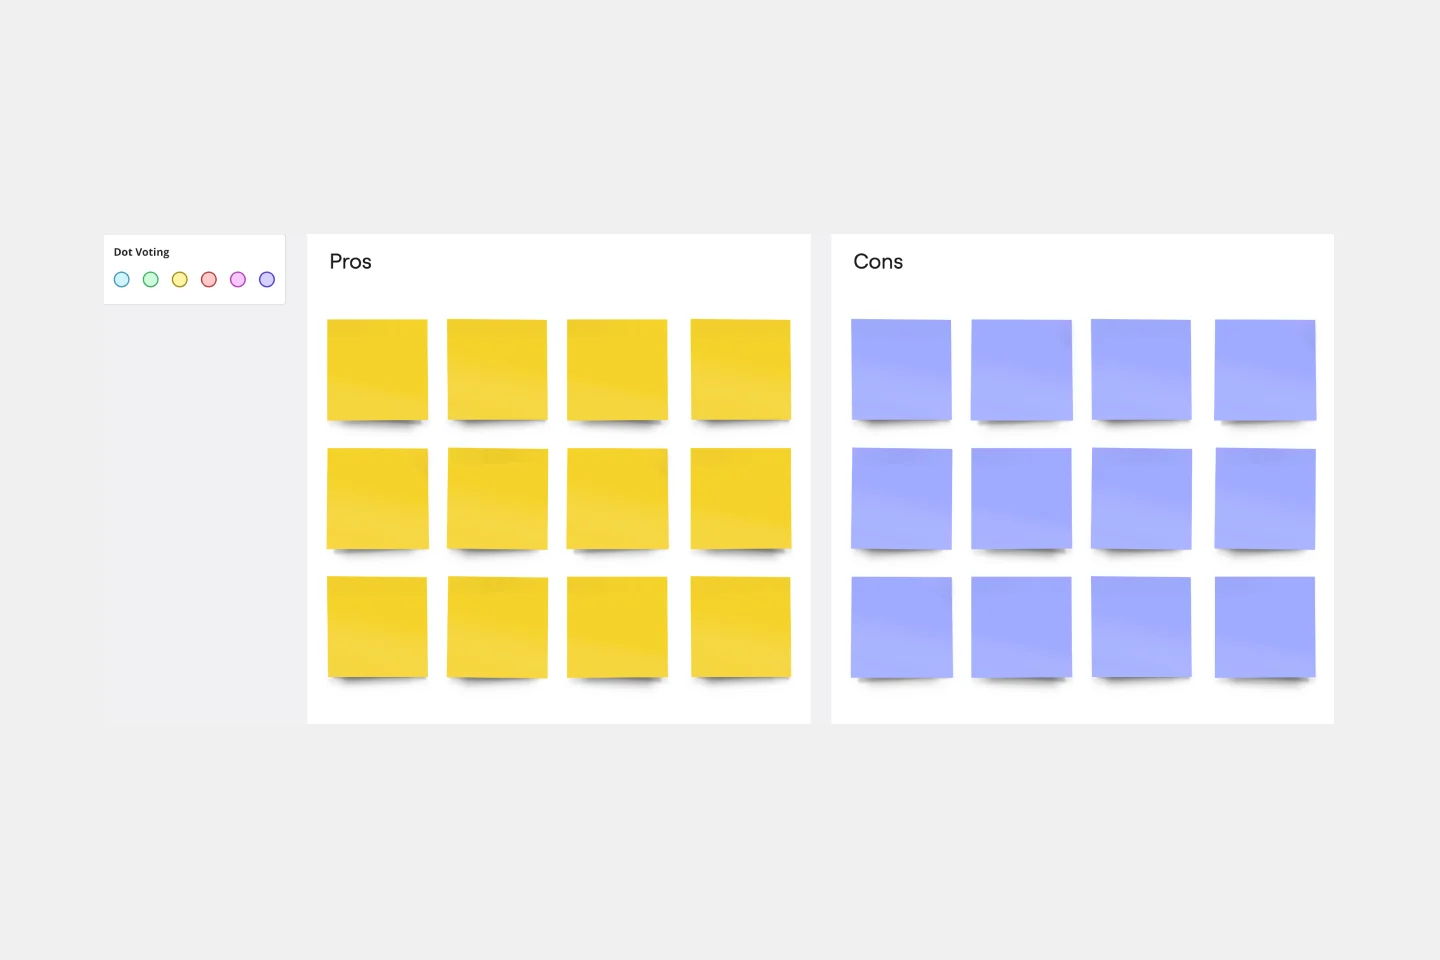
A pros and cons list is a simple but powerful decision-making tool used to help understand both sides of an argument. Pros are listed as arguments in favor of making a particular decision or action. Cons are listed arguments against it. By creating a list that details both sides of the argument, it becomes easier to visualize the potential impact of your decision. To make your pros and cons list even more objective, it can help to weight each pro and con against the others. You can then present your decision with confidence, making a strong argument for why it’s the right one.