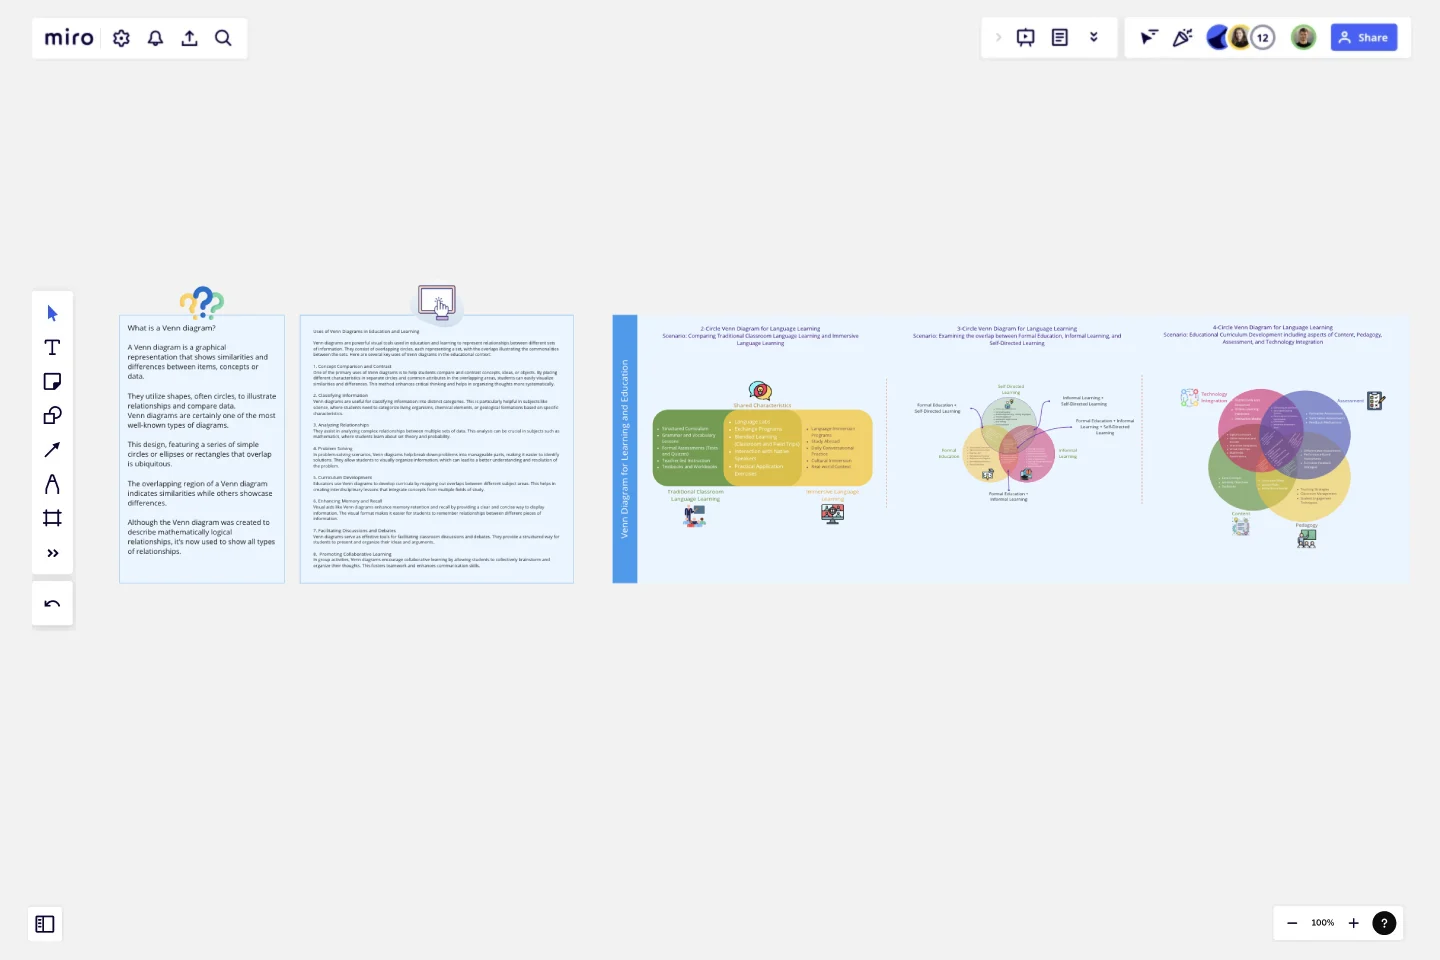
Venn Diagram for Learning and Education
A Venn diagram is a graphical representation that shows similarities and differences between items, concepts or data.
They utilize shapes, often circles, to illustrate relationships and compare data.
Venn diagrams are certainly one of the most well-known types of diagrams. This design, featuring a series of simple circles or ellipses or rectangles that overlap is ubiquitous. The overlapping region of a Venn diagram indicates similarities while others showcase differences. Although the Venn diagram was created to describe mathematically logical relationships, it’s now used to show all types of relationships.
Uses of Venn Diagrams in Education and Learning
Venn diagrams are powerful visual tools used in education and learning to represent relationships between different sets of information. They consist of overlapping circles, each representing a set, with the overlaps illustrating the commonalities between the sets. Here are several key uses of Venn diagrams in the educational context:
1. Concept Comparison and Contrast
One of the primary uses of Venn diagrams is to help students compare and contrast concepts, ideas, or objects. By placing different characteristics in separate circles and common attributes in the overlapping areas, students can easily visualize similarities and differences. This method enhances critical thinking and helps in organizing thoughts more systematically.
2. Classifying Information
Venn diagrams are useful for classifying information into distinct categories. This is particularly helpful in subjects like science, where students need to categorize living organisms, chemical elements, or geological formations based on specific characteristics.
3. Analyzing Relationships
They assist in analyzing complex relationships between multiple sets of data. This analysis can be crucial in subjects such as mathematics, where students learn about set theory and probability.
4. Problem Solving
In problem-solving scenarios, Venn diagrams help break down problems into manageable parts, making it easier to identify solutions. They allow students to visually organize information, which can lead to a better understanding and resolution of the problem.
5. Curriculum Development
Educators use Venn diagrams to develop curricula by mapping out overlaps between different subject areas. This helps in creating interdisciplinary lessons that integrate concepts from multiple fields of study.
6. Enhancing Memory and Recall
Visual aids like Venn diagrams enhance memory retention and recall by providing a clear and concise way to display information. The visual format makes it easier for students to remember relationships between different pieces of information.
7. Facilitating Discussions and Debates
Venn diagrams serve as effective tools for facilitating classroom discussions and debates. They provide a structured way for students to present and organize their ideas and arguments.
8. Promoting Collaborative Learning
In group activities, Venn diagrams encourage collaborative learning by allowing students to collectively brainstorm and organize their thoughts. This fosters teamwork and enhances communication skills.Three examples from the above areas have been created to help you understand the application of the Venn diagram in the Education and Learning domain.
This template was created by Khawaja Rizwan.
Get started with this template right now.
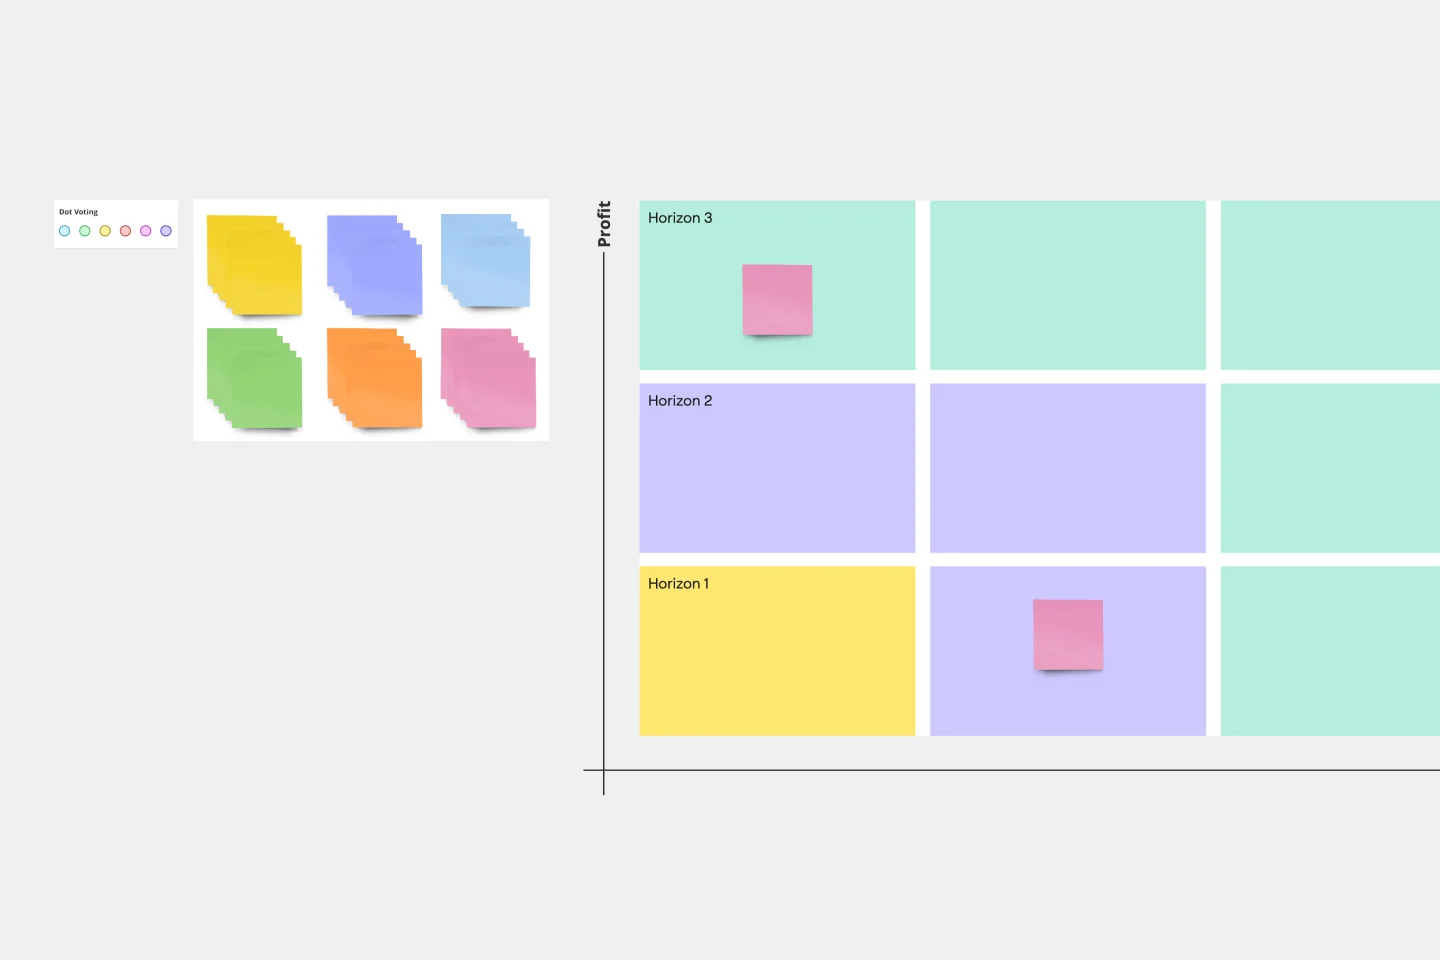
3 Horizons of Growth Template
Works best for:
Leadership, Strategic Planning, Project Planning
Featured in The Alchemy of Growth, this model gives ambitious companies a way to balance the present and the future—in other words, what’s working in the existing business and what emerging, possibly-profitable growth opportunities lie ahead. Then teams across the organization can make sure that their projects map to and support the organization’s goals. The 3 Horizons of Growth model is also a powerful way to foster a culture of innovation—one that values and depends on experimentation and iteration—and to identify opportunities for new business.
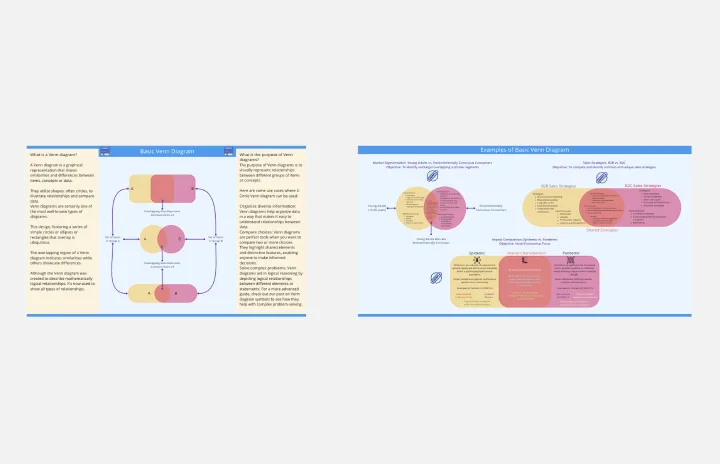
Basic Venn Diagram
Works best for:
Venn Diagram
The Basic Venn Diagram template is a simple yet powerful tool for visualizing relationships between different sets. Use it to compare and contrast concepts, identify commonalities and differences, and organize information logically. This template is perfect for brainstorming, teaching, and presentations, making complex information more accessible and understandable. Ideal for educators, students, and professionals in various fields.
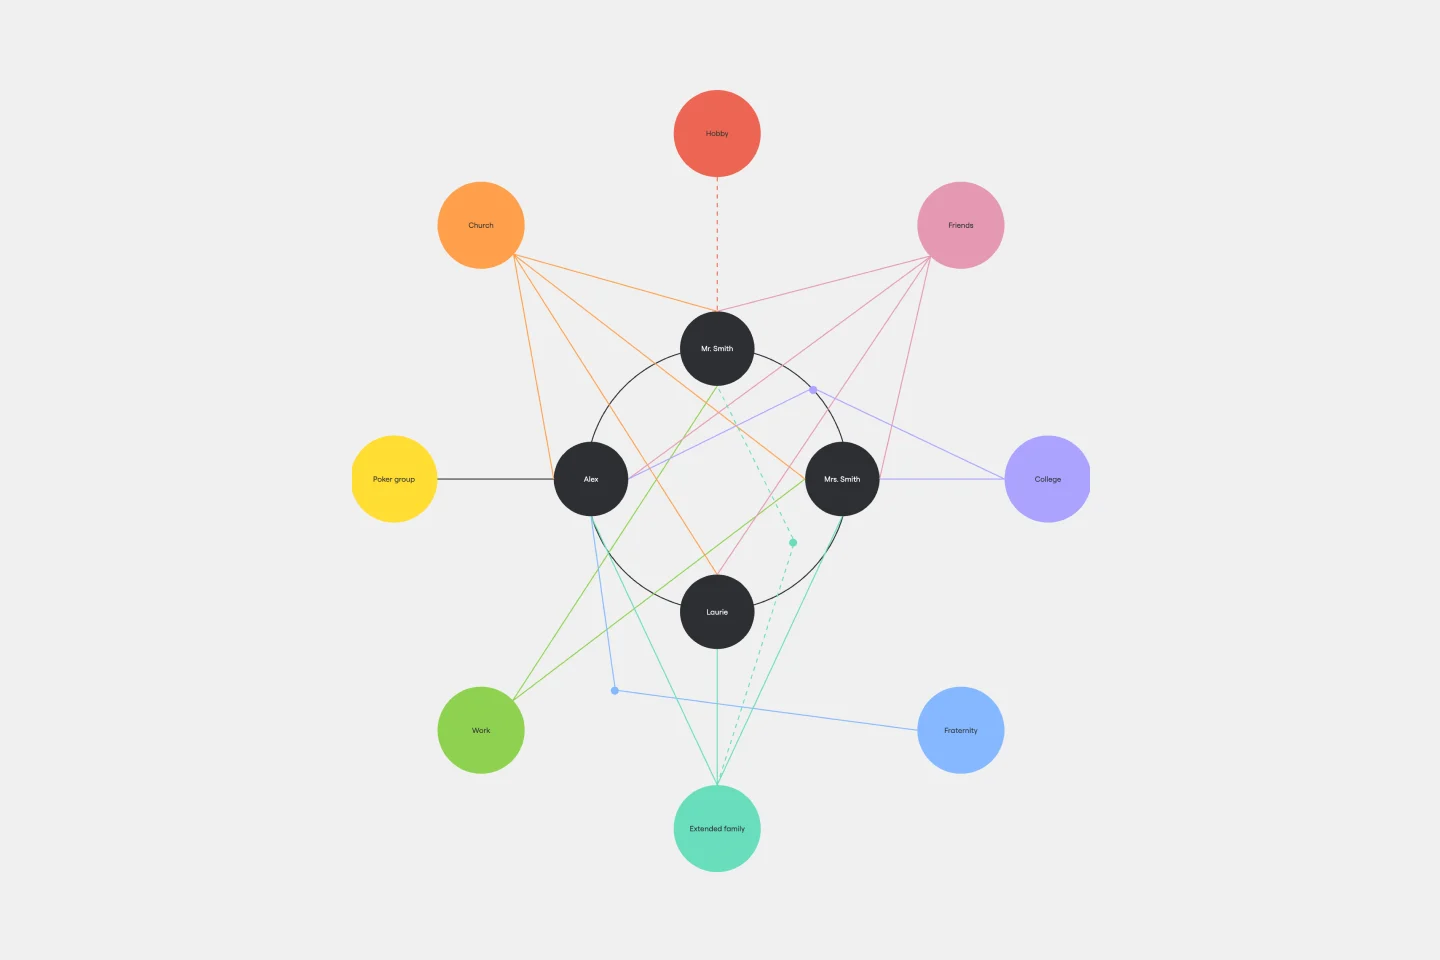
Ecomap Template
Works best for:
Strategy & Planning, Diagramming
The Ecomap Template illustrates the multifaceted relationships and environmental interactions encircling an individual or entity. Determine crucial patterns and dynamics by providing a clear and comprehensive visualization of how different systems intertwine and influence each other.
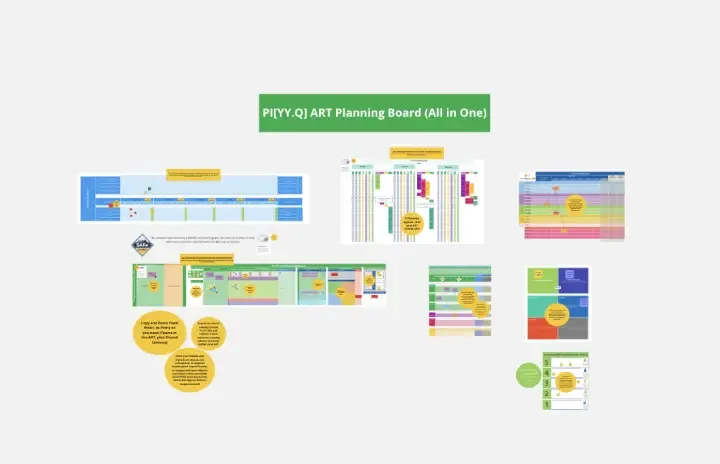
All-in-one PI Planning
Works best for:
Agile
The All-in-one PI Planning template streamlines the SAFe Program Increment (PI) Planning process by providing a comprehensive framework for teams to collaboratively plan and align on objectives and dependencies. It integrates essential elements such as PI Objectives, Team Breakouts, and Program Board, enabling teams to visualize, prioritize, and coordinate work effectively. This template empowers Agile Release Trains to deliver value predictably and efficiently, driving alignment and synchronization across the organization.
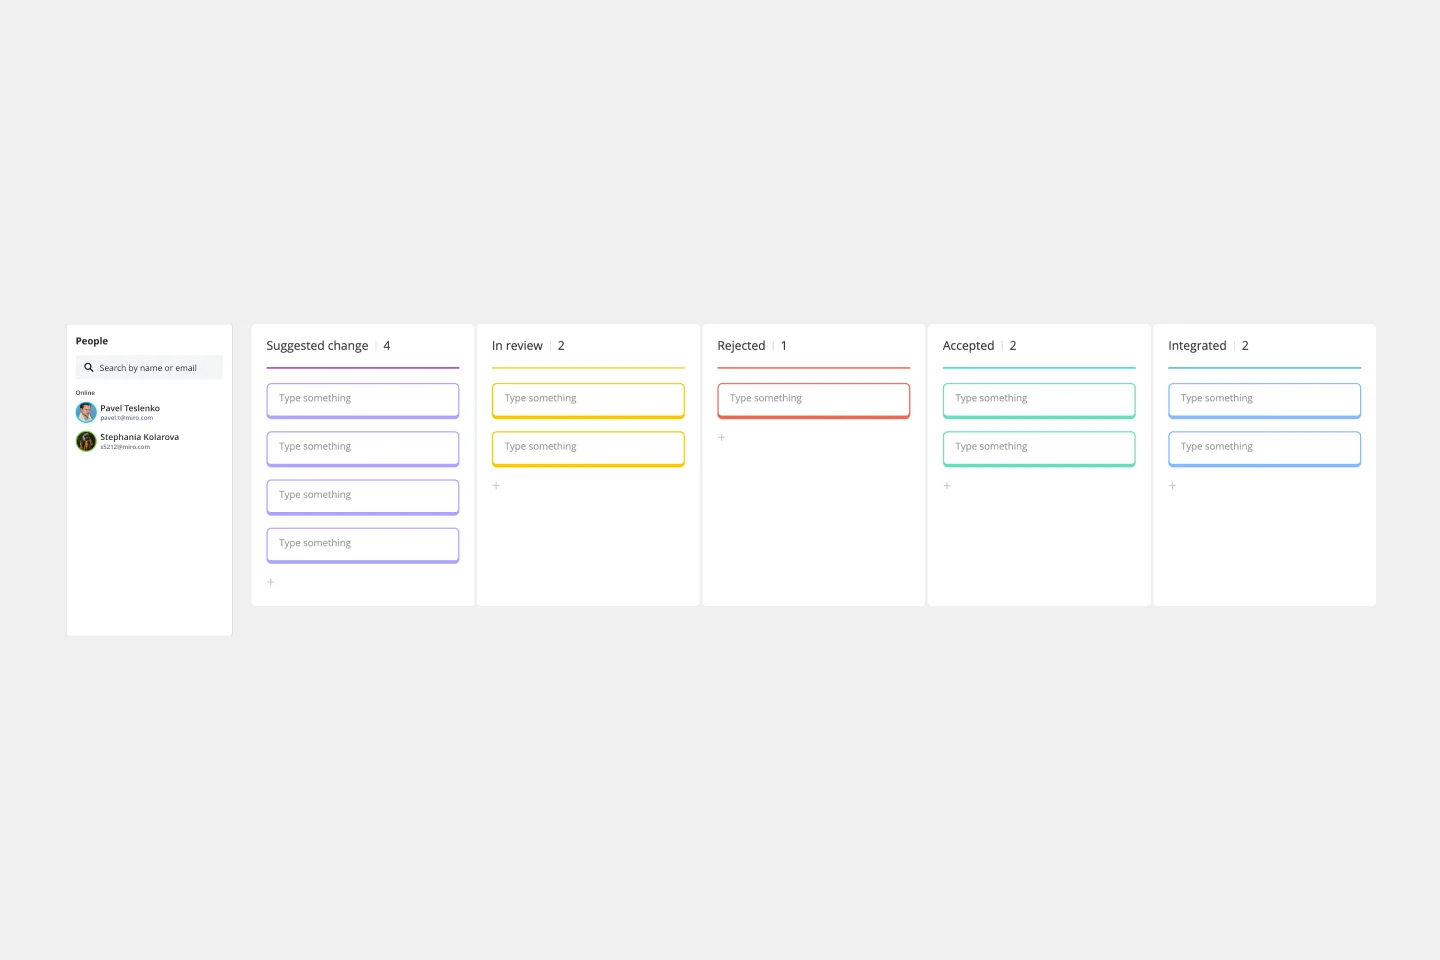
Change Control Process Template
Works best for:
Agile Methodology, Documentation, Product Management
You can predict, research, and plan for every detail of a project to go a certain way—then along comes the unforeseen and modifications are needed. That’s when a change control process comes into play. It helps define the right steps to take, gives stakeholders full visibility, and reduces the chances of errors and disruption. And this template is easy to use and highly effective—for ensuring that proposed changes are reviewed before they’re implemented, and empowering teams to veto changes that might prove unnecessary or disruptive.
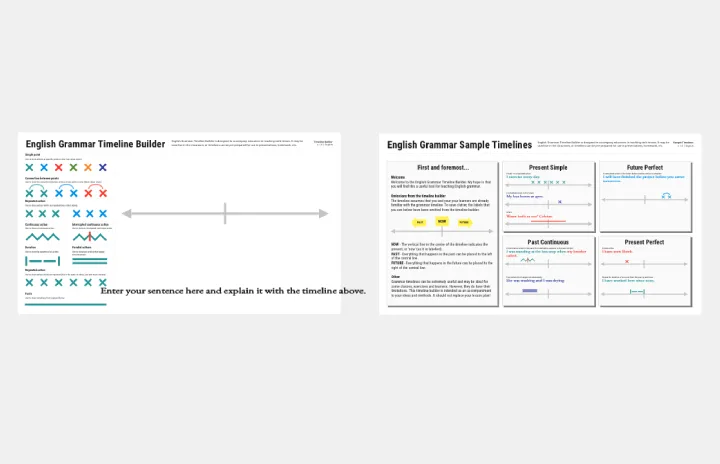
English Grammar Timeline Builder
The English Grammar Timeline template helps you map out the progression of grammar concepts over time. This is a great tool for educators and students to visualize the sequence and relationship between different grammar topics, making learning and teaching more effective.