Value Chain Analysis Template
Understand the value your business has delivered to your customers with the value chain analysis template.
About the Porter’s Value Chain Model (aka Value Chain Analysis template)
Commonly known as the Value Chain Analysis, Porter’s Value Chain Model is a much-used method to evaluate a business’s competitive edge and improve processes to have fewer bottlenecks and add more value to your customers.
What is a value chain analysis template?
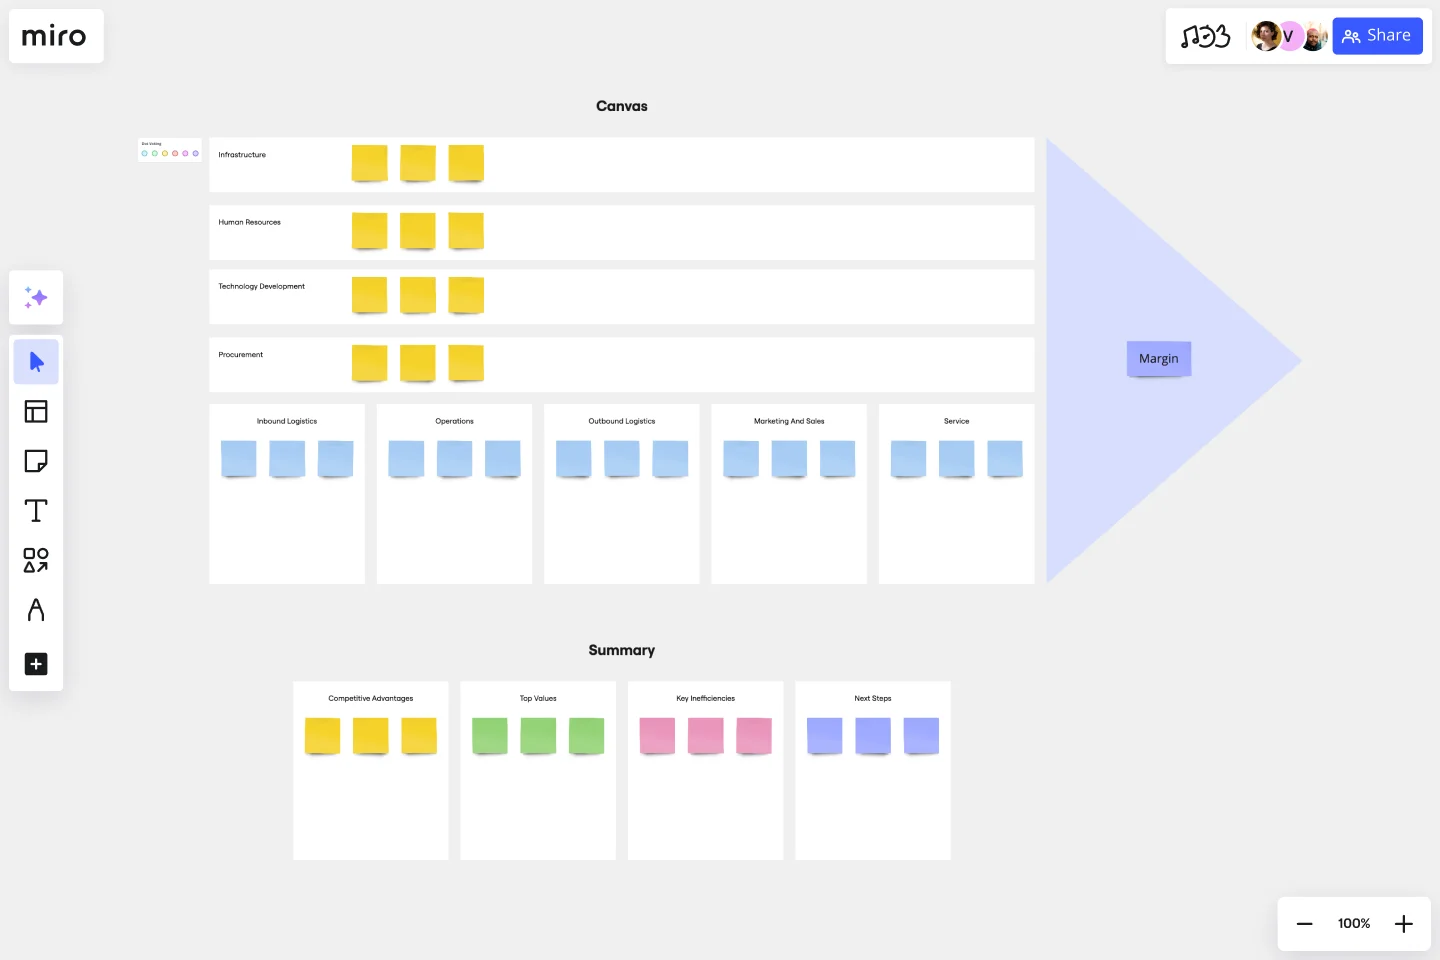
A value chain analysis template includes a set of activities a company performs to deliver a valuable product from start to finish. The analysis allows your team to visualize all the business activities involved in creating the product — and helps you identify inefficiencies, bottlenecks, and miscommunications within the process.
Create your own value chain analysis template
Getting started with your team’s value chain analysis template is easy with Miro. Simply click “Use Template” and take the following steps to customize it for your own value chain analysis template:
Step 1: Replace the canned text in the orange squares and blue lines with your business’s specific primary and support business activities.
Step 2: Use sticky notes to map out the process for each business activity.
Step 3: Identify where bottlenecks occur and find areas where you can maximize value and gain a competitive advantage.
Make sure to consider using Miro's Value Stream Mapping tool during this process. This framework can help improve the efficiency of a specific process, which can then be integrated into a broader Value Chain Analysis to optimize the overall value delivery of the organization. Several value stream mapping templates are available on Miro to help get you started.
Benefits of using a value chain analysis template
First coined by Harvard Business School professor Michael Porter, Porter’s Value Chain Model helps your team evaluate your business activities so you can find ways to improve your competitive advantage. The value chain analysis will also help you determine costs, find activities that add the most value, outshine your competitors, and improve the value of what you deliver to your customers.
Building a product can be costly in terms of both time and resources. Even worse, it can be almost impossible to know whether a process works until after you’ve tried it. Porter’s Value Chain Model helps you visualize more complex or intangible processes.
Every business should perform this analysis at some point. Your team can do this anytime you want to improve your competitive advantage taking the following steps:
Define your business’s primary activities (e.g. logistics, operations, marketing).
Define your business’s support activities (e.g. HR, infrastructure, tech).
Analyze the cost and value of each.
Discover opportunities that allow you to gain a competitive advantage.
How do you draw Porter's value analysis?
You can build your Porter’s Value Chain Model following these steps: - Map all activities involved in producing your product - Calculate the cost of each activity - Find out what do your customers perceive as value - Check competitors Porter’s Value Chain Model and benchmarks - Choose what’s your competitive advantage and where will you capitalize
How do you analyze a value chain?
After building your value chain analysis template, you can evaluate the links between each activity and its values. This value chain analysis is particularly crucial when increasing competitiveness as it will determine how to proceed to improve processes.
How do you write a value chain analysis?
You can write your value chain analysis determining which activities are to be optimized. The analysis should include quantitative and qualitative data to help you develop action points to increase your product’s added value and customer base. After your value chain analysis is ready, you can draw a business case to implement changes and help you prioritize.
Get started with this template right now.

20/80 Process Diagram - EOS Compatible
Works best for:
Diagramming
The 20/80 Process Diagram - EOS® Compatible template is a visual tool for mapping out processes and workflows aligned with the Entrepreneurial Operating System (EOS®) methodology. It provides a structured framework for identifying core processes and key activities that drive business outcomes. This template enables organizations to streamline operations, clarify roles and responsibilities, and enhance accountability. By promoting alignment with EOS® principles, the 20/80 Process Diagram empowers teams to achieve organizational excellence and drive sustainable growth.
Executive Summary Template
Works best for:
Leadership, Project Management, Documentation
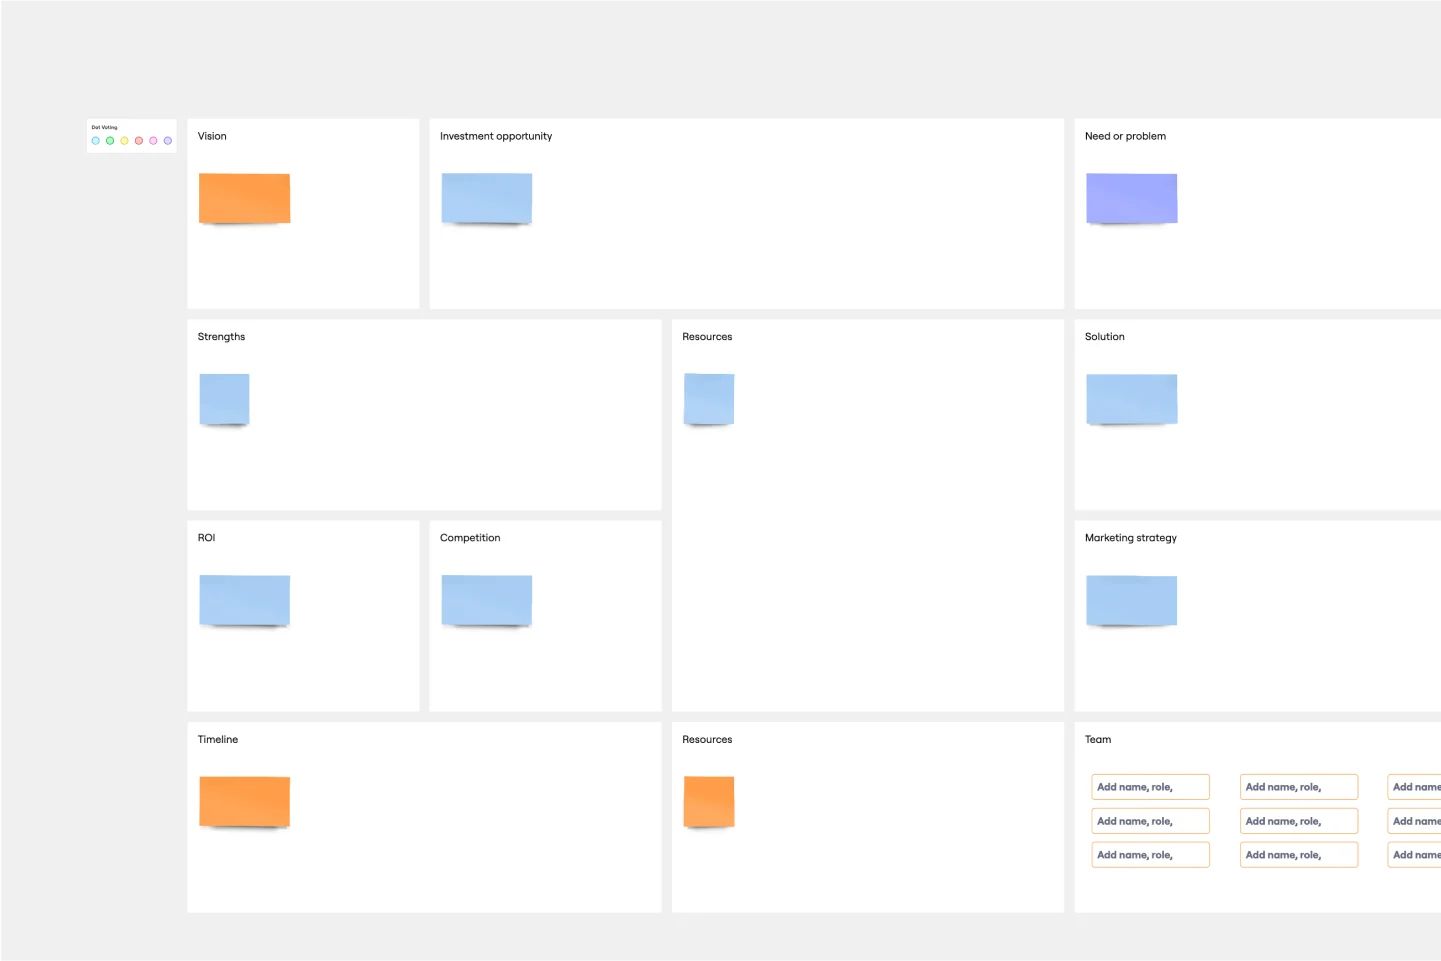
Pique their curiosity. Get them excited. Inspire them to keep reading, diving further into your proposal details. That’s what a good executive summary has the power to do—and why it’s a crucial opening statement for business plans, project plans, investment proposals, and more. Use this template to create an executive summary that starts building belief, by answering high-level questions that include: What is your project? What are the goals? How will you bring your skills and resources to the project? And who can expect to benefit?
3-Circle Venn Diagram
Works best for:
Education, Diagrams, Brainstorming
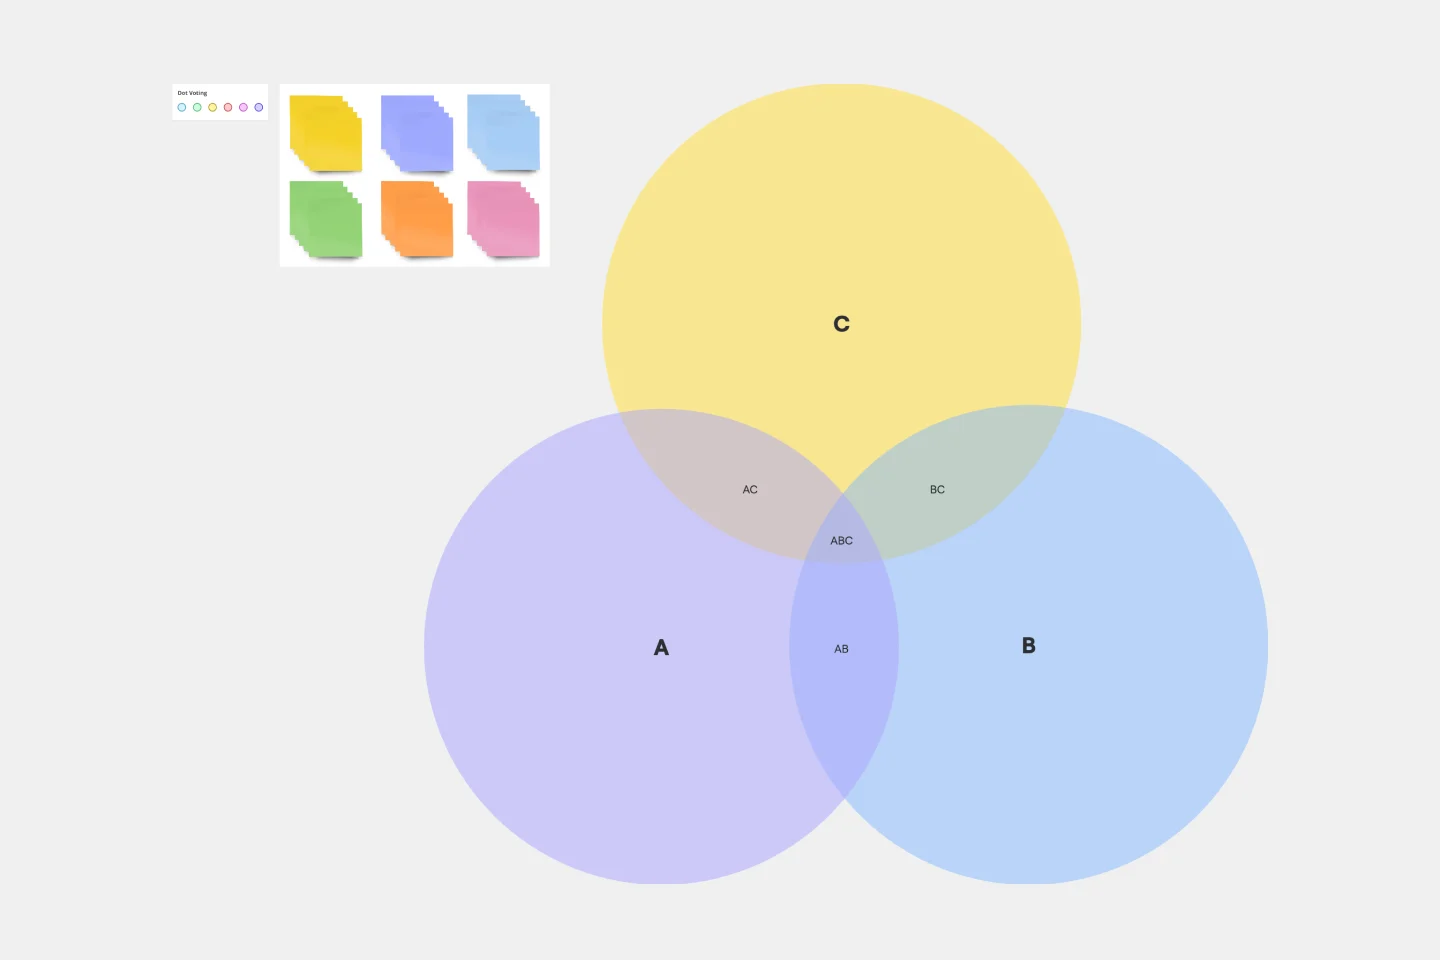
Venn diagrams have been a staple of business meetings and presentations since the 1800s, and there’s a good reason why. Venn diagrams provide a clear, effective way to visually showcase relationships between datasets. They serve as a helpful visual aid in brainstorming sessions, meetings, and presentations. You start by drawing a circle containing one concept, and then draw an overlapping circle containing another concept. In the space where the circles overlap, you can make note of the concepts’ similarities. In the space where they do not, you can make note of their differences.
SMART Goals Template
Works best for:
Prioritization, Strategic Planning, Project Management
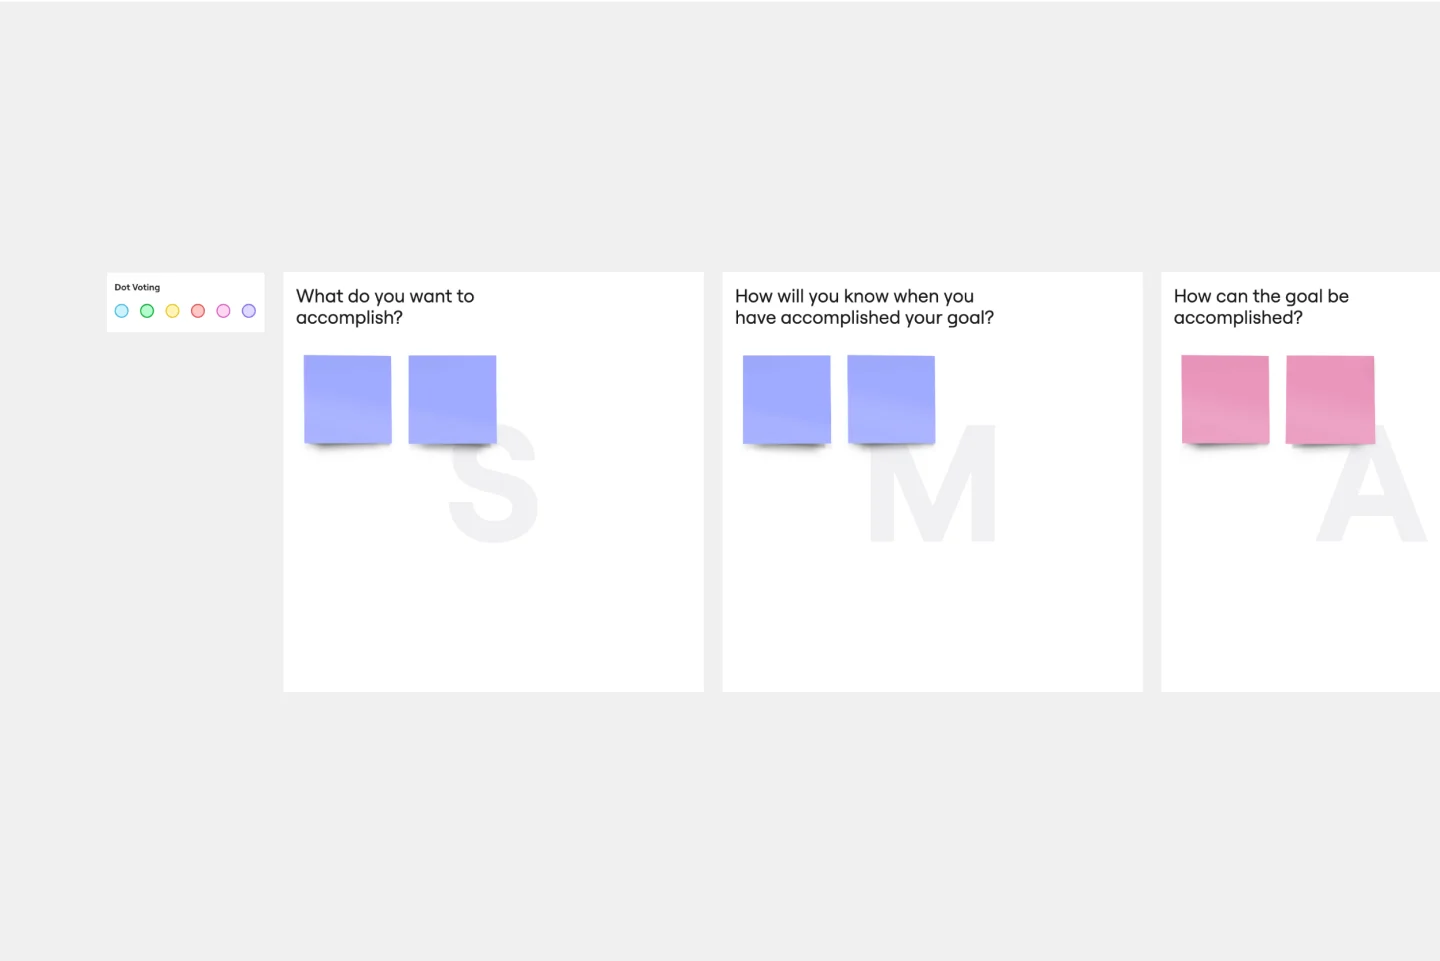
Setting goals can be encouraging, but can also be overwhelming. It can be hard to conceptualize every step you need to take to achieve a goal, which makes it easy to set goals that are too broad or too much of a stretch. SMART is a framework that allows you to establish goals in a way that sets you up for success. SMART stands for Specific, Measurable, Attainable, Relevant, and Timely. If you keep these attributes in mind whenever you set goals, then you’ll ensure your objectives are clear and reachable. Your team can use the SMART model anytime you want to set goals. You can also use SMART whenever you want to reevaluate and refine those goals.
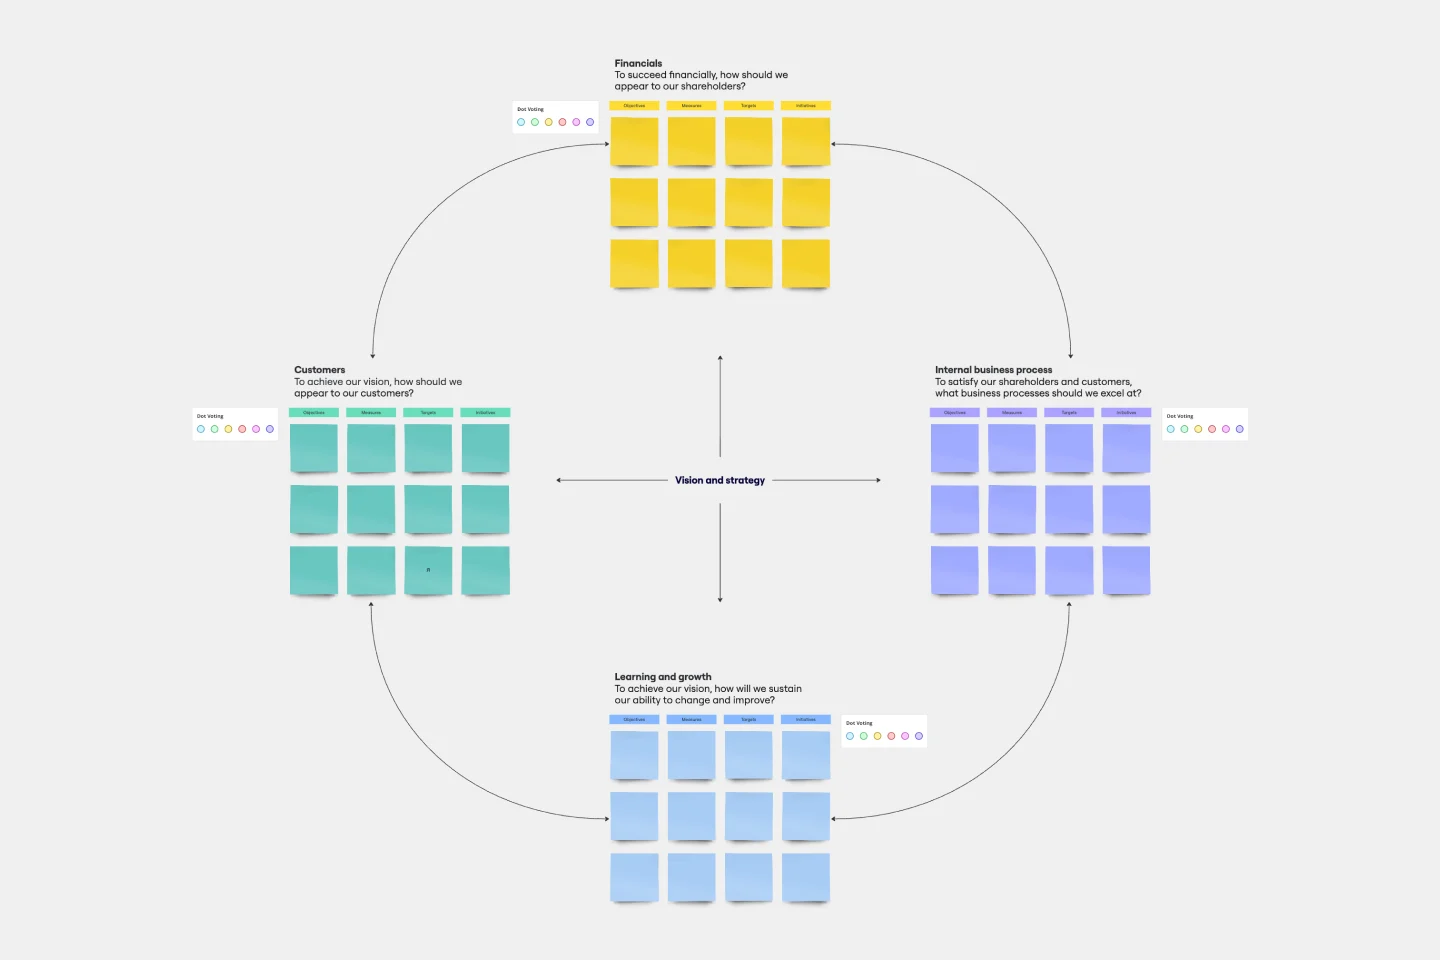
Balanced Scorecard Template
Works best for:
Operations, Strategic Planning, Project Planning
Balanced scorecards are useful tools for understanding business performance at a glance with regard to customers, employees, business processes, and financial progress. Learn more about BSCs and create your own using Miro’s Balanced Scorecard template.
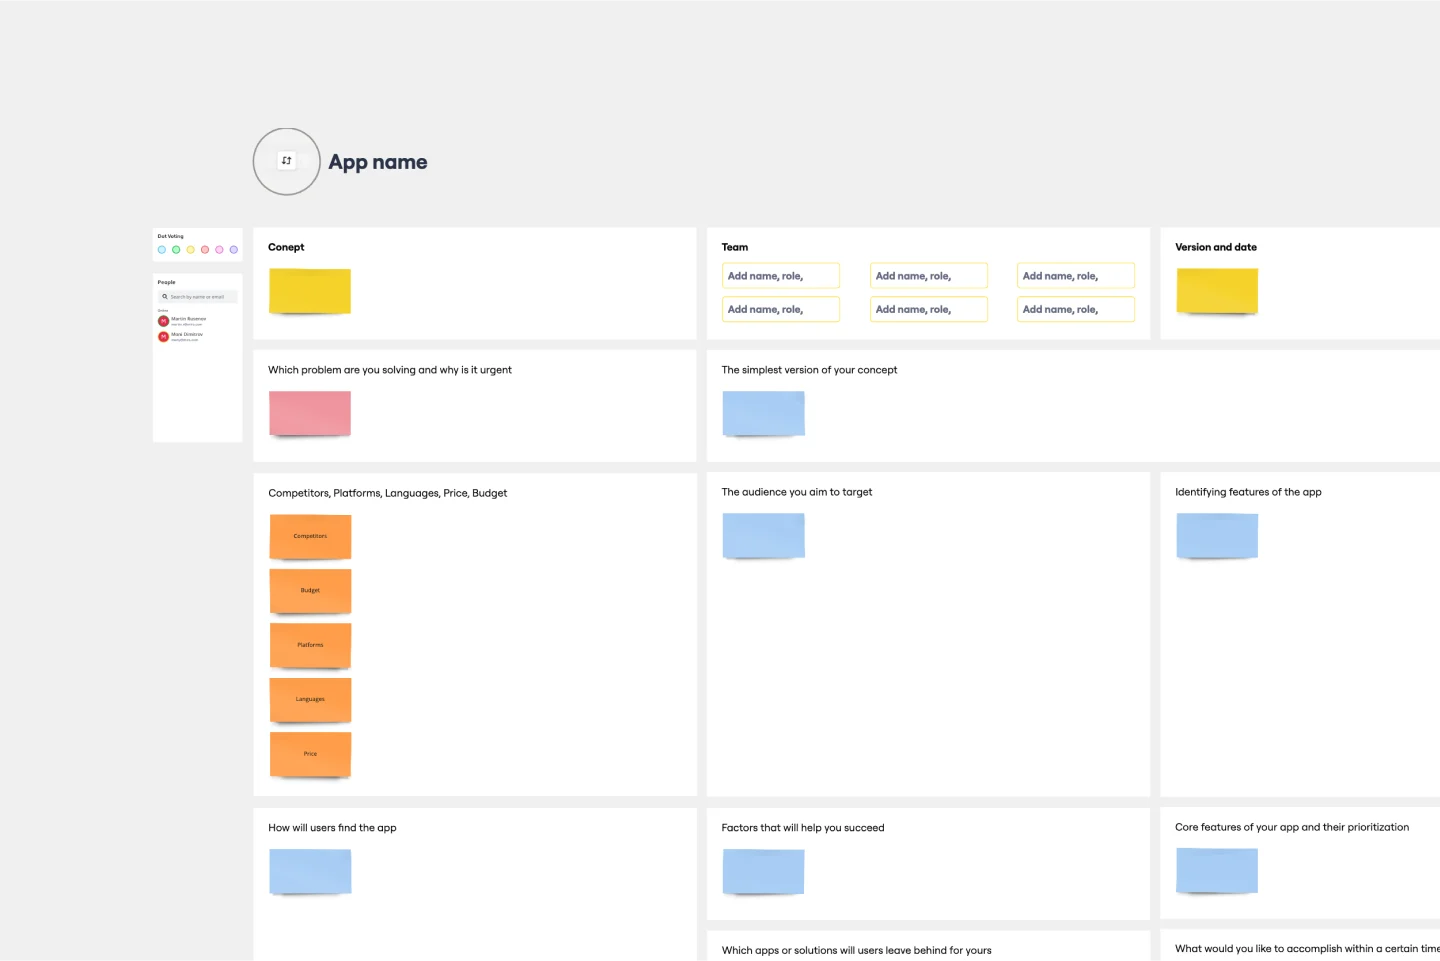
App Development Canvas Template
Works best for:
Market Research, Product Management, User Experience
Ever noticed that building a successful app requires lots of players and moving parts? If you’re a project manager, you definitely have. Lucky for you, an app development canvas will let you own and optimize the entire process. It features 18 boxes, each one focusing on a key aspect of app development, giving you a big-picture view. That way you can fine-tune processes and get ahead of potential problems along the way—resulting in a smoother path and a better, tighter product.