UML Use Case Diagram
Visualize system interactions with the UML Use Case Diagram. Map out user interactions and system processes for better planning.
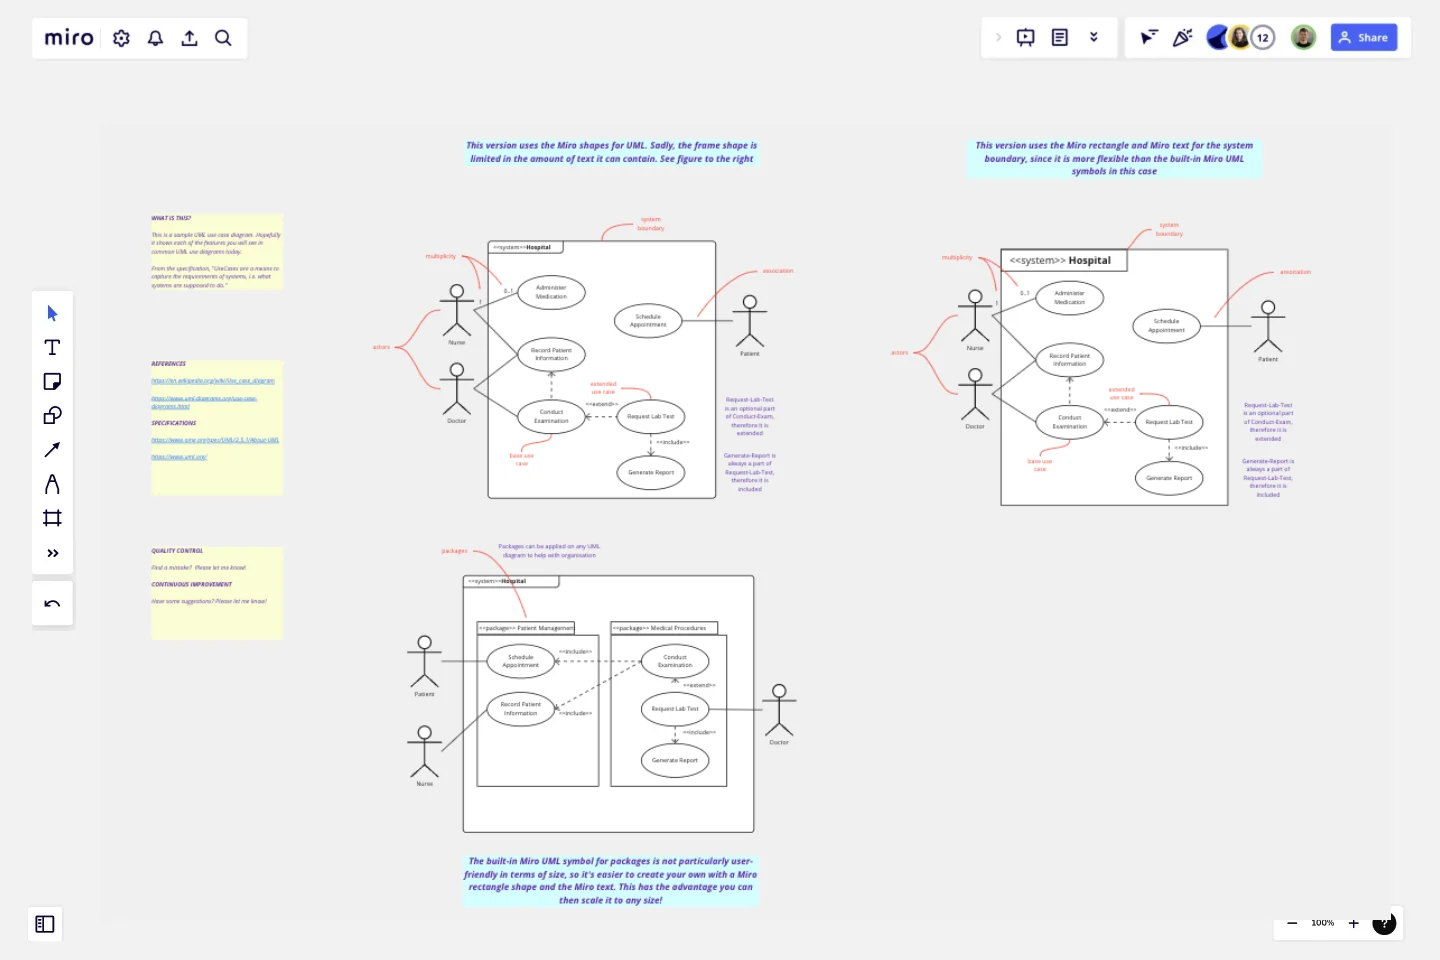
It is an internationally recognized standard consisting of 14 diagrams in two categories: behavior diagrams (that document how systems work and interact) and structural diagrams (that document how systems are structured.The UML Use Case Diagram is without doubt the most common behavioral diagram. It visually represents the functional requirements of a system, illustrating the interactions between users (actors) and the system to achieve specific goals (use cases).
Who can use this [UML Use Case Diagram] template
This template can be used by anyone who needs to create a UML Use Case Diagram.
How to use this [UML Use Case Diagram] template
This template contains two sample UML Use Case diagrams: one that has been created with Miro's built-in diagramming symbols, and one that uses some custom symbols. For simple diagrams, the built-in Miro symbols will probably work well. But in some cases (such as when the text is very long) not all the built-in Miro symbols will look as aesthetically pleasing as they could.
What this [UML Use Case Diagram] helps you accomplish
If you need to create a UML Use Case diagram, this template can hopefully make the job a bit easier and faster. Instead of starting from scratch, you can copy-and-paste this diagram into your own template and customize as you require.
Tips and best practices
Identify your actors and systems clearly
Keep it simple and high-level
Use descriptive names (e.g. "order pizza")
Take a goal-oriented approach. In other words, what goals do the actors have and what use cases are required for the actors to achieve their goals.
This template was created by Ken Ritley.
Get started with this template right now.
Crowd Sourced Cause and Effect
Works best for:
Fishbone Diagram, Problem solving
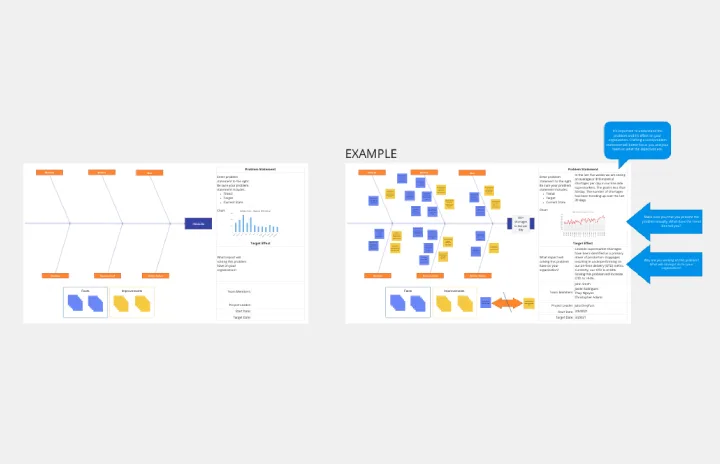
The Crowd Sourced Cause and Effect template leverages collective intelligence to identify root causes of problems. By involving multiple team members, you can gather diverse perspectives and uncover insights that might be overlooked. This collaborative approach ensures a comprehensive analysis and fosters team engagement.
UML Component Diagram Template
Works best for:
Mapping, Diagrams, Software Development
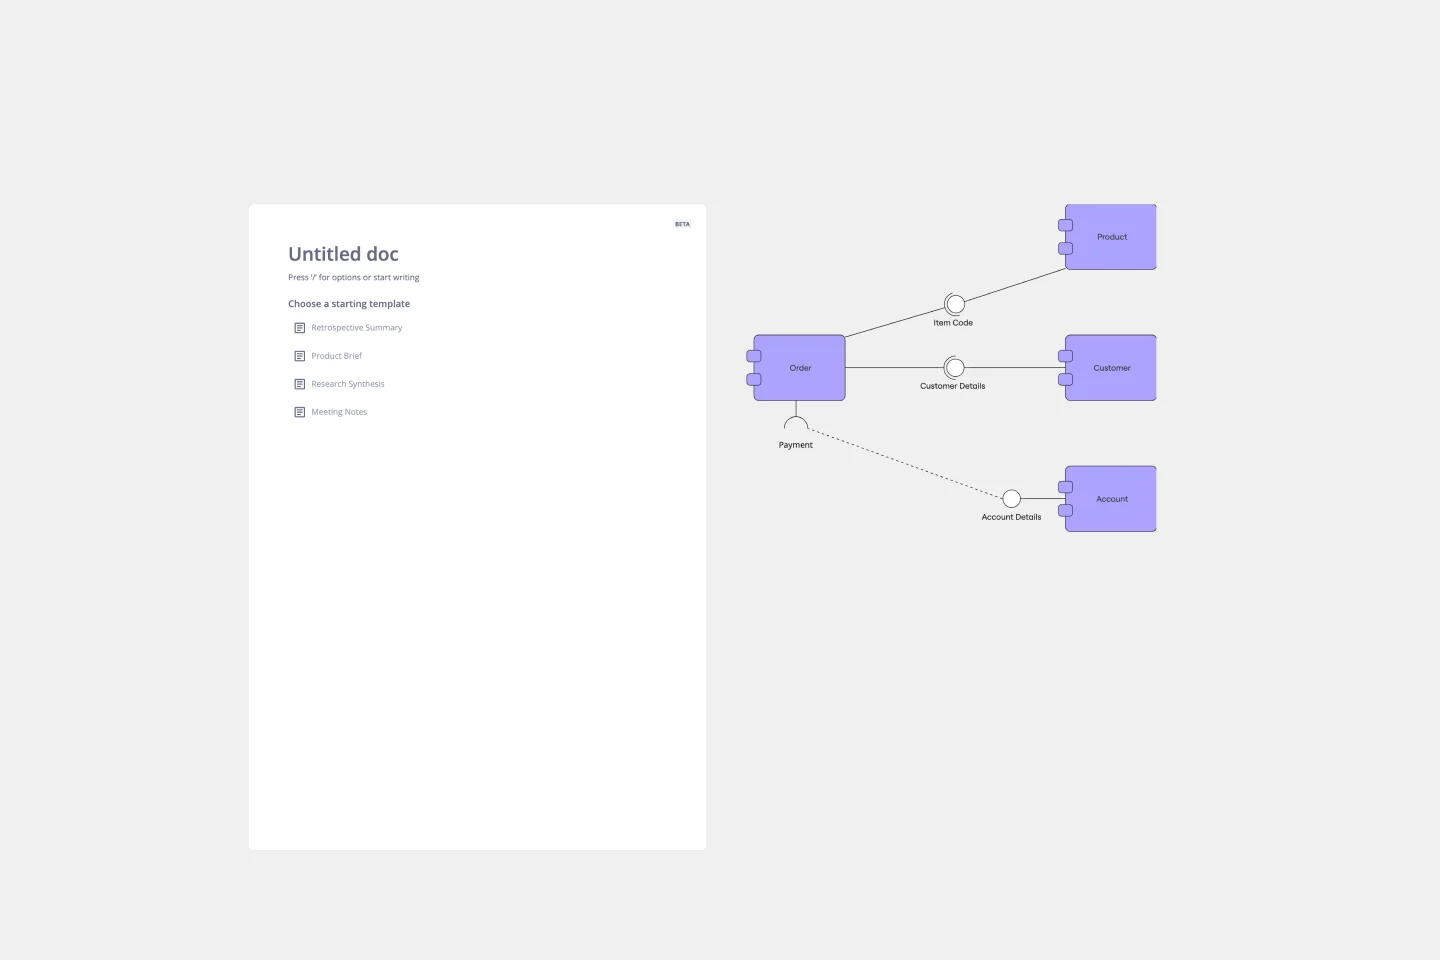
Use our Component Diagram template to show how a system’s physical components are organized and wired together. Visualize implementation details, make sure planned development matches system needs, and more — all in a collaborative environment.
Flowchart Template
Works best for:
Flowcharts, Mapping, Diagrams
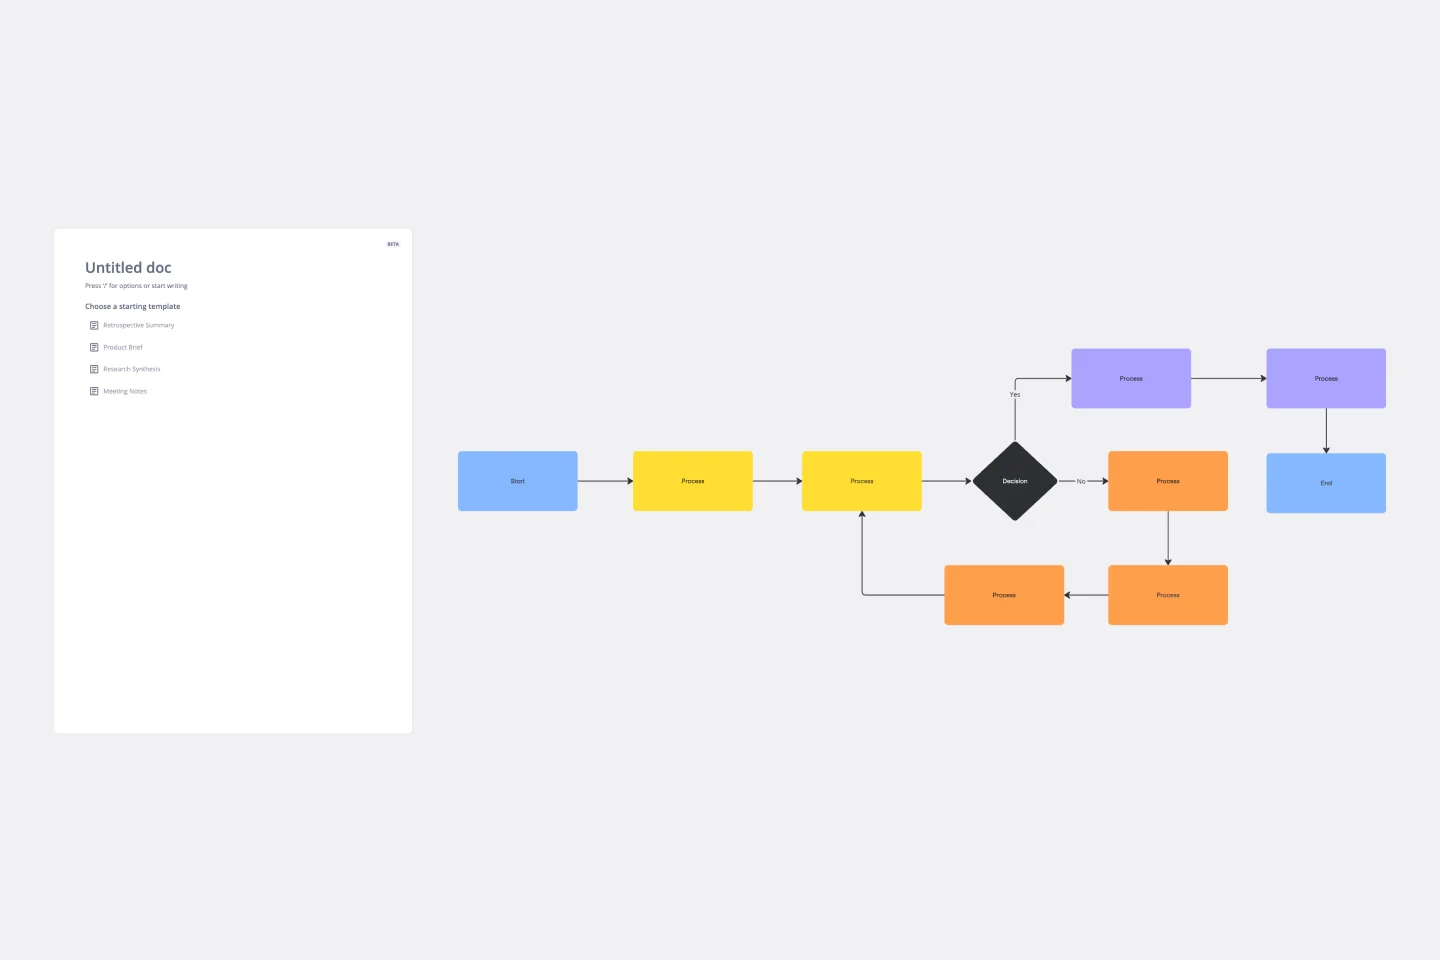
Trying to explain a process or workflow to your team — or just wrap your head around it yourself? Sometimes the best way is to see it, and that’s when you create a flowchart. Using common shapes (generally just ovals, rectangles, diamonds, and arrows), a flowchart shows you the direction a process or workflow goes and the order of steps. Beyond giving you a clear understanding, you’ll also be able to see potential flaws and bottlenecks, which helps you refine and improve your process and create a better product more efficiently.
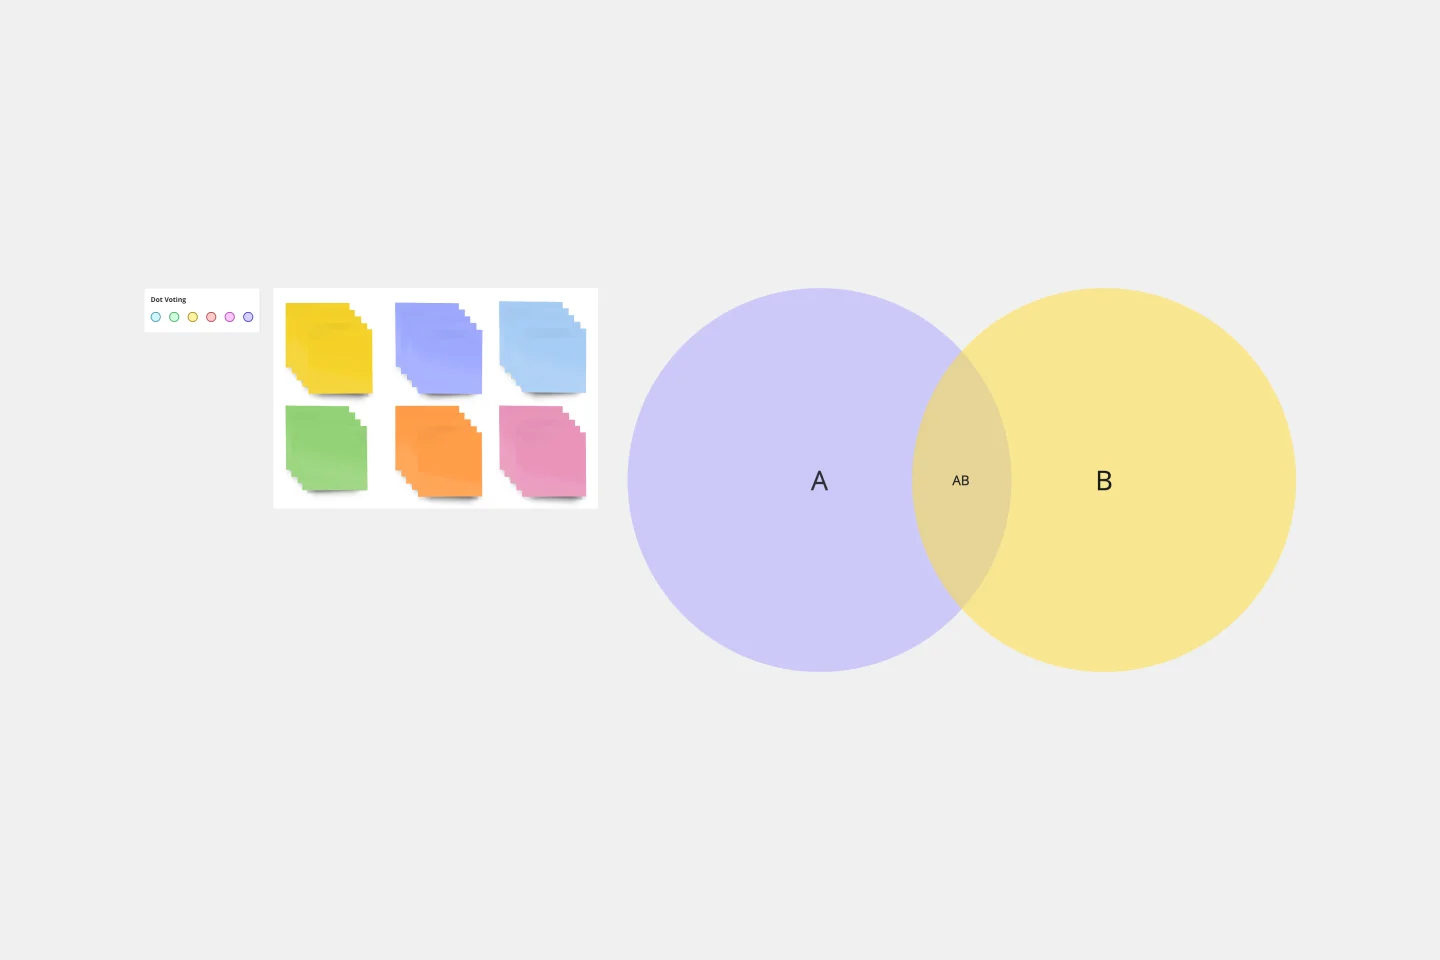
2-Circle Venn Diagram Template
The 2 Circle Venn Diagram Template is a dynamic, intuitive tool designed to represent the logical relationships between two data sets visually. For teams, this template proves valuable in enabling efficient collaboration, clear communication, and shared understanding.
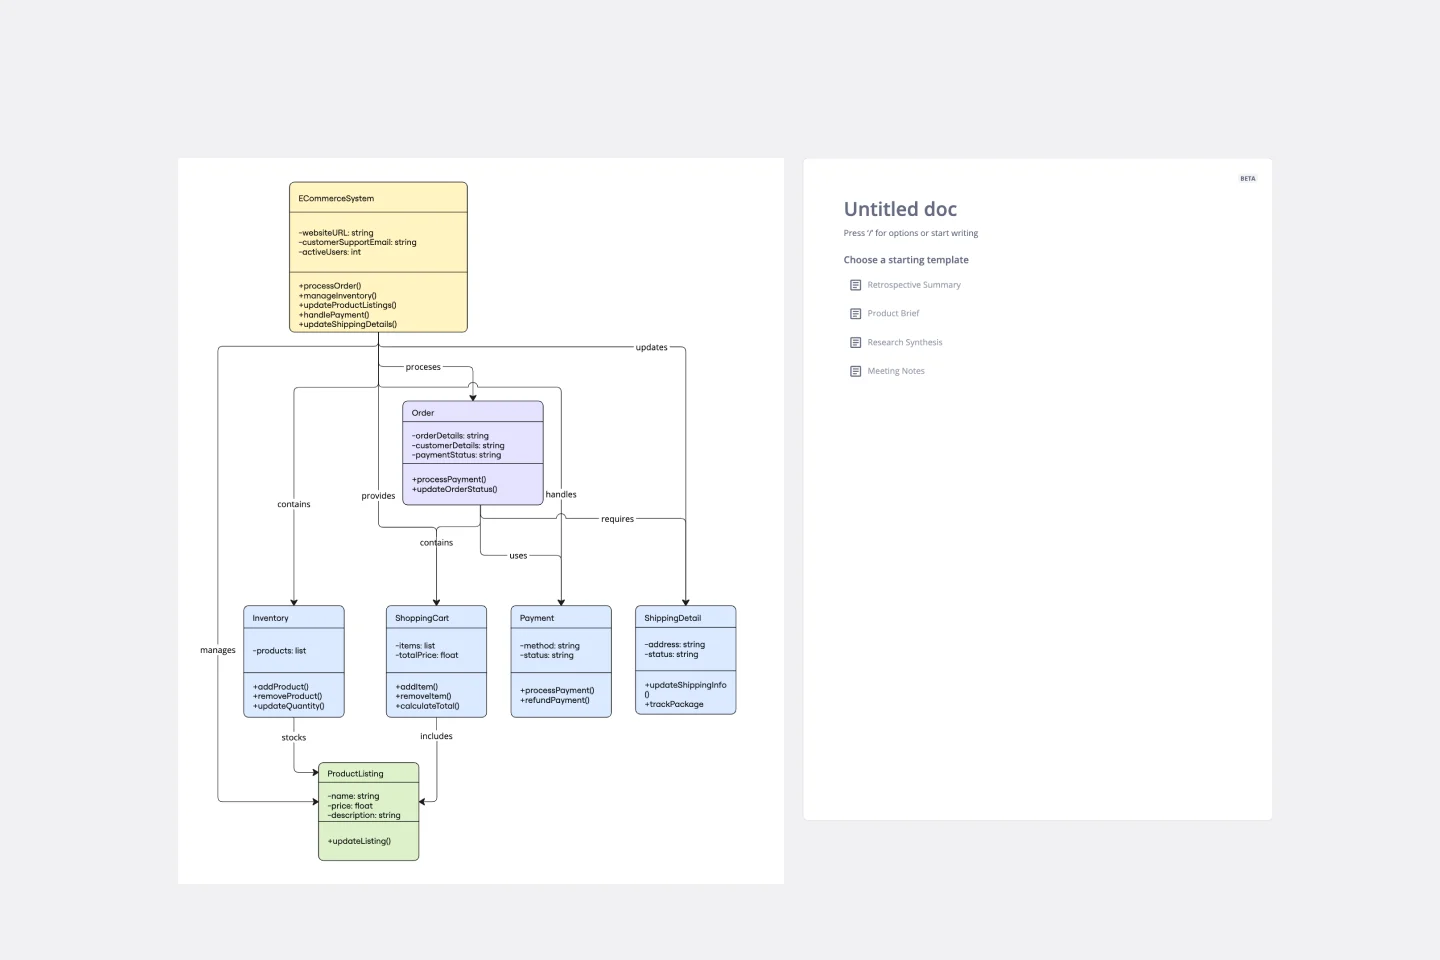
UML Class E-Commerce System Template
Works best for:
UML
The UML Class E-Commerce System Template streamlines the process of creating and visualizing the class structure of an e-commerce system. It provides a comprehensive framework that includes typical online shop features such as product listings, inventory management, shopping carts, orders, payments, and shipping details. This template facilitates a clear understanding of how these elements interact during an online sales transaction, making it an invaluable tool for teams working on e-commerce projects. By using this template, teams can save time, enhance collaboration, and ensure that their system architecture is robust and efficient, ready to adapt to their business's evolving needs.
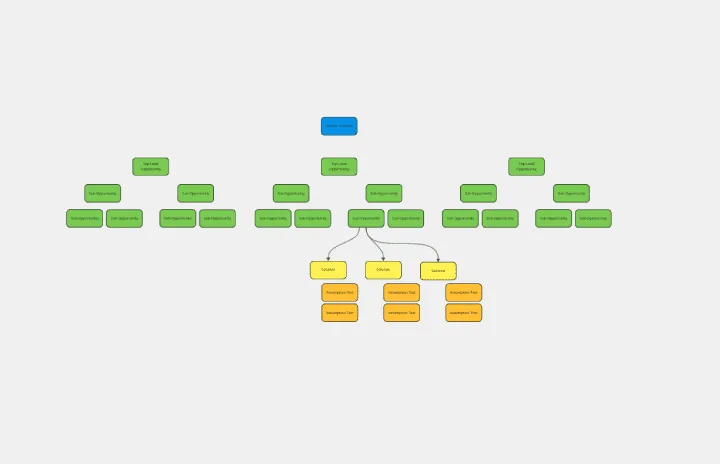
Opportunity Solution Tree
Works best for:
Diagramming
The Opportunity Solution Tree template is a visual tool for identifying and prioritizing opportunities and solutions. It provides a structured framework for mapping customer needs, pain points, and potential solutions. This template enables teams to explore divergent ideas, evaluate alternatives, and focus on high-impact solutions. By promoting customer-centricity and innovation, the Opportunity Solution Tree empowers teams to address market needs effectively and deliver value-driven solutions.