UML State Machine Diagram Template
Visualize the different stages of an object or system using a UML state machine diagram template.
Available on Enterprise, Business, Education plans.
About the UML State Machine Diagram Template
Miro’s UML state machine diagram template is a visual tool you can use to illustrate an object or system’s various states and how it transitions from one to another. State machine diagrams are especially useful for software engineers and system architects looking to understand, design, and communicate complex state transitions and interactions — such as seeing how a web service responds to different requests.
In the next section, we’ll walk you through how to use the UML state machine diagram template.
How to use the UML state machine diagram template
To get started, click on the “use template” button to open the UML state machine diagram template in Miro. Once you’re in, follow these steps to start filling it in:
1. Define states and objects
Define your possible states and the objects that belong to them. Use the shapes in the template to represent each state by double-clicking on the text boxes to edit them.
For example, if you’re creating a behavioral state machine diagram for an elevator system, you could define the states as 'Not activated,' 'Waiting for user input,' and 'Moving up' or ‘Moving down.’
2. Connect states to objects
Once you’ve defined your states, connect them with the correct objects. For example, for a UML state machine diagram representing an elevator system, you’d connect the ‘Move Up’ object to the 'moving up' state and the ‘Move Down’ object to the 'moving down' state.
Use the arrows in the state machine diagram template to link states and objects. Rearrange, duplicate, and remove them as needed.
3. Add transition actions and conditions
Once you connect the states with the objects, fill in the appropriate actions for each state. For example, if your elevator diagram has a state called 'waiting for user input,’ instruct the user on what they should do next. Double-click on the text boxes you want to edit to replace them with your own actions and outcomes.
4. Define guard conditions
Finally, add guard conditions or actions that would trigger your transitions. For example, if an elevator is moving upward and the user presses the 'down' button, this action would trigger the elevator to move back to its 'waiting for user input' state.
In the state machine diagram template, double-click on a textbox along an arrow connecting two states and add the appropriate guard condition.
Miro is also the perfect state diagram maker if you'd prefer to diagram from scratch. Simply use Miro's diagramming tool and UML shape pack.
What is the state machine diagram template for?
A state machine diagram template helps you visualize a software’s different states and how it transitions between them. Take video games, for example. If you’re designing a video game, a state machine diagram will help show how the user will move through the different stages of playing.
Can I build a state machine diagram from scratch?
Absolutely. Miro makes it easy to build a state machine diagram from scratch using our automated diagramming and mapping tools and user-friendly interface. Drag and drop the shapes you need onto your canvas, add connection lines to depict transitions, and use text boxes to add labels.
Does Miro have a free UML diagramming shape pack?
Miro offers plenty of free shape packs to equip you with all the diagramming tools you need — though you’ll need a Business, Enterprise, or Education plan to access our UML shape pack.
Get started with this template right now. Available on Enterprise, Business, Education plans.
Flow Diagrams
Works best for:
Diagramming
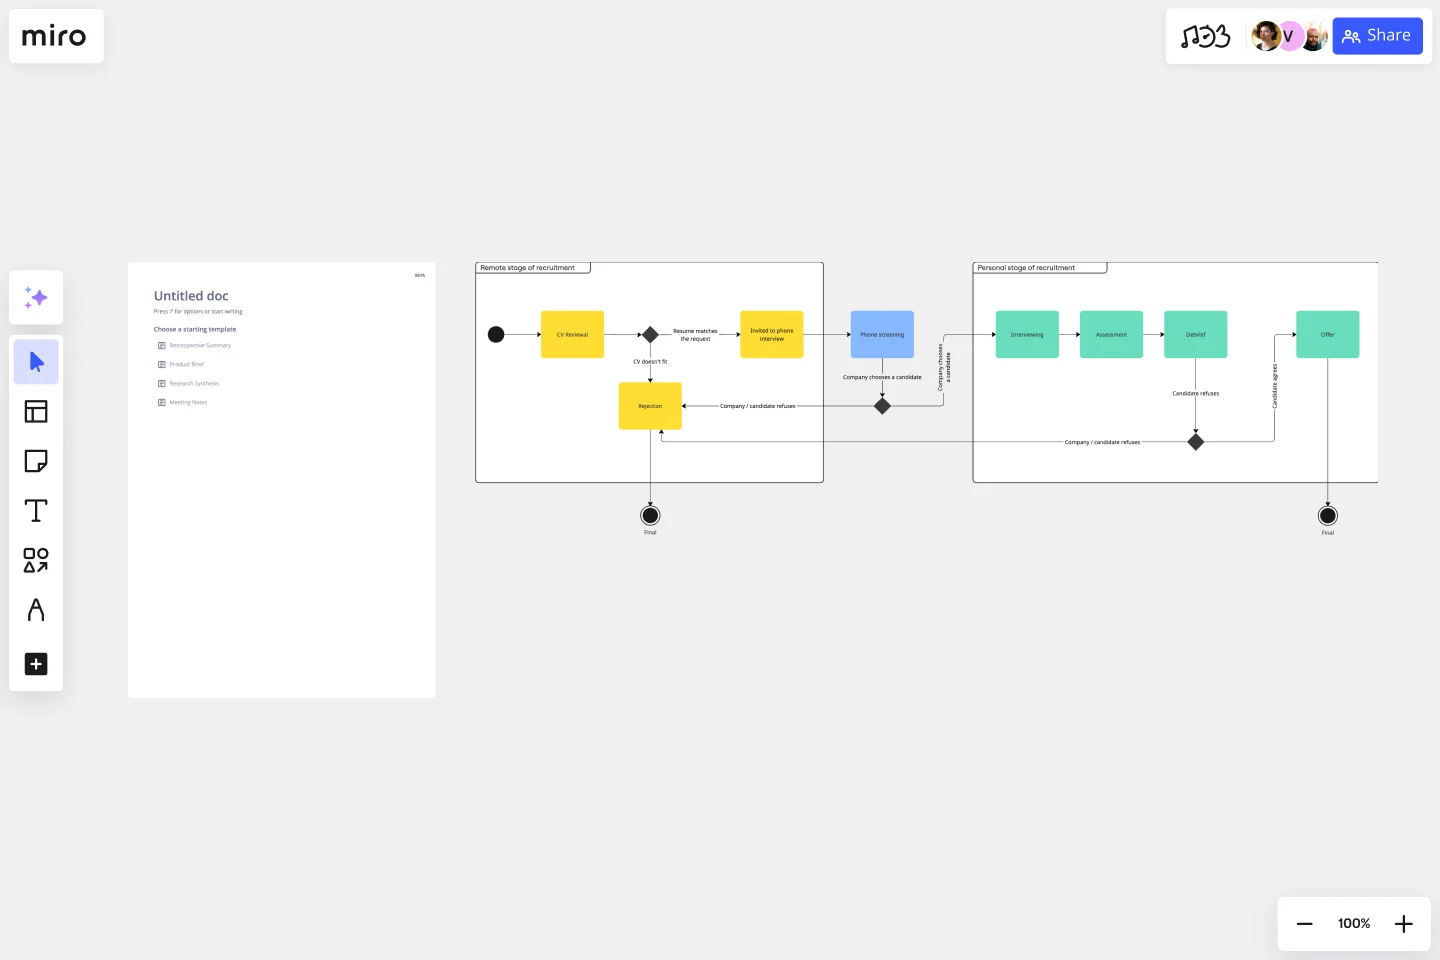
The Flow Diagrams template offers a versatile tool for visualizing processes, workflows, and systems. It provides a range of shapes and connectors for creating flowcharts, process maps, and data flow diagrams. This template enables teams to represent complex systems and processes in a clear and structured manner, facilitating communication and decision-making. By promoting visual clarity and understanding, Flow Diagrams empower teams to analyze and optimize processes effectively, driving efficiency and productivity.
BPMN Template by Pavel Kuksa
Works best for:
Diagramming
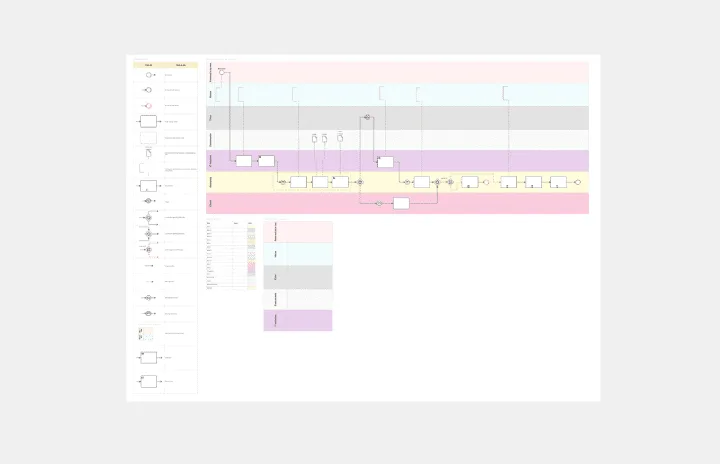
The BPMN Template, elements, and example template offers a comprehensive visual notation for modeling business processes using the Business Process Model and Notation (BPMN) standard. It provides elements for defining process flows, activities, and decision points. This template enables teams to document and analyze business processes systematically, facilitating process optimization and automation. By promoting standardization and clarity in process modeling, the BPMN template empowers organizations to improve efficiency, agility, and compliance in their operations.
App Wireframe Template
Works best for:
UX Design, Wireframes
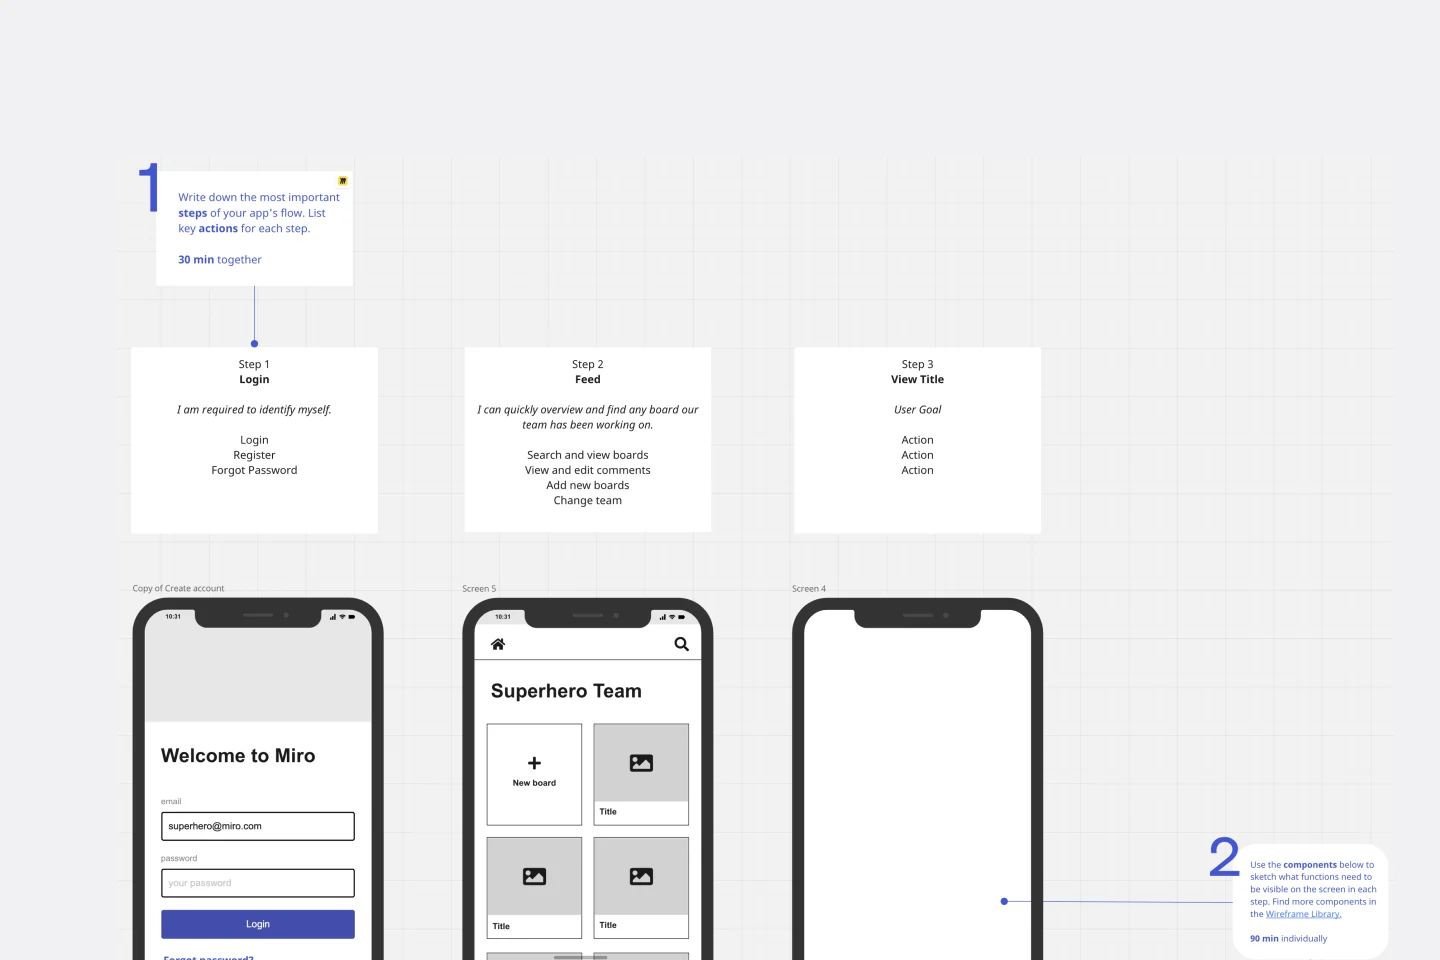
Ready to start building an app? Don’t just imagine how it will function and how users will interact with it—let a wireframe show you. Wireframing is a technique for creating a basic layout of each screen. When you wireframe, ideally early in the process, you’ll gain an understanding of what each screen will accomplish and get buy-in from important stakeholders—all before adding the design and content, which will save you time and money. And by thinking of things in terms of a user’s journey, you’ll deliver a more compelling, successful experience.

Causal Loop Diagrams (1.0)
Works best for:
Diagramming
The Causal Loop Diagrams (1.0) template offers a visual tool for modeling complex systems and understanding the feedback loops that drive behavior. It provides a structured framework for identifying causal relationships, reinforcing loops, and balancing feedback within a system. This template enables teams to analyze system dynamics, anticipate unintended consequences, and formulate effective strategies for intervention. By promoting systems thinking and understanding of interdependencies, Causal Loop Diagrams empower organizations to navigate complexity and drive sustainable change.
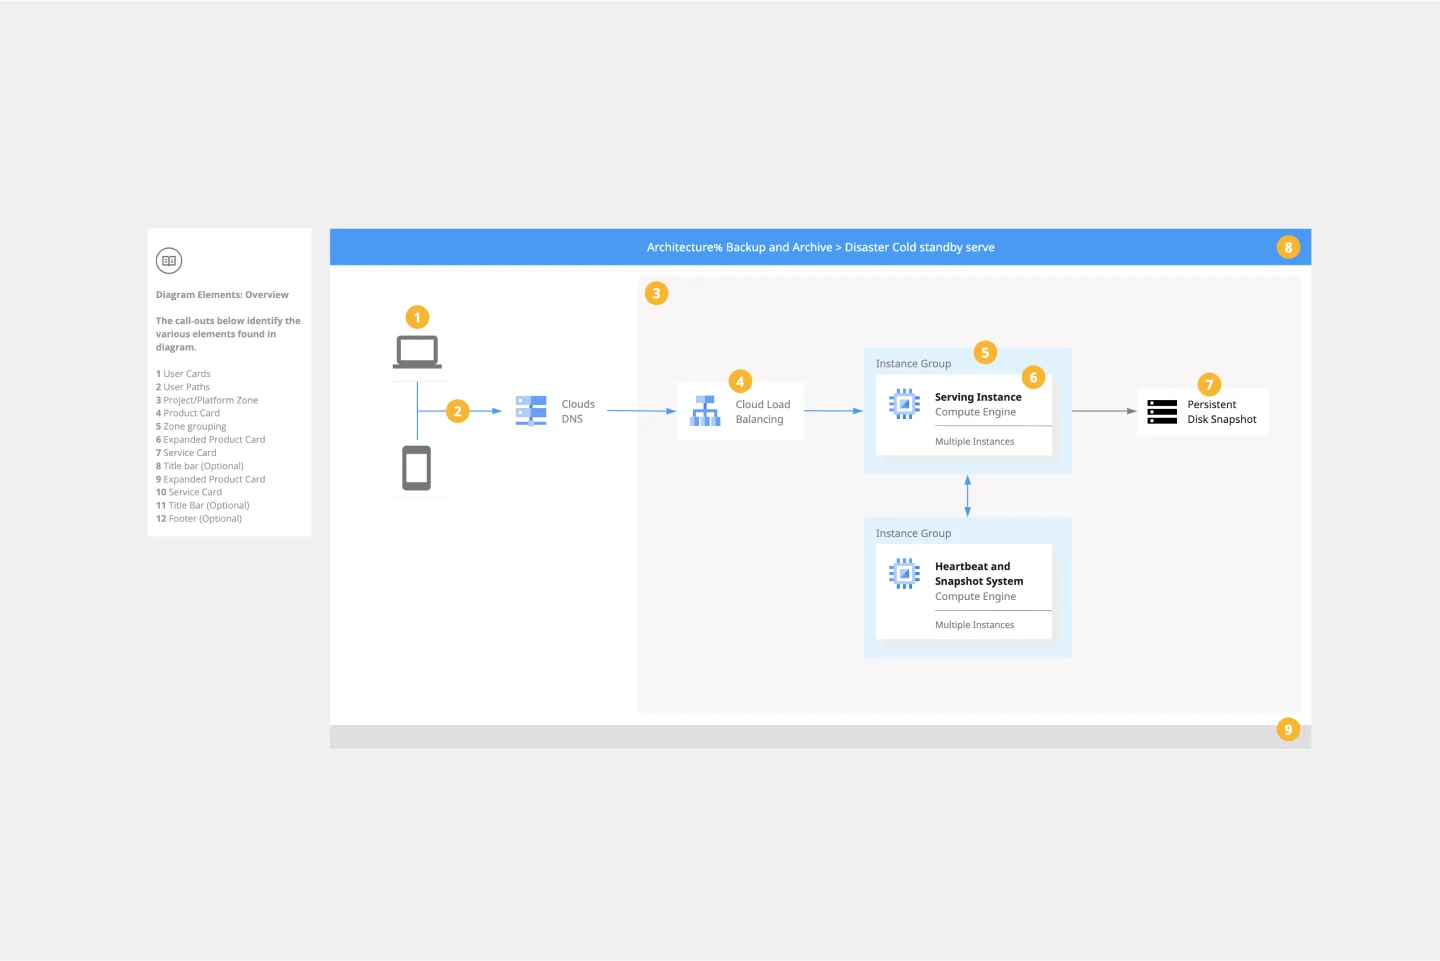
Google Cloud Architecture Diagram Template
Works best for:
Software Development, Diagrams
Use the Google Cloud Architecture Diagram template to clearly visualize the deployment of your application and allow you and your team to optimize processes. The GCP template gives you a great overview of your application architecture, and it helps you to iterate quickly and better manage your application development, deployment, and documentation. Try it out and see if it works for you.
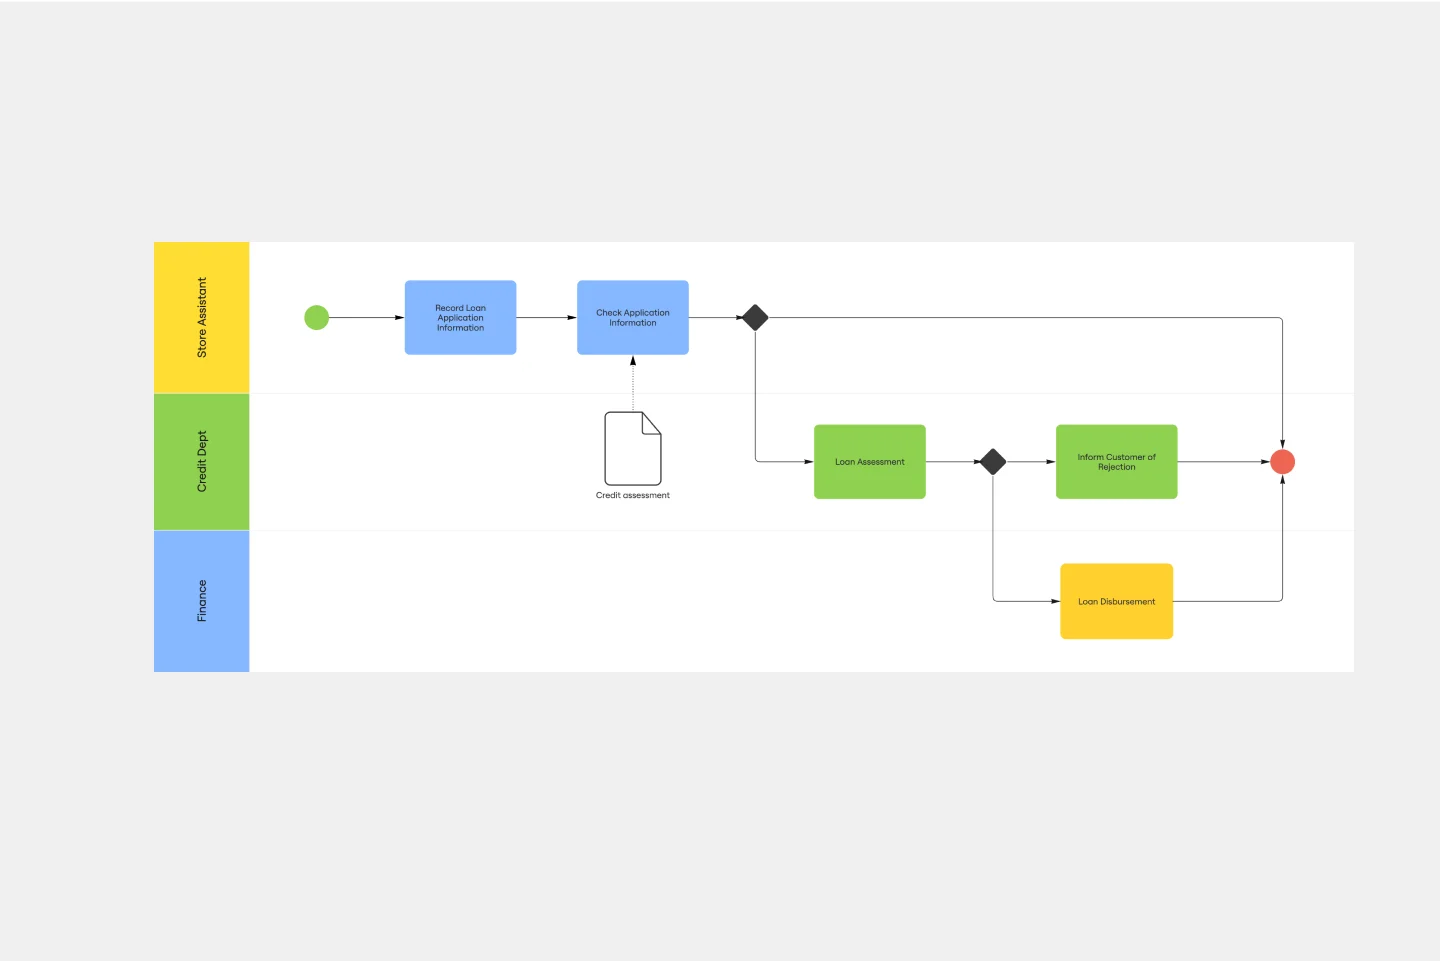
BPMN Template
Works best for:
Mapping, Diagrams, Business Management
The BPMN template helps you track and get an overview of your business processes. It’s a great way to identify any bottlenecks and make your operations more efficient. The BPMN methodology became a universal language when managing business processes, and multiple industries use it as a management tool. Project managers, business analysts, and IT administrators use the BPMN process flow diagram to manage projects, visually communicate the process flows, and keep track of process constraints. Try it for yourself and see improvements in your organization’s agility.