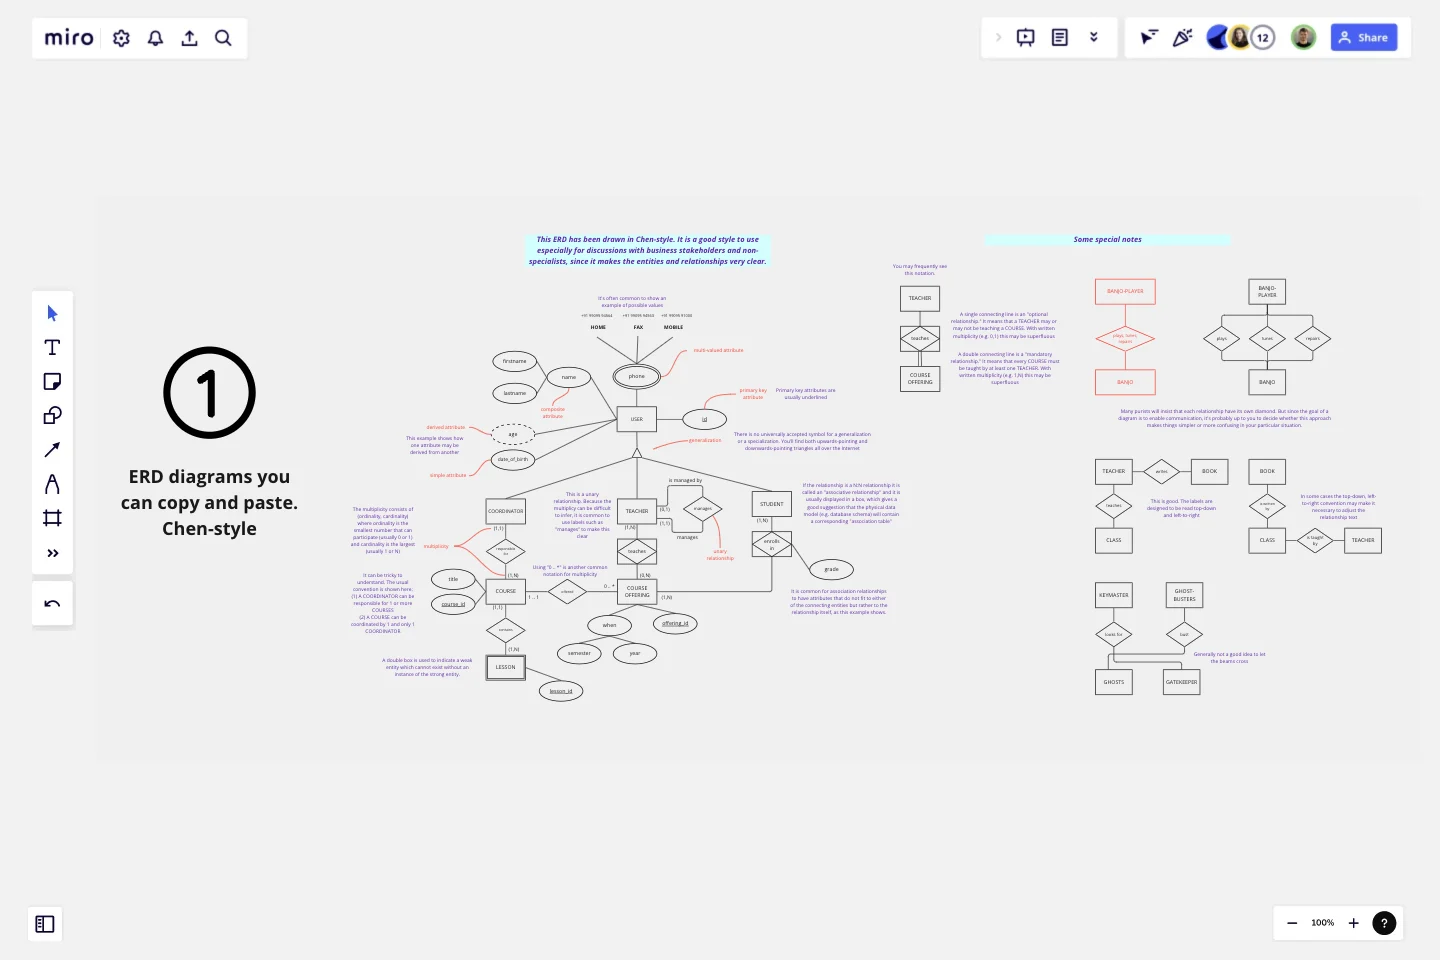
UML ERD Diagram
This template contains a few Entity-Relationship diagrams that you can re-use for your own work.
It also contains a short tutorial about how to create your own ERDs from scratch. Because ERDs are impossible to create without a real-world situation, the diagrams in this template have adopted the well-known teacher/class/student example that is a common example in many ERDs.
Who can use this UML ERD Diagram template
This template is expected to be used mainly by information technology specialists, particularly those with a focus on data
How to use this UML ERD Diagram template
Simply cut-and-paste the diagrams you need into your own boards!
What this UML ERD Diagram helps you accomplish
Instead of re-creating the wheel from scratch, by cutting and pasting ready-to-use ERDs into your own boards, this should considerably speed up your work!
Tips and best practices
Miro has a significant advantage over many modelling tools because of its vector-oriented graphics. You can easily select the shapes and then re-scale them to any size you need.
This template was created by Ken Ritley.
Get started with this template right now.
Project Management Flow Chart
Works best for:
Flowcharts, Diagrams, Mapping
The Project Management Flow Chart template offers a visual tool for planning and managing projects using flowchart diagrams. It provides elements for mapping out project phases, tasks, dependencies, and timelines. This template enables project managers and teams to visualize project workflows, identify critical paths, and track progress effectively. By promoting clarity and transparency, the Project Management Flow Chart empowers organizations to deliver projects on time, within budget, and according to specifications.
Cloudflare RAG Architecture Knowledge Queries Template
The Cloudflare RAG Architecture Knowledge Queries template is a cutting-edge tool designed to streamline the process of diagramming and understanding the intricate architecture of Cloudflare's Retrieval Augmented Generation (RAG) system. This template is a boon for teams aiming to visualize, query, and optimize Cloudflare's infrastructure collaboratively.
UML Class Messaging System Template
Works best for:
UML
The UML Class Messaging System Template streamlines the process of designing and analyzing messaging systems. It allows users to visually map out the structure of a system by detailing classes, their attributes, operations, and the relationships among objects. This template is particularly useful for illustrating the functionality of a messaging system, including the management of text messages, conversation threads, user contacts, notifications, and channels. It offers a clear visual representation of how all these elements interact within the system, making it an invaluable resource for developers, designers, and stakeholders aiming to enhance communication and reduce errors in the development phase.
Cloudflare RAG Architecture Knowledge Seeding Template
The Cloudflare RAG Architecture Knowledge Seeding template in Miro streamlines the sharing and visualization of cloud architecture knowledge, making it ideal for tasks like cloud infrastructure optimization and diagram creation. This template enables straightforward documentation and collaboration, ensuring complex information is accessible to all team members.
DMAIC Analysis Template
Works best for:
Agile Methodology, Design Thinking, Operations
Processes might not seem like the funnest thing to dive into and examine, but wow can it pay off—a more efficient process can lead to serious cost savings and a better product. That’s what DMAIC analysis does. Developed as part of the Six Sigma initiative, DMAIC is a data-driven quality strategy for streamlining processes and resolving issues. The technique is broken into five fundamental steps that are followed in order: Define, Measure, Analyze, Improve, and Control.
Kubernetes Application Template
Works best for:
Software Development, Diagrams
Use the Kubernetes Application template to manage enterprise-ready containerized applications better. You can now get your team more agile when dealing with portability, licensing, and consolidated billing. The Kubernetes Application template allows you to run deployments anywhere, facilitating the management of your applications. Try it out and see if it’s the best fit for you and your team.
