Turtle Diagram for BA
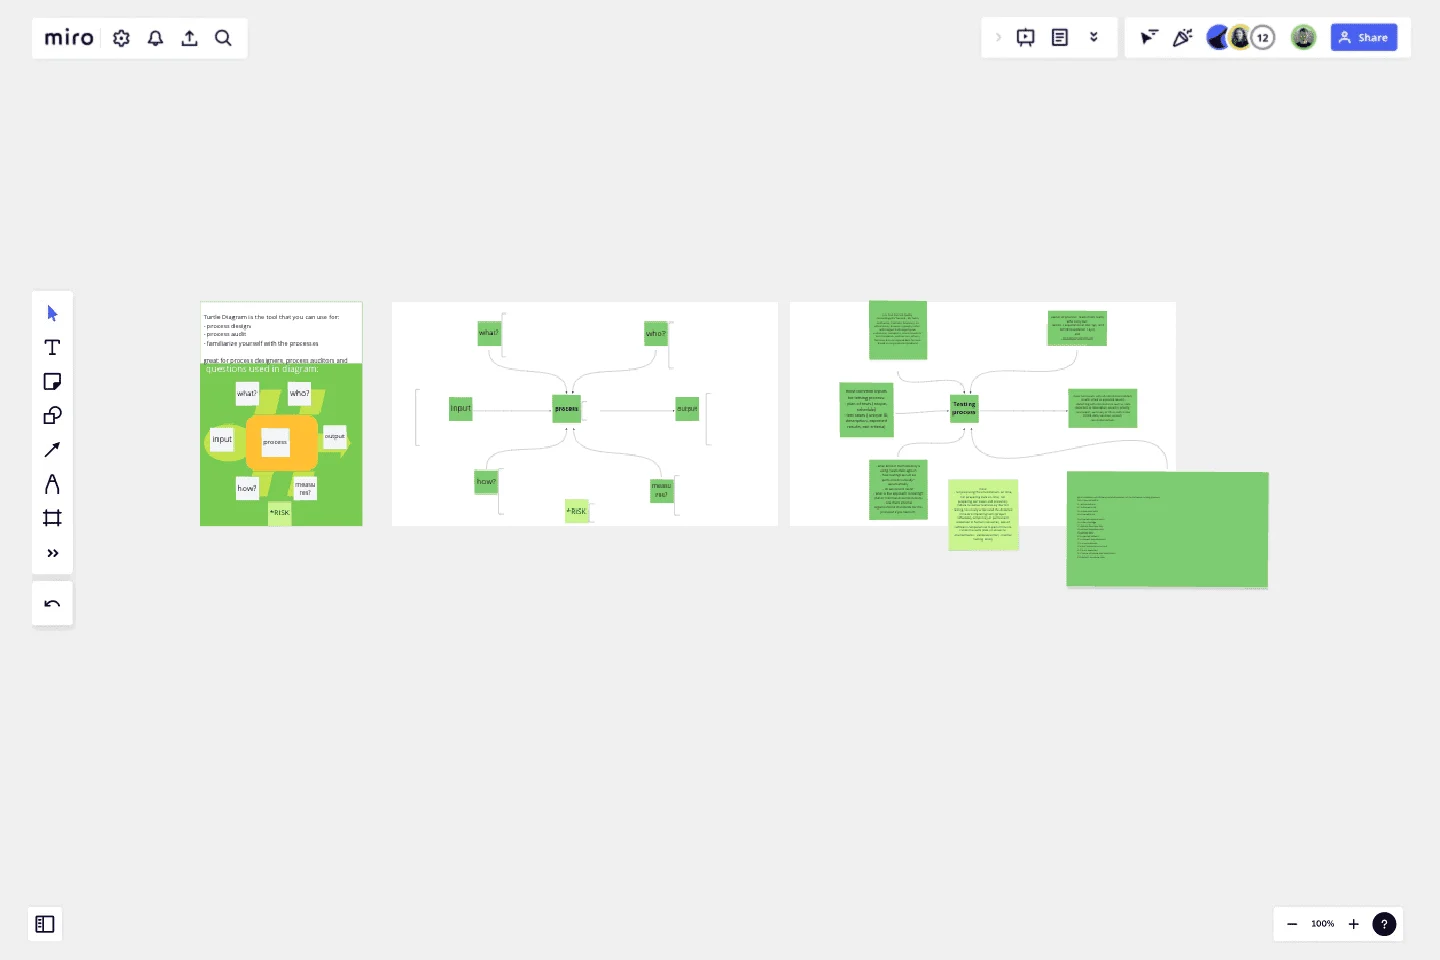
We present the Turtle diagram, which is a great tool for building and managing processes, but also for understanding them.
The tool may be useful for:
requirements elicitation (Business Analysts),
process design ( Process Designers),
brainstorming (Quality Team meetings) and,
audits (internal and external Auditors).
The diagram consists of identifications basic of data such as:
name
input and
output of the process.
Additionally, it allows you to name and assign information related to the process, answering questions such as:
what is necessary to perform process?
who is performing process?
how is the process performing?
measures? what is the goal and what kind of KPIs we use?
In the case of more complex problems or more detailed requirements, a perspective on the risks that may occur in the process can be added.
The prepared diagram includes an explanation, along with a map and description, as well as an example of use.
This template was created by Justina.
Get started with this template right now.
Driver Diagram Template
Works best for:
Diagramming
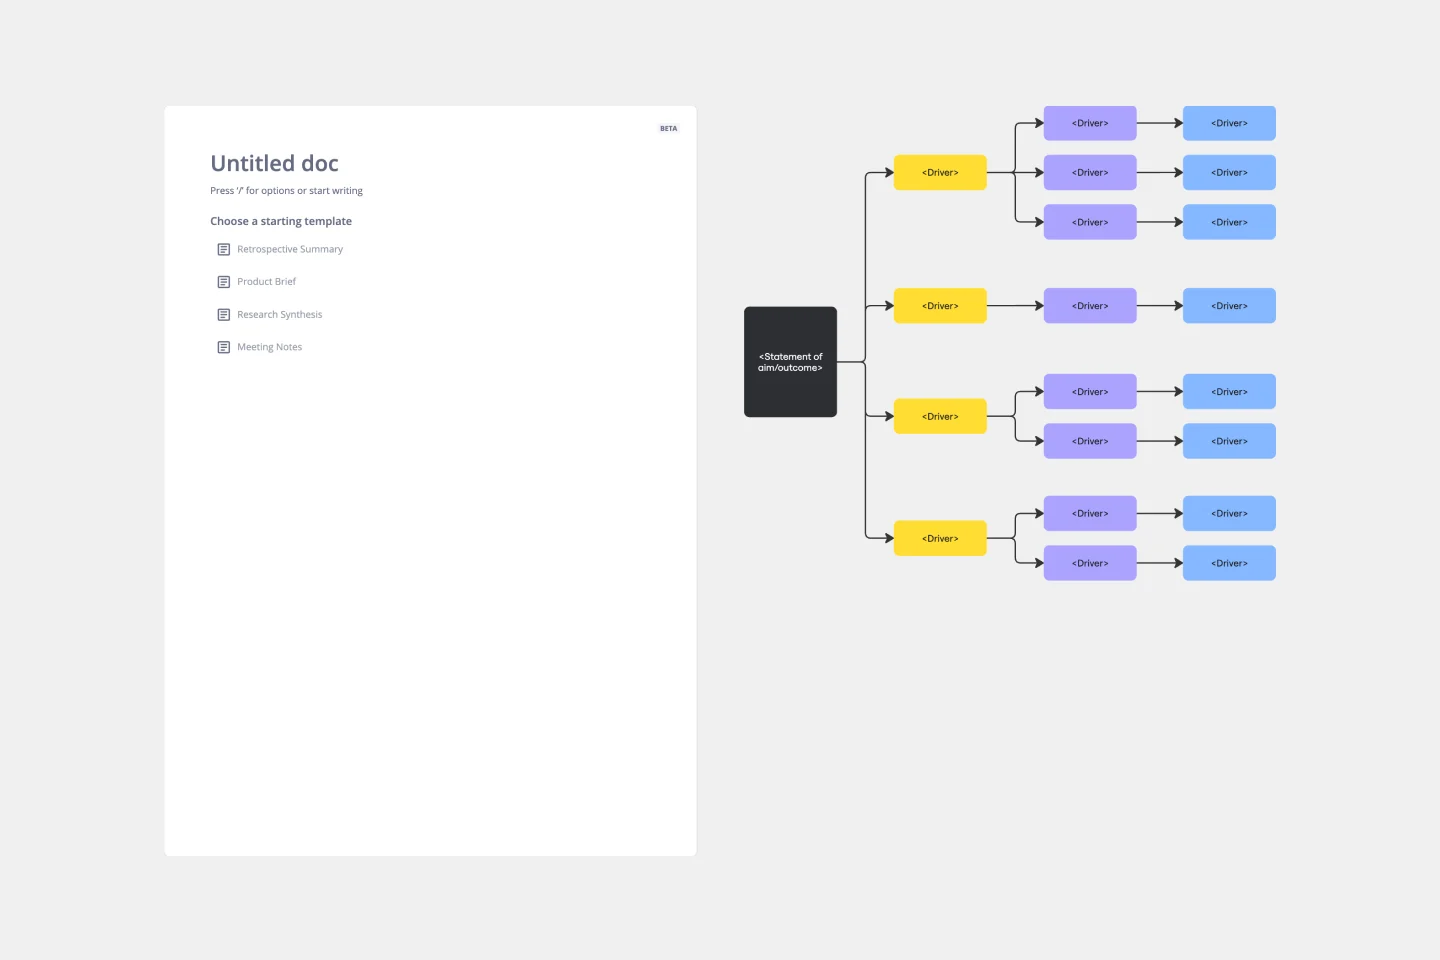
The driver diagram template is a strategic visual tool that helps teams map out their primary objectives and break them down into actionable components. It presents goals, drivers, and specific change ideas in a coherent and interconnected format, ensuring clarity of objective. By doing so, every team member is aligned towards a common endpoint, fostering unified efforts. The visual nature of the template simplifies complex objectives, making it easier for teams to stay on track and measure their progress effectively.
Security Automations for AWS WAF Template
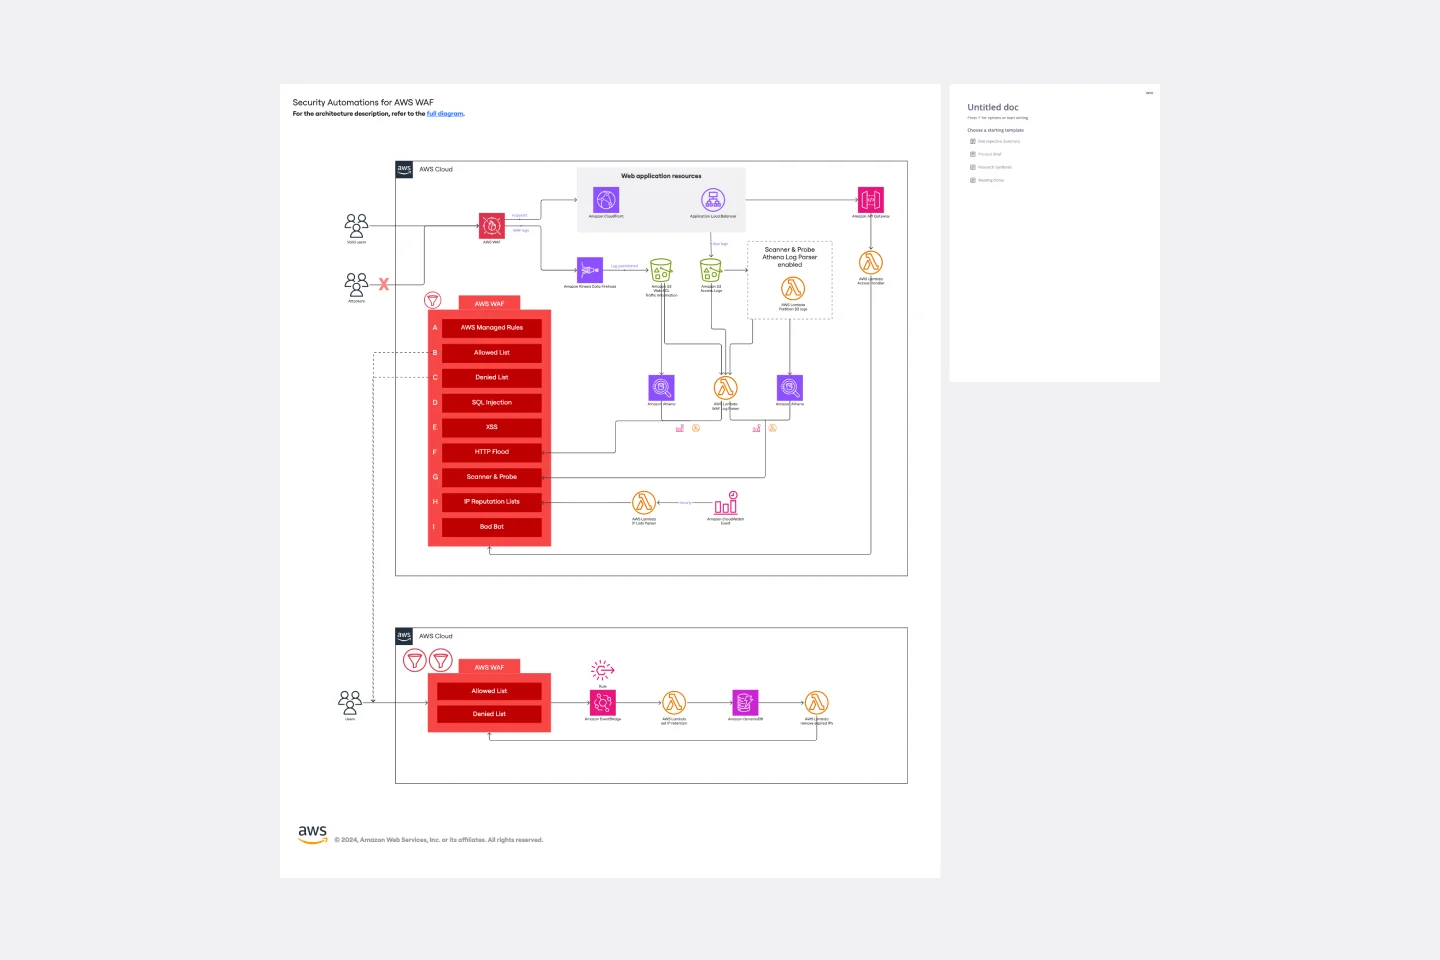
The Security Automations for AWS WAF template is designed to streamline the process of enhancing the security of your AWS applications. It allows teams to collaboratively design, visualize, and refine AWS WAF configurations to protect against common web exploits effectively. This template includes various components such as automated deployment pipelines, instance schedulers, and serverless image handlers, providing a robust framework for managing AWS WAF security automations. By using this template, teams can improve collaboration, achieve a clear visual representation of their AWS WAF configurations, enhance efficiency in managing AWS WAF rules, and customize the template to meet specific application security needs.
Entity–Relationship Diagram (ERD) HR Management System Template
Works best for:
ERD
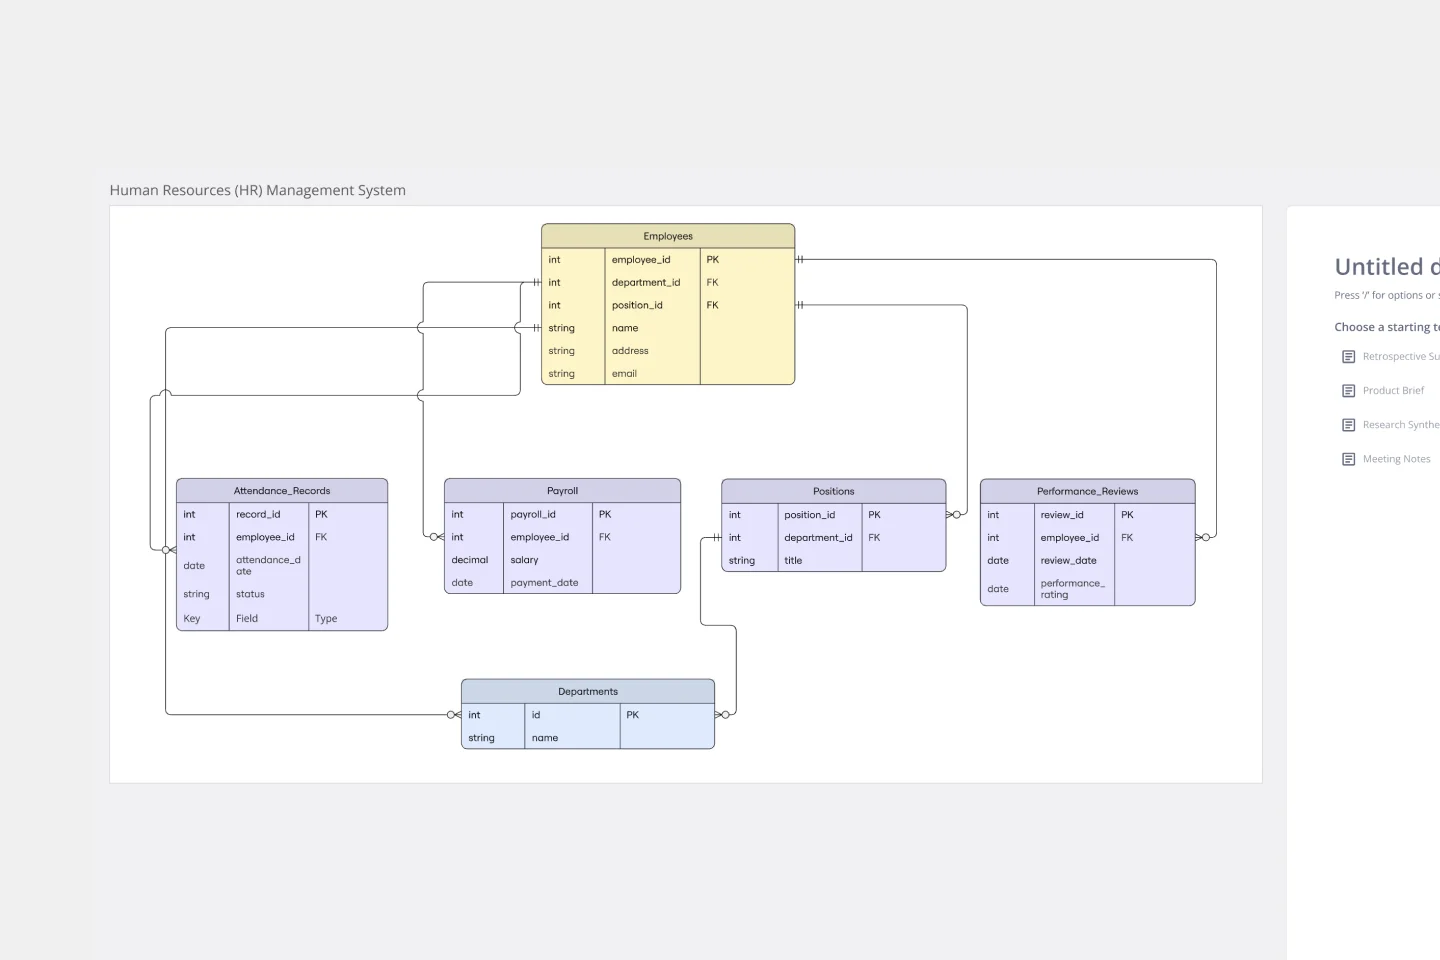
The Entity–Relationship Diagram (ERD) HR Management System Template in Miro is designed to streamline the management of employee-related information and processes within an organization. This template allows for the visualization and organization of complex HR systems, making it easier to understand relationships and processes. It enables users to map out departments, positions, and employee details, including attendance records, payroll, and performance reviews.
Objectives and Key Results (OKRs) Template
Works best for:
Leadership, Strategic Planning, Project Planning
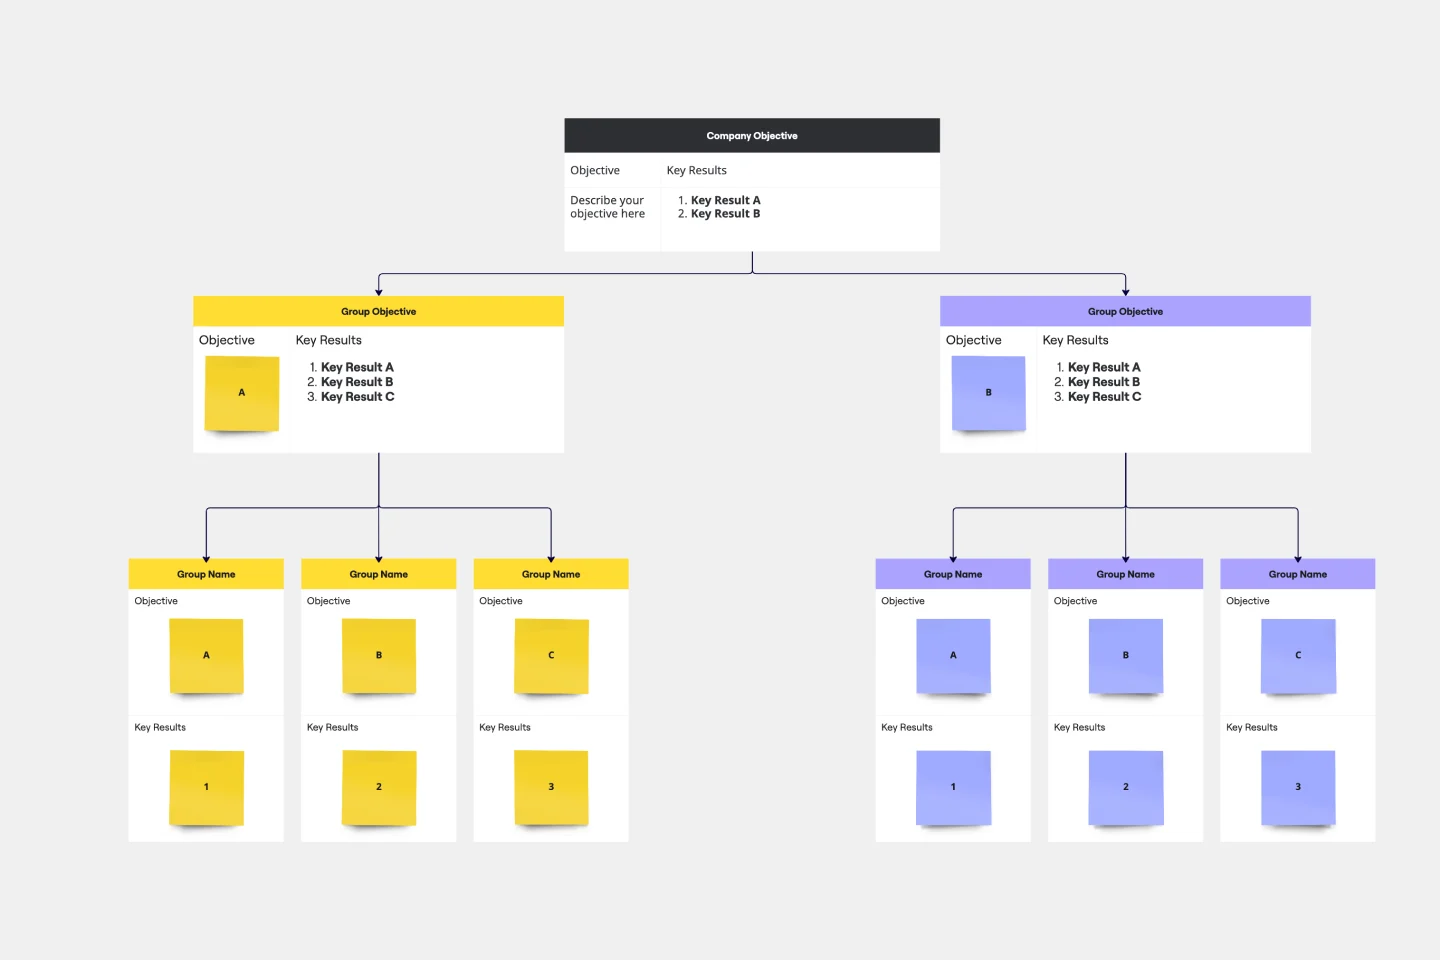
Clarity, focus, and structure — those are the key ingredients to feeling confident in your company’s directions and decisions, and an OKR framework is designed to give them to you. Working on two main levels — strategic and operational — OKRs (short for objectives and key results) help an organization’s leaders determine the strategic objectives and define quarterly key results, which are then connected to initiatives. That’s how OKRs empower teams to focus on solving the most pressing organizational problems they face.
Website Flowchart Template
Works best for:
Flowcharts, Mapping, User Experience
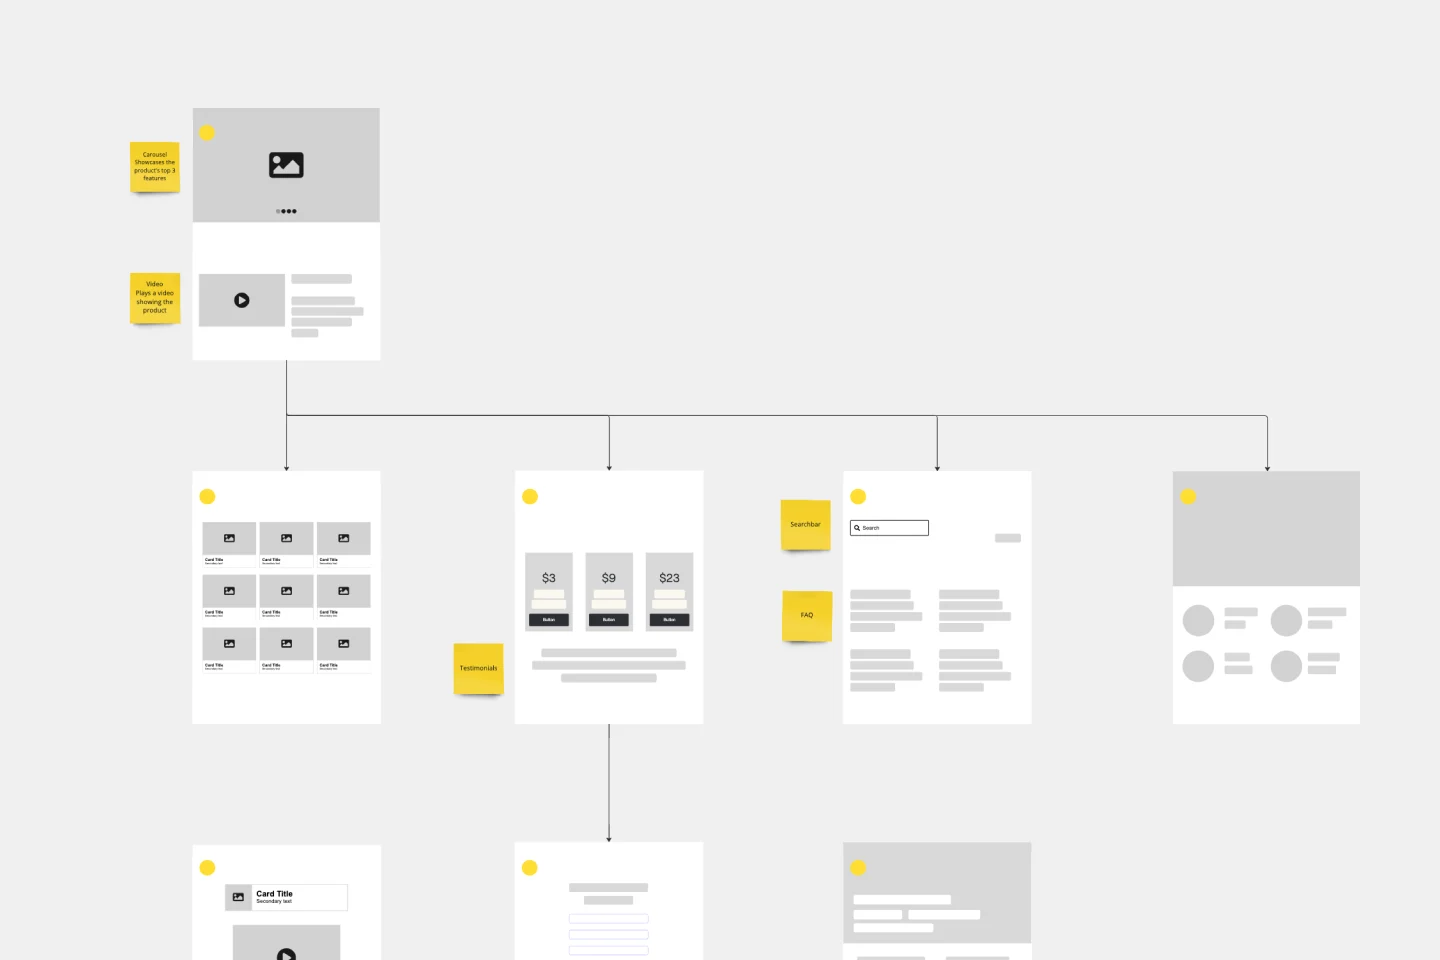
A website flowchart, also known as a sitemap, maps out the structure and complexity of any current or future website. The flowchart can also help your team identify knowledge gaps for future content. When you’re building a website, you want to ensure that each piece of content gives users accurate research results based on keywords associated with your web content. Product, UX, and content teams can use flowcharts or sitemaps to understand everything contained in a website, and plan to add or restructure content to improve a website’s user experience.
Logic Model Template
Works best for:
Diagramming
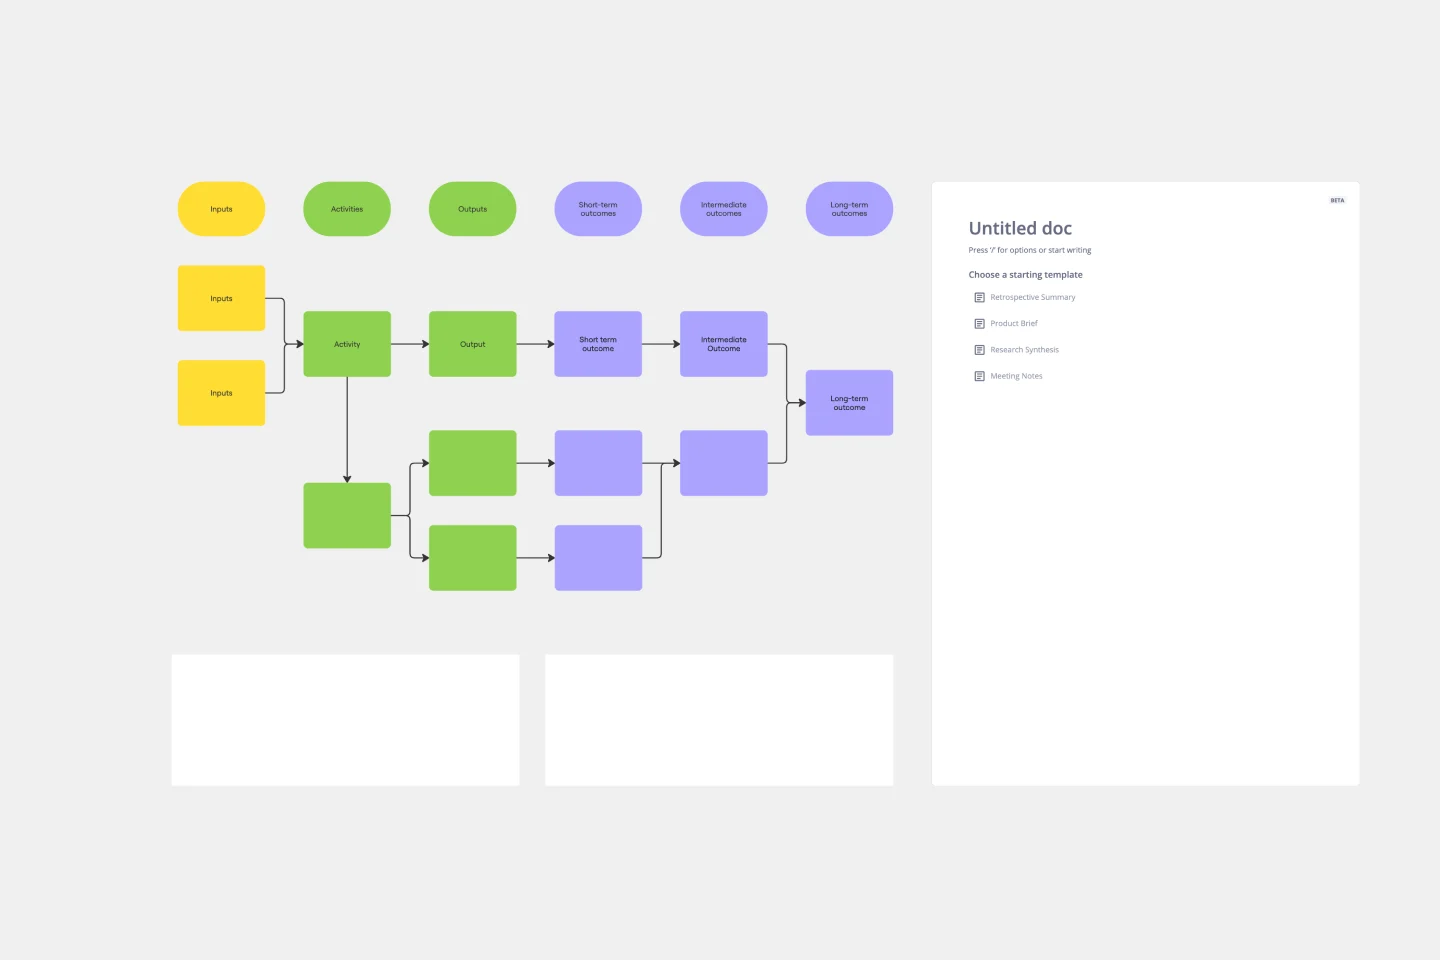
The logic model template is a strategic visual tool designed to delineate the relationship between a program's inputs, activities, outputs, and outcomes. By providing a clear and comprehensive map of the project lifecycle, stakeholders can swiftly grasp the intricate connections within a given initiative. One standout benefit of this template is its ability to enhance clarity: by visually representing the transformation of resources into anticipated results, teams can ensure more efficient and targeted use of their resources, thus maximizing the potential for success in their endeavors.