Turtle Diagram Template
Visualize complex processes, align team understanding, and optimize for operational excellence with the turtle diagram template.
About the Turtle Diagram Template
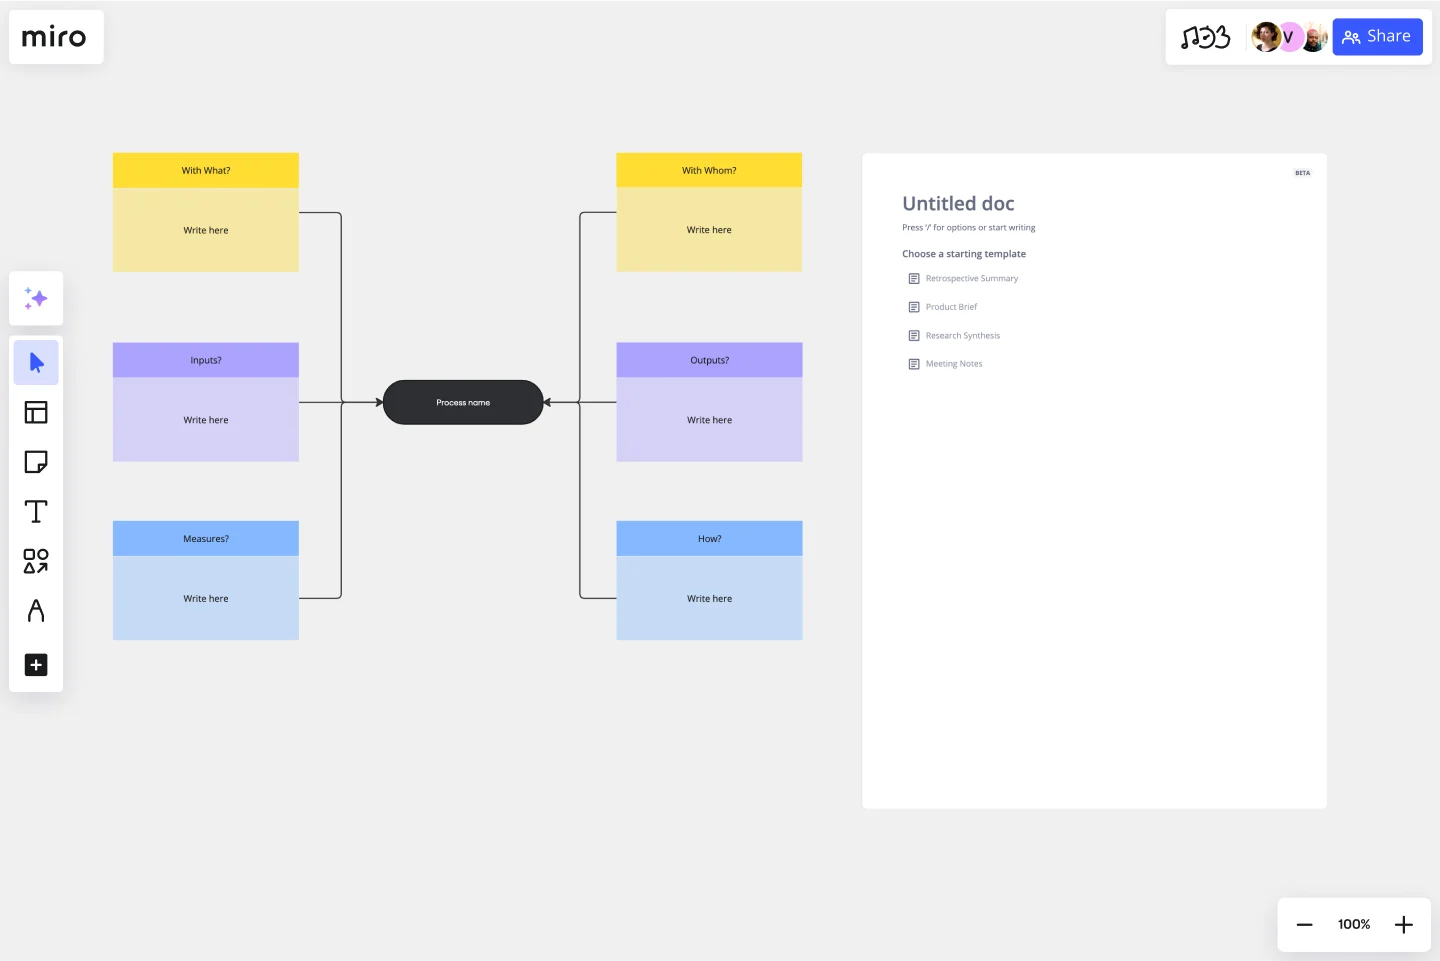
The Turtle Diagram Template is a valuable asset for visualizing processes in a structured and clear format. It's designed to study and organize the various components of a process into distinct, easy-to-understand parts, mirroring the anatomy of a turtle to help in visualization and analysis. Here's a breakdown of each section of the template:
With What: This section explores the tools, materials, and resources needed to complete the process. It's where the necessary equipment or software is identified.
With Whom: Identifies the personnel or roles responsible for executing the process. It could include specific teams, departments, or external partners.
Inputs: Lists the elements required to start the process. These catalysts drive the process forward, such as raw data, materials, or initial requests.
Outputs: Describes the end results or products that emerge from the process. These are the deliverables or outcomes that are expected once the process is complete.
Measures: Outlines the metrics or KPIs used to evaluate the success of the process. It includes the standards and criteria that the outputs are measured against.
How: Explains the methodologies, procedures, and instructions involved in the process. This section provides a step-by-step narrative of how the process is executed, including any methods or best practices that are followed.
By breaking down the process into these key components, the Turtle Diagram Template offers an in-depth understanding of how a process is built and how it should operate, paving the way for more efficient process management and continuous improvement.
How to use the turtle diagram template in Miro
To use the Turtle Diagram Template effectively:
Customize each section: Input data specific to your process into various template sections by double-clicking the text boxes.
Edit effortlessly: Change the diagram through intuitive drag-and-drop features, allowing seamless adjustments to suit your process depth.
Expand and connect: Use automated diagramming capabilities to expand your template and for a more detailed process network.
Enrich with artifacts: Drag and drop various artifacts onto your board, such as images and documents, for a richer contextual understanding of the process.
Why should you use a turtle diagram template?
Clarified process understanding: Breaks down complex processes into manageable parts for better clarity.
Enhanced communication: Simplifies the conveyance of process intricacies across teams and stakeholders.
Effective training resource: Acts as an educational tool for training new employees on existing processes.
Continuous improvement: Identifies areas for improvement by highlighting inefficiencies or bottlenecks within a process.
Compliance and documentation: Aids in meeting quality standards and regulatory requirements by providing clear documentation of processes.
If you prefer to start from scratch, Miro's diagram maker is easy to use and comes with a wide range of diagramming shapes in Miro's extensive library, so you'll find just what you need.
Can the turtle diagram template handle multiple processes at once?
While it's designed to map out individual processes for clarity, users can link multiple turtle diagrams to represent larger, interconnected systems.
Is previous knowledge required to use the Turtle Diagram Template?
No previous knowledge is necessary. The template is designed for ease of use, allowing anyone with a basic understanding of their process to begin mapping immediately.
How detailed can the input and output sections of the diagram be?
The input and output sections can be as detailed as required. Users have the flexibility to expand these sections to include all relevant details, ensuring a comprehensive process overview.
Are turtle diagram templates suitable for any industry?
Yes, these templates are versatile and can be adapted to suit the needs of any industry that benefits from detailed process analysis and quality management.
Get started with this template right now.
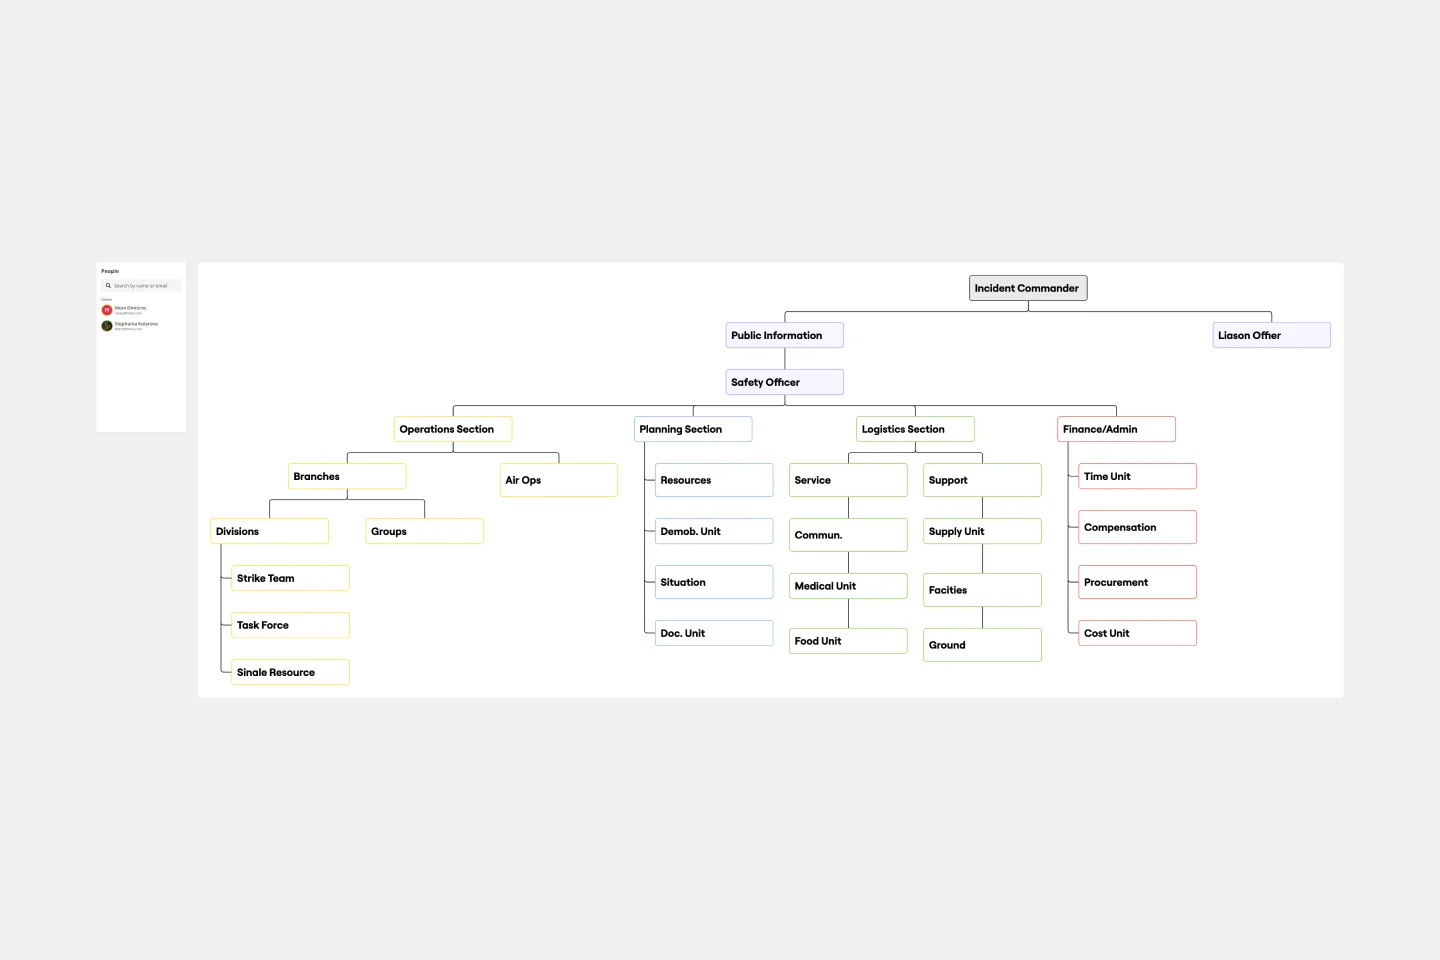
ICS Org Chart Template
Our carefully crafted ICS Org Chart Template is an invaluable tool designed to clearly represent the hierarchical structure of the Incident Command System (ICS). It simplifies the complex web of roles, responsibilities, and chains of command within the ICS, providing a structured blueprint for both experienced professionals and those new to the system. The template's most notable benefit is its ability to foster immediate understanding, bridging the gap between intricate organizational structures and the teams navigating them. Teams that use this template can ensure that everyone is aligned, understands their role, and collaborates efficiently, thereby reducing potential bottlenecks and misunderstandings.
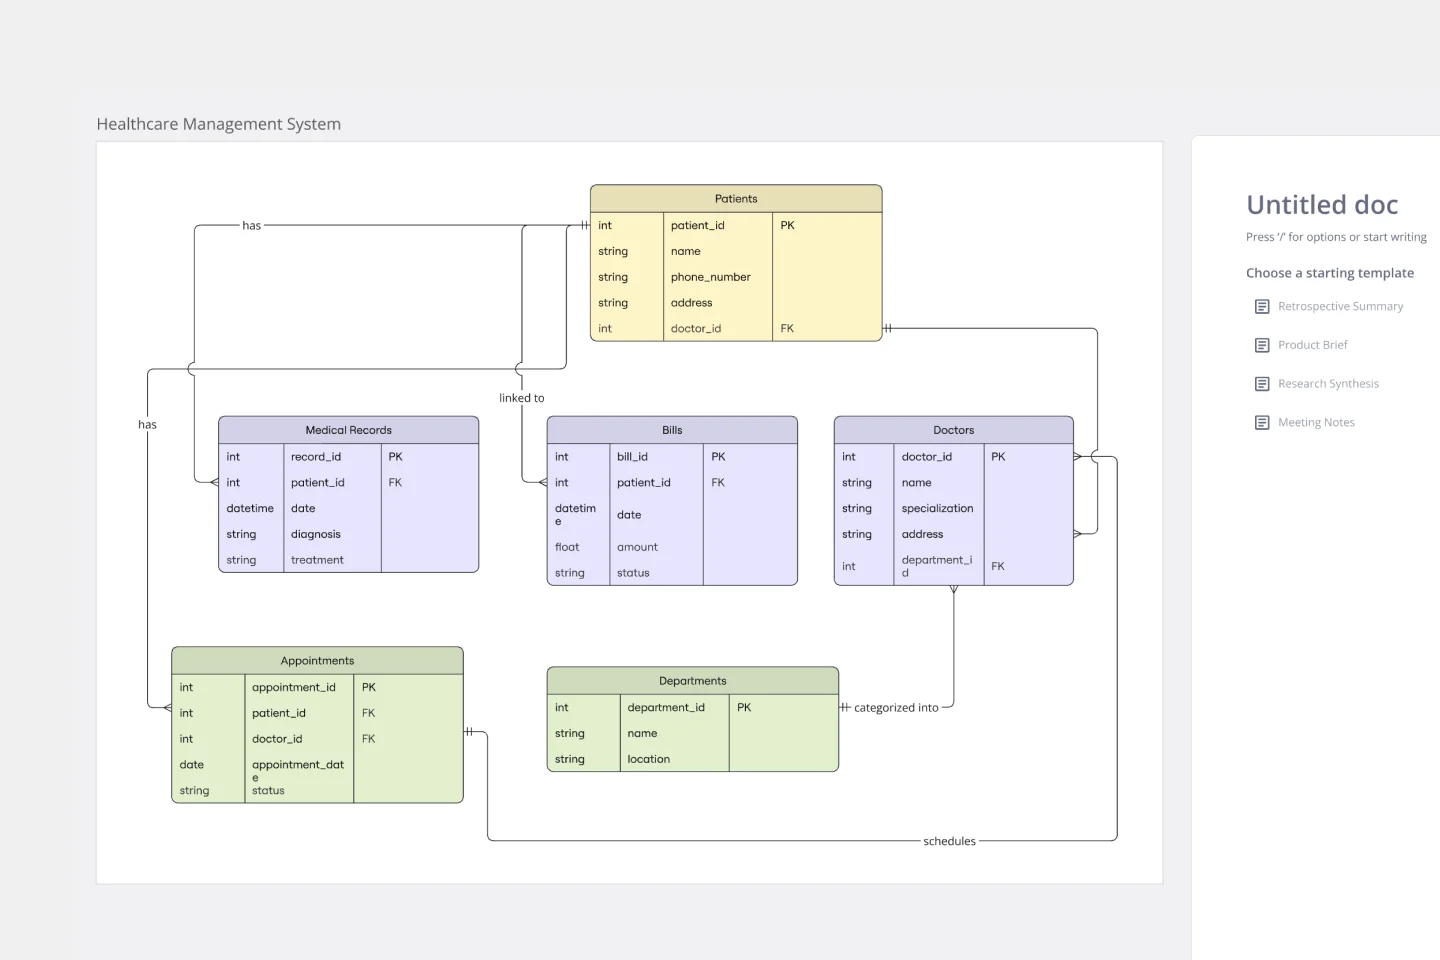
ERD Healthcare Management System Template
Works best for:
ERD
The ERD Healthcare Management System Template streamlines the process of creating and managing entity-relationship diagrams for healthcare management systems. This template helps users visualize the complex relationships between different entities such as patients, healthcare providers, medical records, and billing information. It offers a flexible and customizable framework that can be adapted to fit the specific needs of any healthcare management system, ensuring clarity and efficiency in system design and database structure.
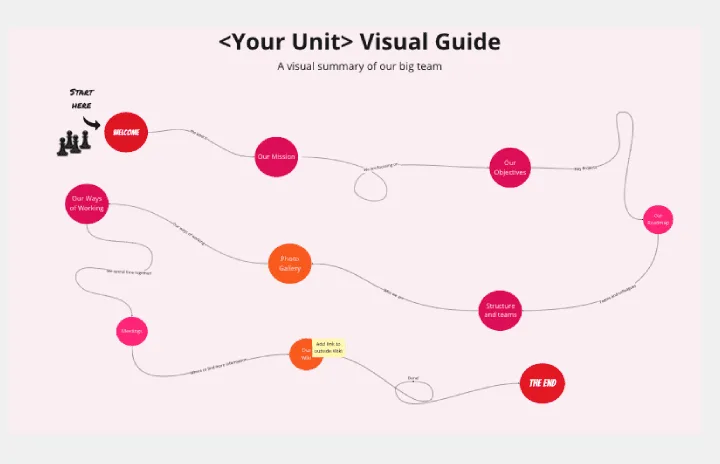
Org Unit Visual Guide
Works best for:
Org Charts, Operations, Mapping
Org Unit Visual Guide template offers a visual reference for understanding organizational units and their relationships. By mapping out departments, teams, and reporting lines, this template enhances clarity and transparency. With customizable features for adding annotations and descriptions, this template facilitates communication and alignment across organizational units.
UML Sequence E-commerce Checkout Template
Works best for:
UML
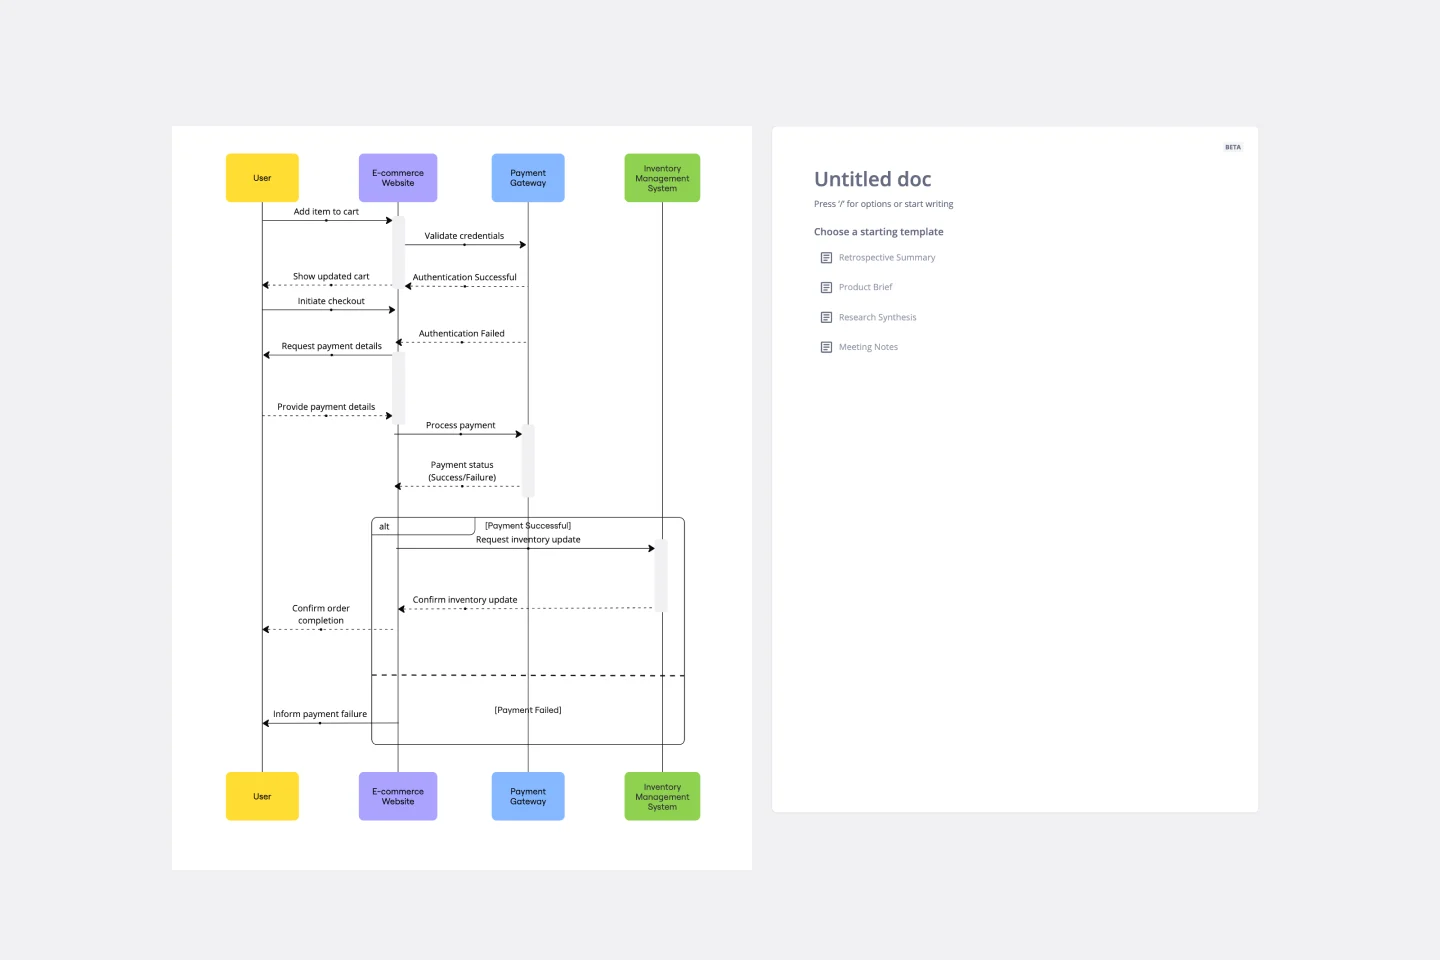
The UML Sequence E-commerce Checkout Template in Miro is a versatile tool for visualizing and analyzing e-commerce checkout processes. It provides a step-by-step visual representation of system interactions, is highly customizable, supports real-time collaboration, and is suitable for various e-commerce platforms. It serves as an efficient documentation tool, fosters team collaboration, and contributes to a more streamlined checkout experience for customers.
Insightful Venn
Works best for:
Venn Diagram
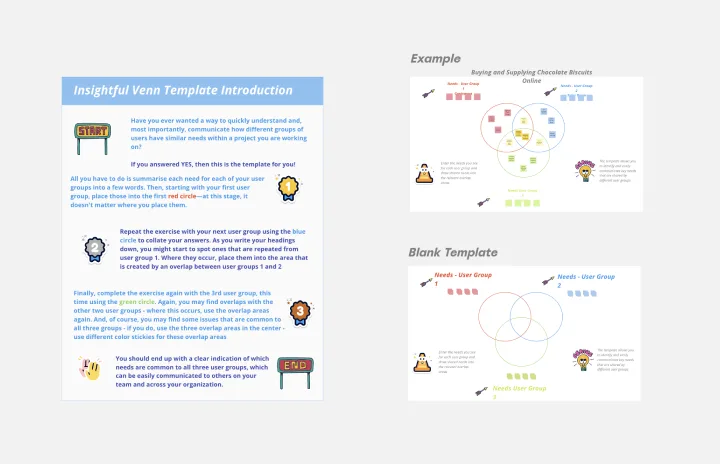
Discover insights and visualize data relationships with the Insightful Venn template. This tool helps you compare multiple datasets, identify intersections, and understand unique and common elements. Use it for data analysis, research, and presentations to communicate complex information effectively. Perfect for analysts, educators, and researchers aiming to convey data-driven insights visually.
Force Field Analysis Template
Works best for:
Diagramming, Strategic Planning
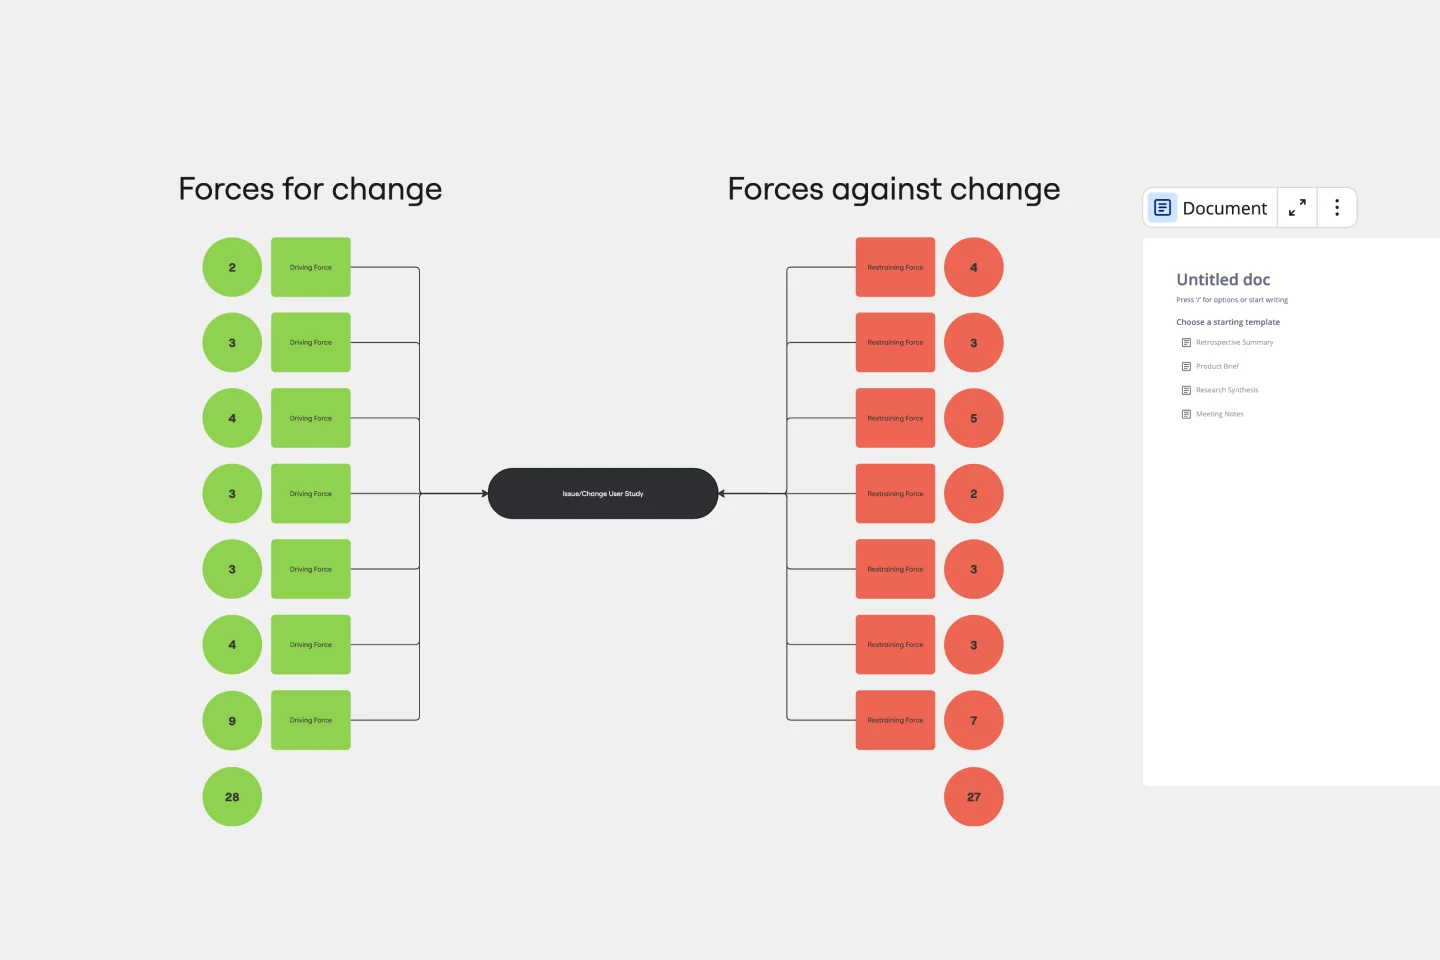
A Force Field Analysis Template is a powerful tool that helps teams identify and analyze the forces supporting or hindering progress toward a specific change or goal. This template provides a visual space where you can brainstorm and plot out 'driving forces' that push objectives forward and 'restraining forces' that prevent advancement, all on a single, intuitive board. One of the primary benefits of utilizing the Force Field Analysis template is that it fosters a shared understanding among team members. By visually mapping out and discussing each force, teams can prioritize efforts, build consensus on the central issues to tackle, and collaboratively devise strategic plans to strengthen positive influences while reducing negative ones.