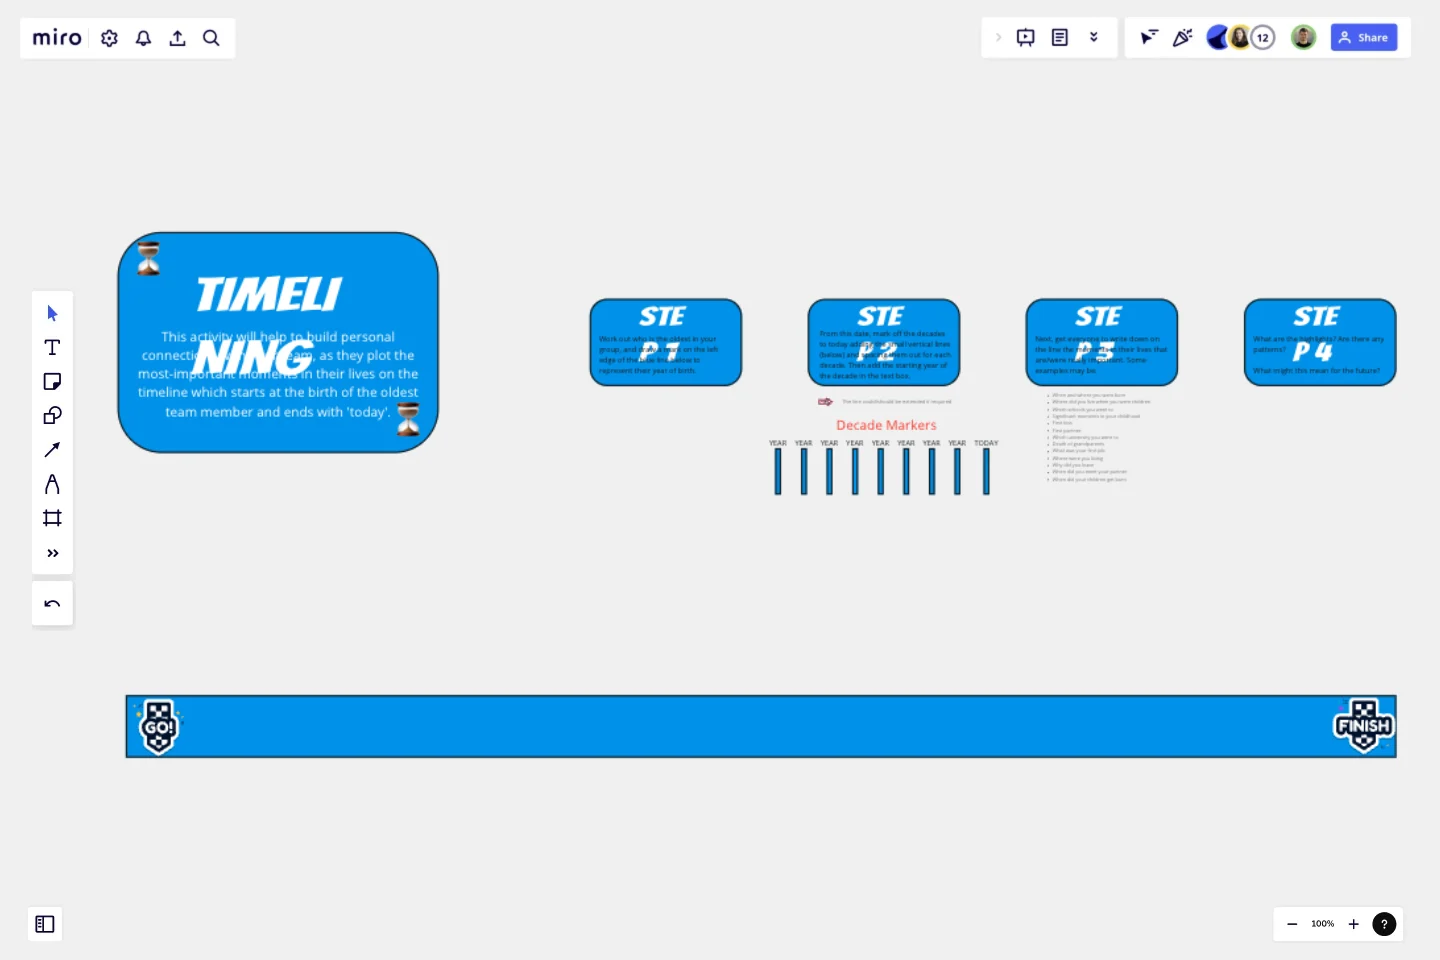
Timelining
This activity will help to build personal connections with your team, as they plot the most-important moments in their lives on the timeline.
What is Timelining all about?
Starting at the birth of the oldest team member and ending with 'today', it's a great way to foster team connection.
Instructions
The activity involves four steps.
Step 1
Work out who is the oldest in your group, and draw a mark on the left edge of the blue line (at "Go") to represent their year of birth.
Step 2
From this date, mark off the decades to today adding the small vertical lines and spacing them out for each decade. Then add the starting year of the decade in the text box.
Step 3
Next, get everyone to write down on the line the moments in their lives that are/were really important. Some examples may be:
When and where you were born
Where did you live when you were children
Which schools you went to
Significant moments in your childhood
First kiss
First partner
Which university you went to
Death of grandparents
What was your first job
Where were you living
Why did you leave
When did you meet your partner
When did your children get born
Step 4
What are the highlights? Are there any patterns? What might this mean for the future?
This template was created by Paul Snedden.
Get started with this template right now.
UML Class E-Commerce System Template
Works best for:
UML
The UML Class E-Commerce System Template streamlines the process of creating and visualizing the class structure of an e-commerce system. It provides a comprehensive framework that includes typical online shop features such as product listings, inventory management, shopping carts, orders, payments, and shipping details. This template facilitates a clear understanding of how these elements interact during an online sales transaction, making it an invaluable tool for teams working on e-commerce projects. By using this template, teams can save time, enhance collaboration, and ensure that their system architecture is robust and efficient, ready to adapt to their business's evolving needs.
Timeline Design
Works best for:
Timeline, Planning
The Timeline Design template is perfect for creating visually engaging timelines. It helps you showcase project milestones, deadlines, and important events in a clear and attractive format. Ideal for presentations and reports, this template ensures your timeline is both informative and visually appealing.
To-do List Template
Works best for:
Project Management, Education, Decision Making
A to-do list helps teams manage, organize, and prioritize their upcoming tasks. As a result, they can improve time management and streamline work operations. Using Miro’s to-do list template, teams create interactive, collaborative, and user-friendly task lists.
Crowd Sourced Cause and Effect
Works best for:
Fishbone Diagram, Problem solving
The Crowd Sourced Cause and Effect template leverages collective intelligence to identify root causes of problems. By involving multiple team members, you can gather diverse perspectives and uncover insights that might be overlooked. This collaborative approach ensures a comprehensive analysis and fosters team engagement.
Balanced Scorecard Template
Works best for:
Operations, Strategic Planning, Project Planning
Balanced scorecards are useful tools for understanding business performance at a glance with regard to customers, employees, business processes, and financial progress. Learn more about BSCs and create your own using Miro’s Balanced Scorecard template.
Process Map Template
Works best for:
Agile Methodology, Product Management, Mapping
Process mapping allows you to assess, document, and strategize around any plan or approach your team has put in place. It’s a useful tool for eliminating or preventing blockers. Organized by stages, a process map enables your team to divide up a process or system and record deliverables and action items at each stage of the process. By breaking down the objectives, activities and deliverables at any stage of a project, you can gain insight into whether you are on track or effectively working through a problem.
