Timeline-Retrospective
This template is for a team situation, where you as a moderator/coach want to reflect on how things have developed over time.
WHAT / WHEN / WHO
A typical example would be to have this special retrospective with a team at the end of a year in order to look back:
what went well
what not?
how do we look at our last months with some distance?
The main goal of this format is to celebrate what has been achieved; but also that we appreciate and reflect on the things that did not go so well (and by that find improvements or finish with them).
HOW
Most instructions can be found on the board directly. But a few hints and tips:The main exercise is about collecting the most interesting, exciting, impactful events of a given period (e.g. at the end of a year looking back until January).So ask the participants/team to come up with ideas and to write them on stickies.In order to support the process certain event types (and matching symbols for those) are prepared
Who left the team during that time; who joined?
Did we have some team events?
Kudos to colleagues for highlights during the year.
What did not go well at all?
Achievements, or milestones we want to point out?
Feel free to adjust the given types according to your situation
Also, ask the team to "feel back": can they remember when they were in a good/bad mood? → indicate that with a dot on the timelineAfter the participants have written down their ideas and used the symbols and dots to highlight their stickies: let each participant briefly explain, and describe their contributions to the timeline.This exercise of reflecting is in itself already valuable - but in a second step the team can reflect:
Any takeaways from the exercise/anything we want to do differently in the future?
Let the participants think about some insights, create ideas, and discuss them.
Close the session with a check-out
This template was created by Christian Ross.
Get started with this template right now.
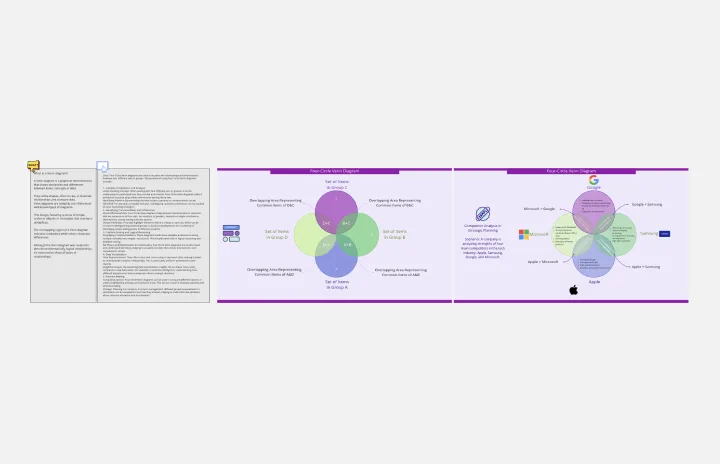
Four-Circle Venn Diagram
Works best for:
Venn Diagram
The Four Circle Venn Diagram template is designed for comparing four sets of data. Use this tool to identify commonalities and differences across multiple categories. This template is ideal for complex data analysis, strategic planning, and academic research. It helps you visually organize information, making it easier to understand and communicate insights. Perfect for educators, researchers, and professionals in need of detailed comparison tools.
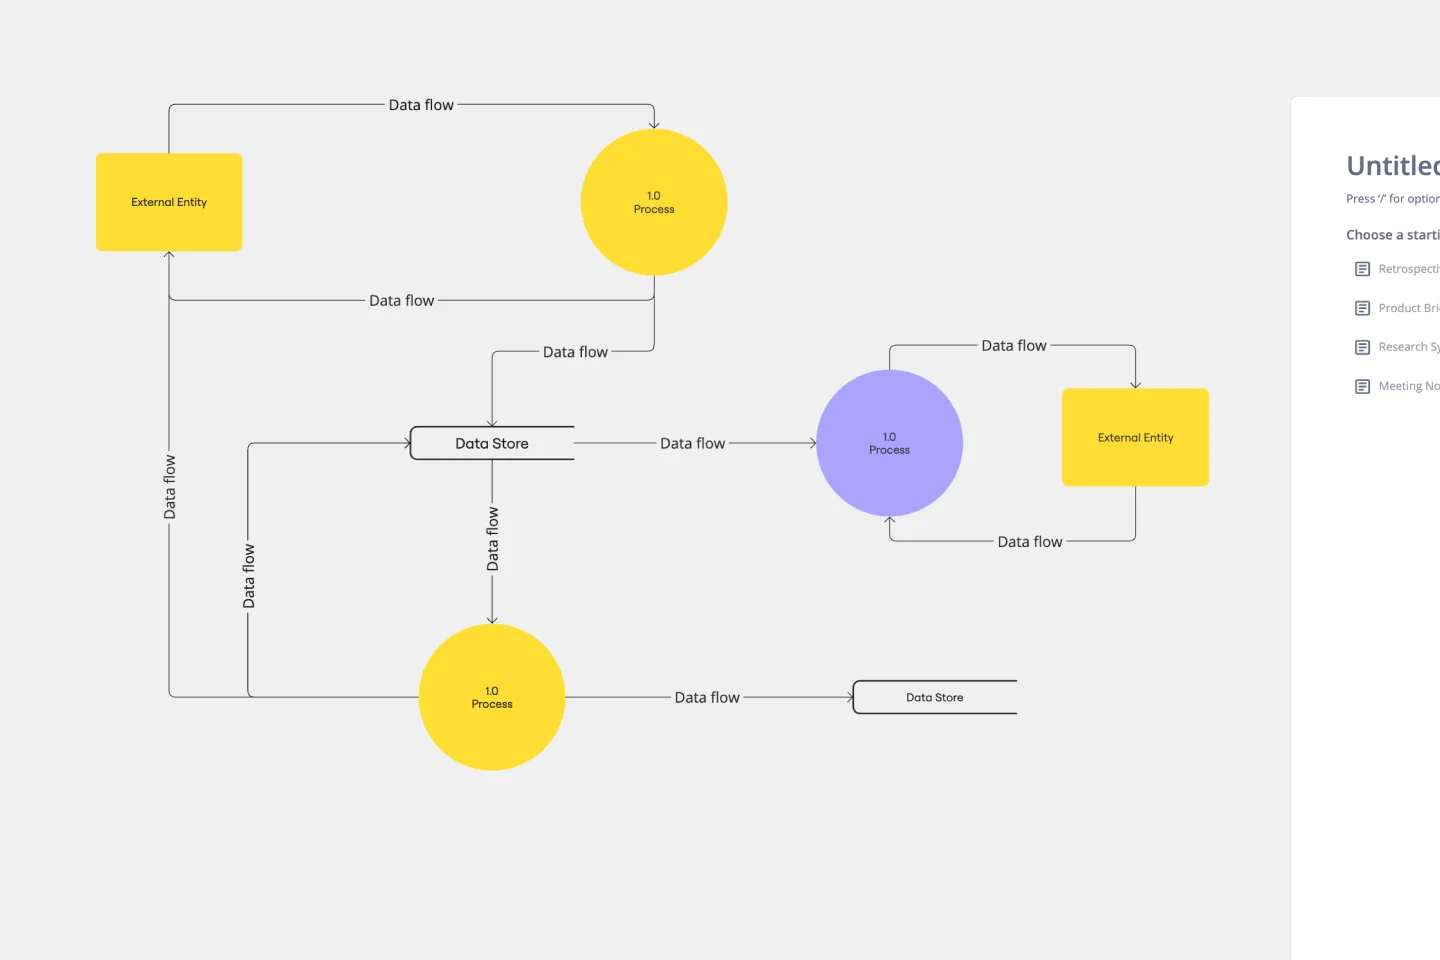
Data Flow Diagram Template
Works best for:
Flowcharts, Software Development, Diagrams
Any process can get pretty complex, especially when it has multiple components. Get a better grasp of your process through a data flow diagram (DFD). DFDs create a simple visual representation of all components in the flow of data and requirements in an entire system. They’re most often used by growth teams, data analysts, and product teams, and they’re created with one of three levels of complexity—0, 1, or 2. This template will help you easily build the best DFD for your process.
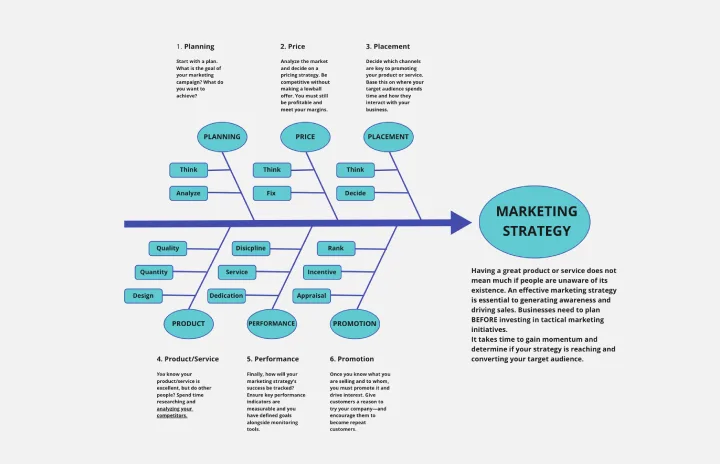
Fishbone Diagram for Marketing
Works best for:
Fishbone diagram
Identifying the root causes of marketing challenges is essential for effective strategy development. The Fishbone Diagram for Marketing template helps you systematically explore factors affecting your marketing efforts. Categorize potential causes into areas such as market research, product positioning, promotional strategies, and distribution channels. This structured analysis enables your team to pinpoint and address issues, optimizing marketing campaigns.
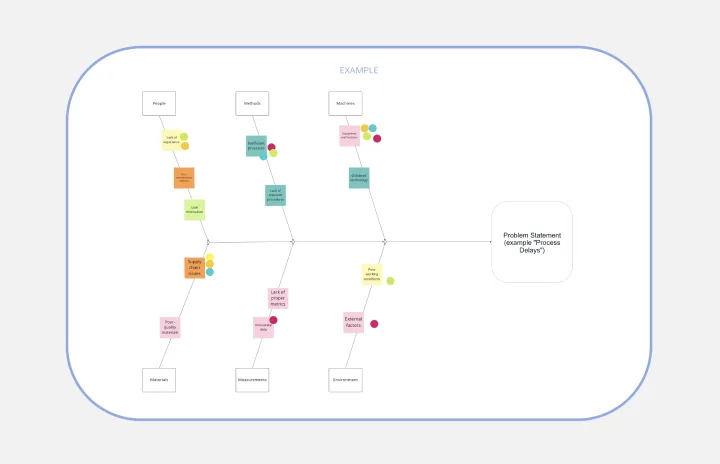
Fishbone Diagram for Process Improvement
Works best for:
Planning, Strategy
Process improvement is key to enhancing efficiency and productivity. The Fishbone Diagram for Process Improvement template helps you identify the root causes of process inefficiencies. Categorize potential causes into areas such as workflow, resources, technology, and personnel. This structured analysis enables your team to systematically explore and address issues, streamlining processes and boosting overall productivity.
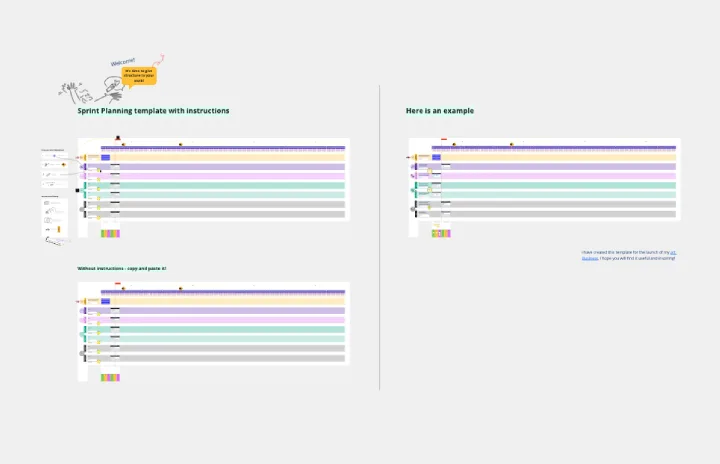
Sprint Planning by Piera Mattioli
Works best for:
Planning, Strategy
Sprint Planning Template helps you organize and plan your sprints effectively. It allows you to set goals, allocate tasks, and track progress, ensuring your team stays focused and meets sprint objectives. Perfect for agile teams.
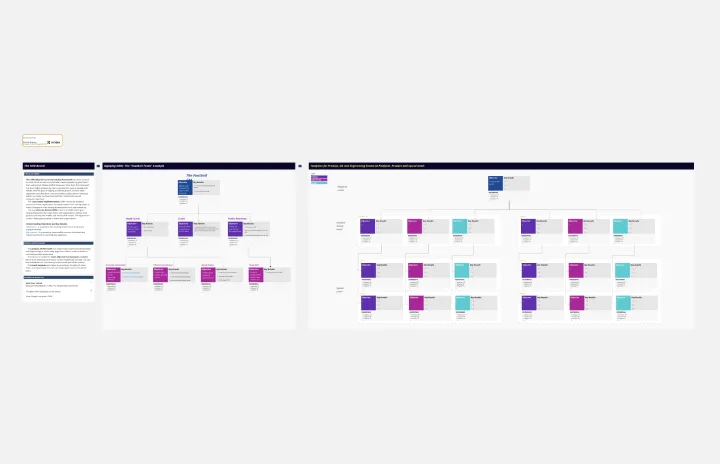
OKR Board for Product, UX and Engineering Teams
The OKR Board for Product, UX, and Engineering Teams template aligns cross-functional teams around common objectives using Objectives and Key Results (OKRs). By setting ambitious goals, defining measurable outcomes, and tracking progress collaboratively, this template fosters alignment and focus. With sections for defining team OKRs, prioritizing initiatives, and monitoring performance, it enables teams to work cohesively towards shared goals. This template serves as a catalyst for driving product innovation and delivering exceptional user experiences.