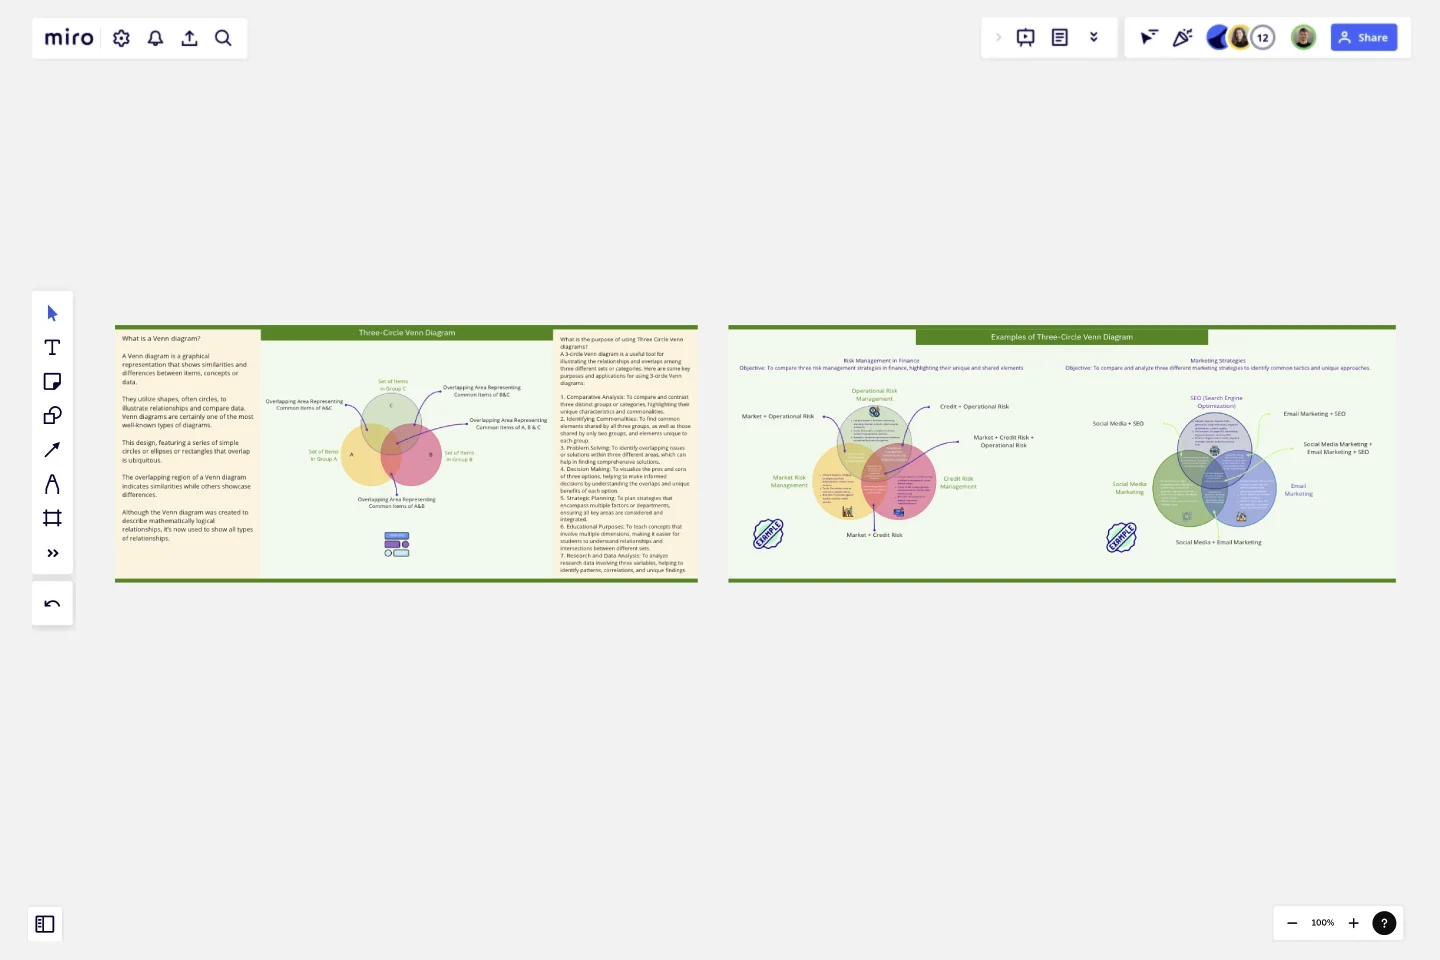
Three-Circle Venn Diagram
A Venn diagram is a graphical representation that shows similarities and differences between items, concepts or data.
They utilize shapes, often circles, to illustrate relationships and compare data.
Venn diagrams are certainly one of the most well-known types of diagrams. This design, featuring a series of simple circles or ellipses or rectangles that overlap is ubiquitous. The overlapping region of a Venn diagram indicates similarities while others showcase differences. Although the Venn diagram was created to describe mathematically logical relationships, it’s now used to show all types of relationships.
Purpose of using Three Circle Venn diagrams
A 3-circle Venn diagram is a useful tool for illustrating the relationships and overlaps among three different sets or categories. Here are some key purposes and applications for using 3-circle Venn diagrams:
1. Comparative Analysis: To compare and contrast three distinct groups or categories, highlighting their unique characteristics and commonalities.
2. Identifying Commonalities: To find common elements shared by all three groups, as well as those shared by only two groups, and elements unique to each group.
3. Problem Solving: To identify overlapping issues or solutions within three different areas, which can help in finding comprehensive solutions.
4. Decision Making: To visualize the pros and cons of three options, helping to make informed decisions by understanding the overlaps and unique benefits of each option.
5. Strategic Planning: To plan strategies that encompass multiple factors or departments, ensuring all key areas are considered and integrated.
6. Educational Purposes: To teach concepts that involve multiple dimensions, making it easier for students to understand relationships and intersections between different sets.
7. Research and Data Analysis: To analyze research data involving three variables, helping to identify patterns, correlations, and unique findings.
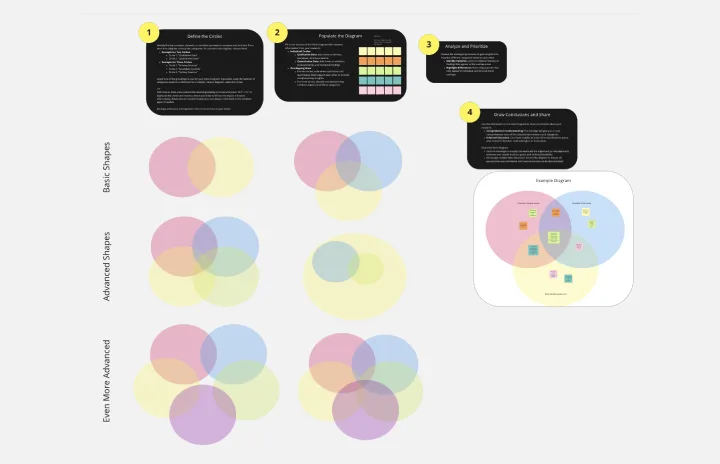
Along with step by step guide, two examples have also been provided to help you understand the concept of using 3-circle venn diagram. These can just be copy/paste to your own board.
This template was created by Khawaja Rizwan.
Get started with this template right now.
Venn Diagram for Research
Works best for:
Venn Diagram
The Venn Diagram for Research template is a powerful tool for analyzing relationships and intersections in research data. Use it to compare different variables, identify overlaps, and draw insights from complex datasets. This template is ideal for researchers, analysts, and academics looking to visualize their findings and communicate results effectively. It's perfect for scientific studies, market research, and any field that requires detailed data comparison.
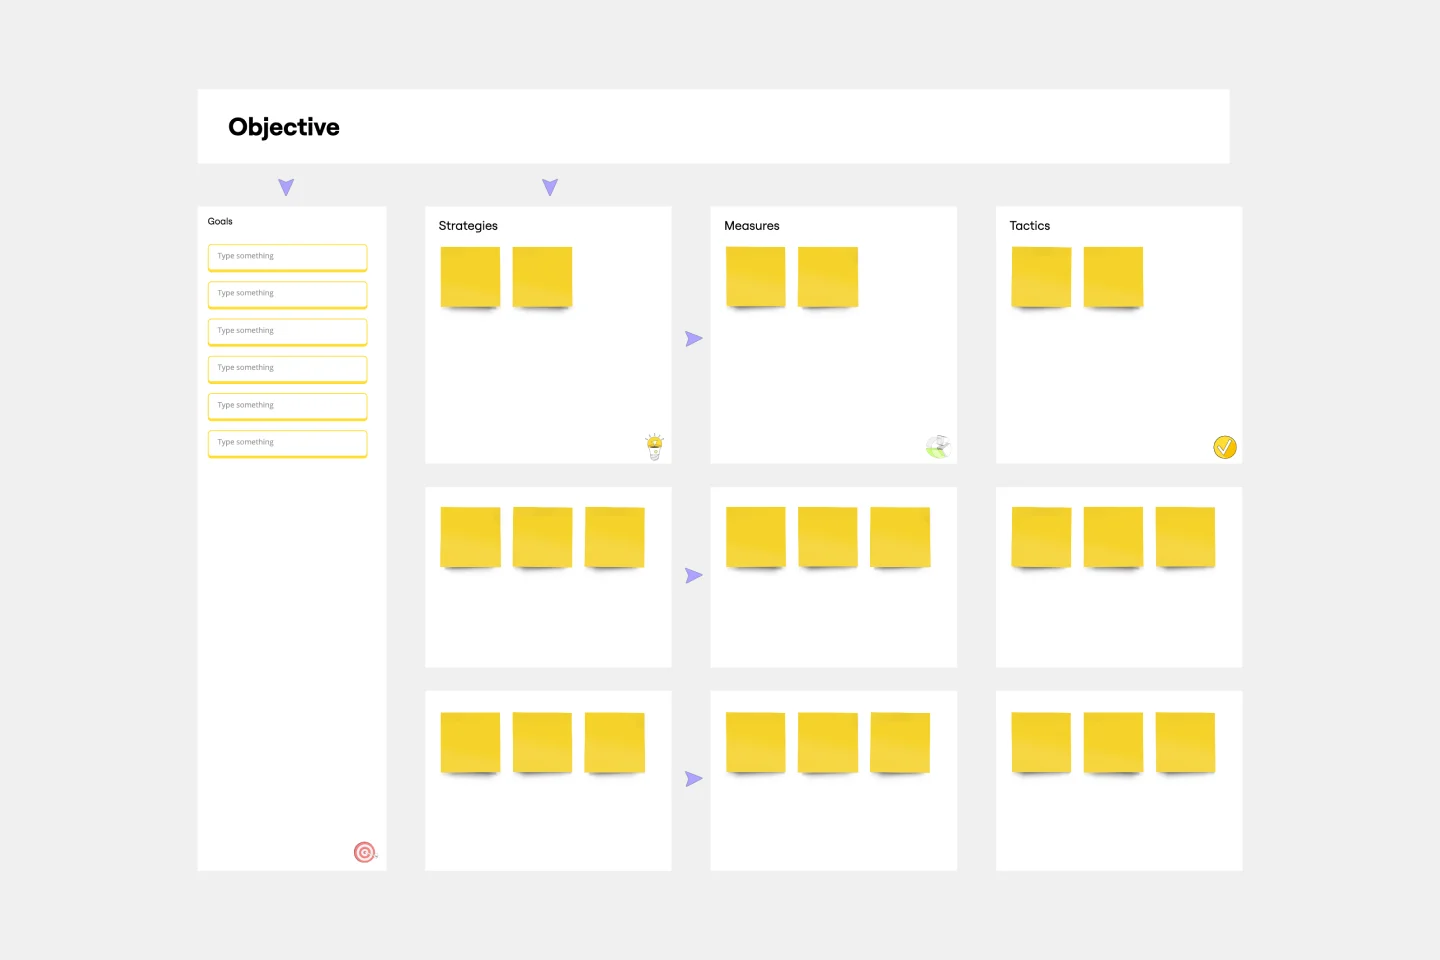
OGSM Template
Works best for:
Strategy, Planning
The OGSM template provides a readable framework, systematically breaking down business strategies into Objectives, Goals, Strategies, and Measures. This structured approach ensures that overarching visions are translated into actionable plans, fostering alignment across different teams and initiatives. One standout benefit of using this template is its ability to offer clarity. By clearly delineating between broad objectives and specific measures, stakeholders can easily comprehend and stay focused on the most critical elements of a strategy, ensuring that all efforts are directed toward the desired outcomes.
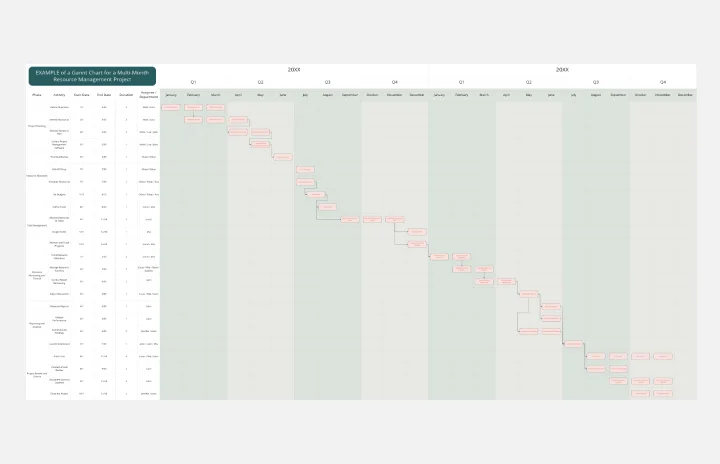
Resource Management Gantt Chart
Works best for:
Strategy, Planning
Efficient resource allocation is crucial for project success. The Resource Management Gantt Chart template helps you plan and manage your resources effectively. Use it to track the availability and allocation of personnel, equipment, and materials throughout your project. This template ensures resources are optimally utilized, reducing waste and avoiding delays, providing a clear overview of assignments and workload balance.
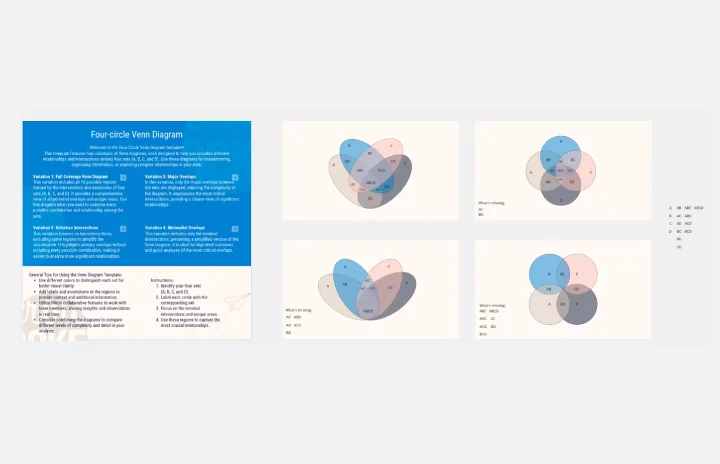
Four-Circle Venn Diagram by Irfan Rosli
Works best for:
Venn Diagrams
The Four Circle Venn Diagram template offers a robust tool for detailed data comparison involving four sets. Use it to identify common and unique attributes across multiple categories. This template is perfect for complex analysis in research, strategic planning, and education. It helps visualize relationships clearly, making it easier to draw insights and communicate findings. Ideal for professionals and educators needing advanced comparative tools.
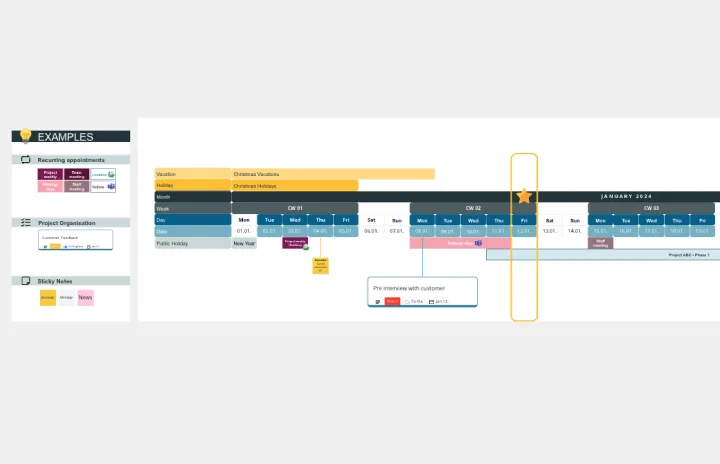
Workday Calendar - Timeline 2024
Works best for:
Planning, Timeline
The Workday Calendar Timeline 2024 template is ideal for planning your work year. It helps you organize work schedules, track important deadlines, and plan for holidays and events. This template ensures you stay productive and on top of your work commitments.
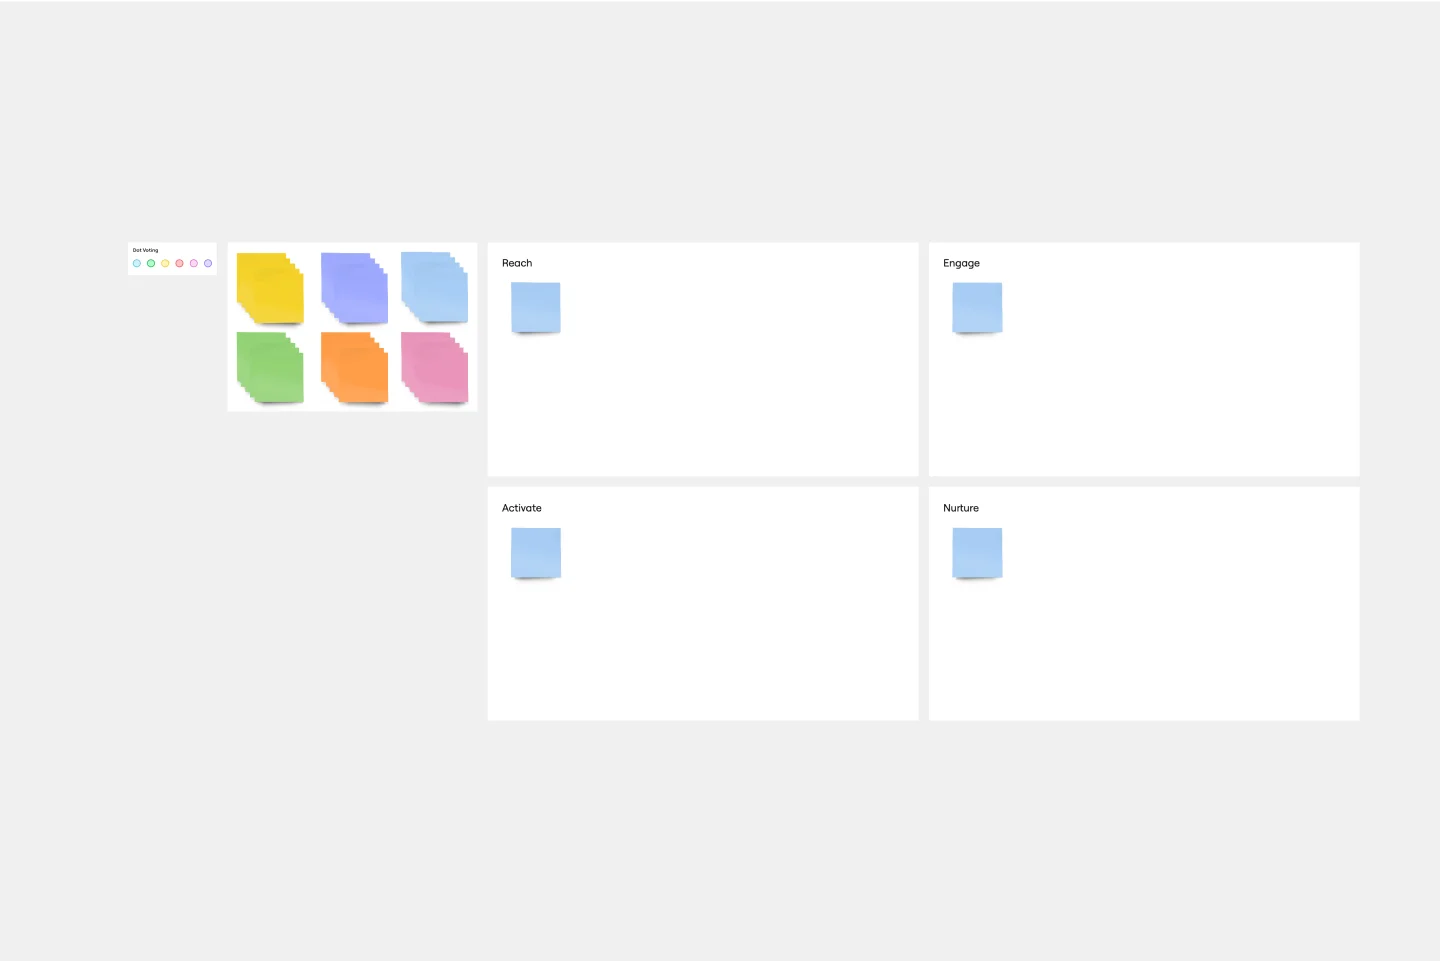
REAN Template
Works best for:
Marketing, Strategic Planning, Meetings
First introduced in Cult of Analytics, the REAN model is used to measure and understand the efficacy of marketing efforts. REAN stands for Reach, Engage, Activate, and Nurture, the main stages a marketer’s audiences experience during a typical journey. The REAN model helps marketing teams develop useful KPIs that can help capture how well their marketing or ad campaigns are working. Many teams rely on the REAN model because it is adaptable to a variety of marketing efforts, including planning measurement frameworks, setting goals, deciding on objectives, and mapping digital marketing channels.