Task Analysis Diagram Template
Analyze your user path by mapping out their tasks in a systematic way with the task analysis diagram template.
About the Task Analysis Diagram Template
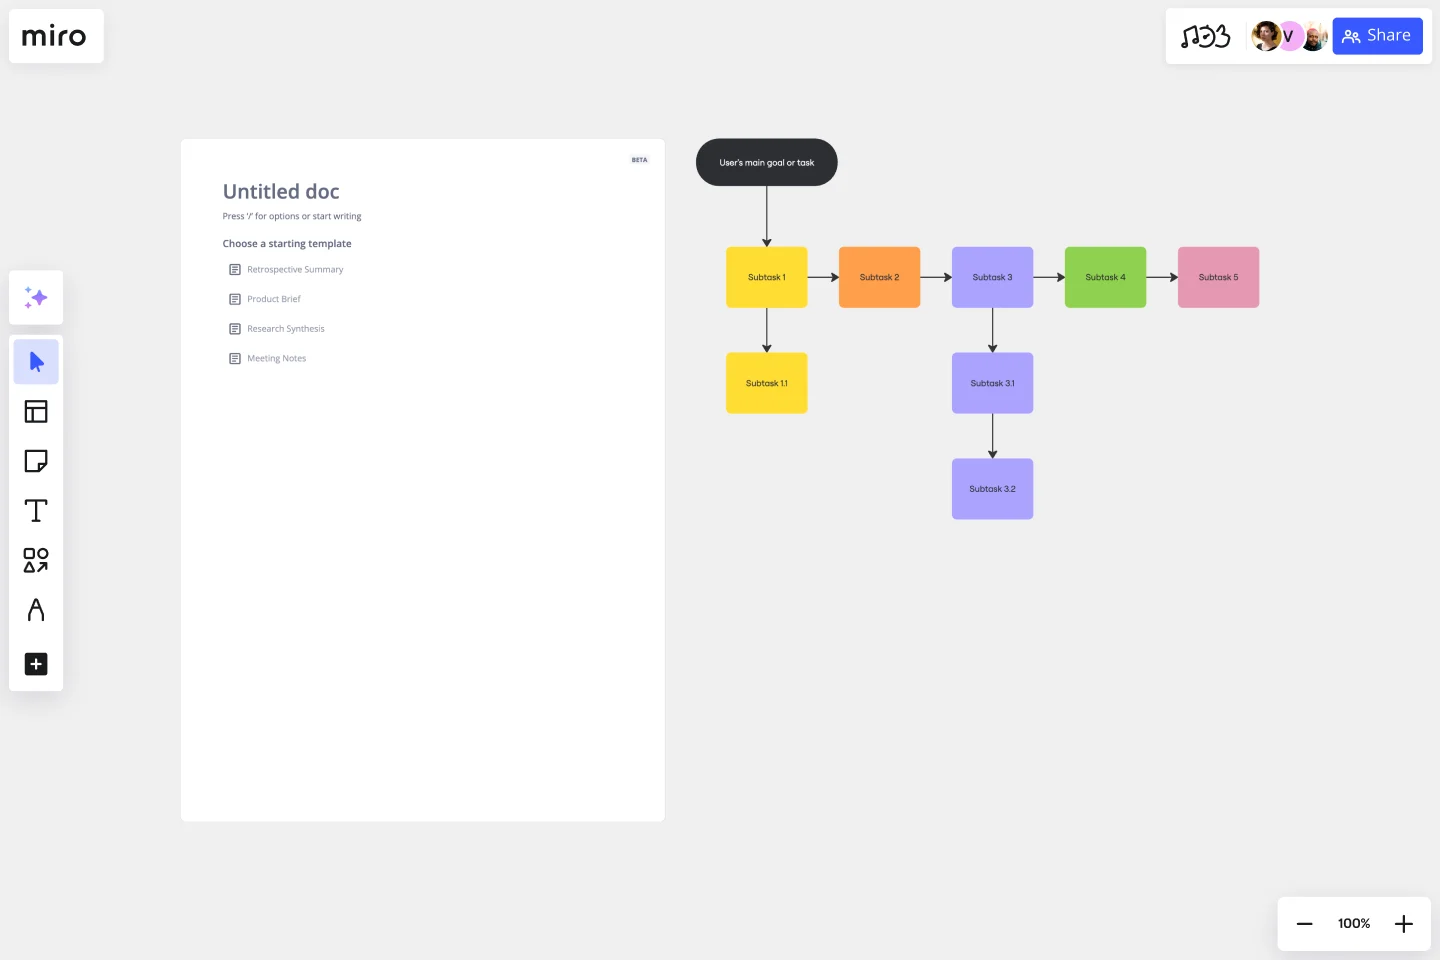
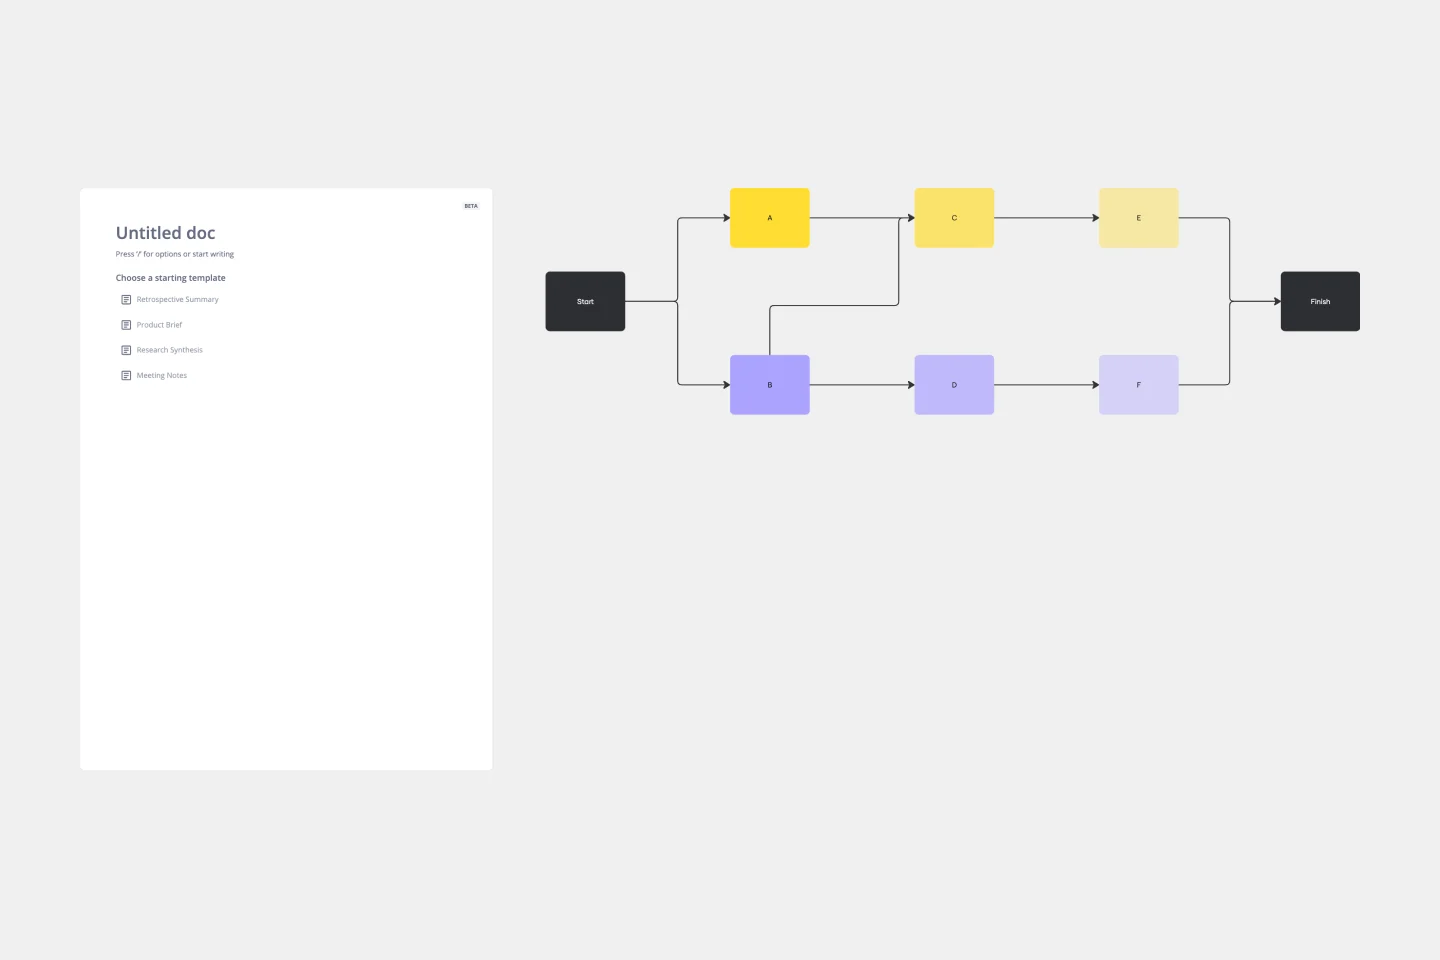
The task analysis diagram template is a visual tool that helps capture, organize, and categorize a user's tasks while interacting with a product. It is designed to break down user tasks and their interactions, making it easier to bridge the gap between planning and action. This template is perfect for anyone wanting to unravel a process's complexities and turn them into actionable steps.
The template presents each task in a sequential and hierarchical order, which makes it easier to understand the flow of the user's journey and identify dependencies and potential issues. It is like creating a map of the user's journey, where each step and action is detailed, ensuring a clear understanding of the entire process.
How do you use the task analysis diagram template?
Follow these four simple steps to get started:
Edit the template: Change the template to suit your needs with just a few clicks. You can add tasks, delete redundancies, or change the flow of the diagram. The template is designed to be user-friendly and easy to edit.
Expand: Need to expand the diagram? Miro’s automated diagramming features let you quickly add more shapes and connector lines while maintaining the diagram's structure.
Add contextual information: Make your diagram more comprehensive by adding relevant artifacts, such as documents, links, or images, for additional information.
Why should you use the task analysis diagram template?
Clear visualization: The template provides a clear, concise, and visual representation of all tasks and their interactions, making it easier to understand and follow than textual explanations.
Process identification: Using the template helps identify redundant tasks, potential bottlenecks, or gaps that might have been overlooked, which can be addressed to improve the overall process.
Enhanced collaboration: Team members can collaboratively view, discuss, and edit the diagram, ensuring everyone is on the same page and making it easier to work together.
User-centric design: Understanding the tasks a user undergoes helps design or change products to better suit user needs and preferences, resulting in better user experiences.
Structured approach: The template gives a structured approach to task analysis, ensuring no task or detail is overlooked and making the process more organized and efficient.
If you'd prefer to start from scratch, diagramming with Miro is easy! You can choose from a wide range of diagramming shapes in Miro's extensive library, so you'll find just what you need.
What if I need to add more tasks than the template provides?
No worries! The template is expandable. You can effortlessly add more shapes and connectors to accommodate additional tasks.
Can multiple team members collaborate on the same diagram?
Absolutely. The template is designed for collaborative efforts, ensuring multiple people can view, comment, or edit in real time.
Is there a way to integrate other information or links directly into the diagram?
Yes, you can seamlessly add any artifact onto the board, be it a document, image, or hyperlink, to provide richer context and information.
Get started with this template right now.
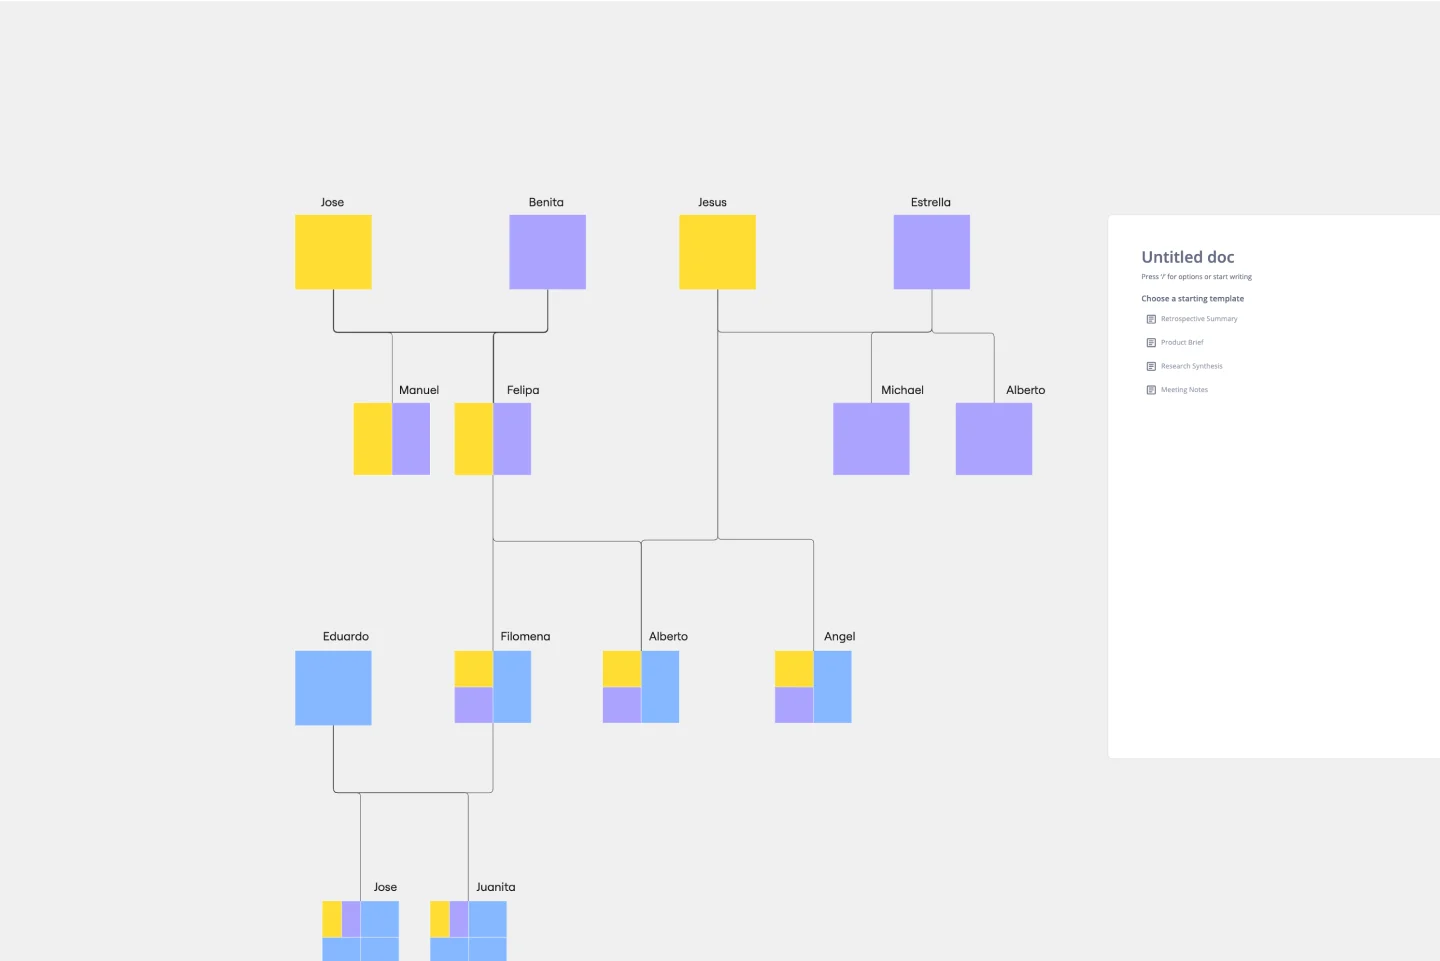
Genogram Template
Works best for:
Diagramming
The Genogram Template maps out family structures and relationships with exceptional depth and detail. Unlike traditional family trees, this template provides a comprehensive perspective by encapsulating familial connections, emotional ties, and significant life events. Create a genogram to unearth patterns and trends within a family, whether hereditary or environmental. Professionals across different domains can gain a holistic understanding of familial dynamics by showing deep insights into the nuances of relationships, facilitating better communication and problem-solving.
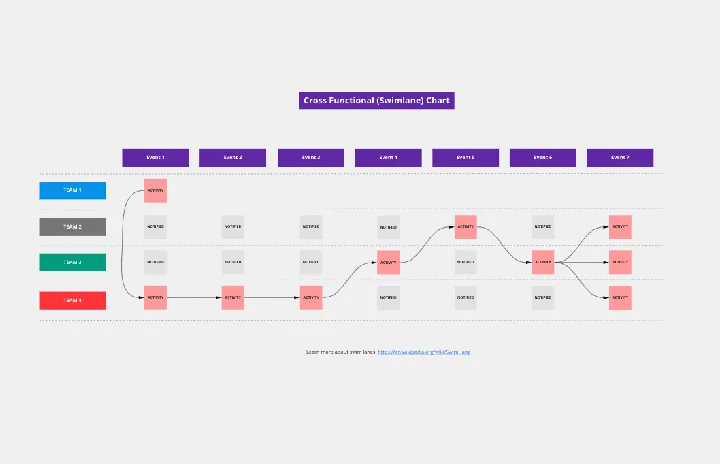
Cross Functional (Swimlane) Chart
Works best for:
Flowcharts, Mapping, Diagrams
The Cross Functional (Swimlane) Chart template offers a visual tool for mapping out processes or workflows with multiple stakeholders or functional areas. It provides swimlanes for organizing tasks and responsibilities by department or role. This template enables teams to visualize process flows, identify handoffs, and improve coordination and collaboration across functions. By promoting transparency and accountability, the Cross Functional (Swimlane) Chart empowers organizations to streamline workflows and drive cross-functional alignment effectively.
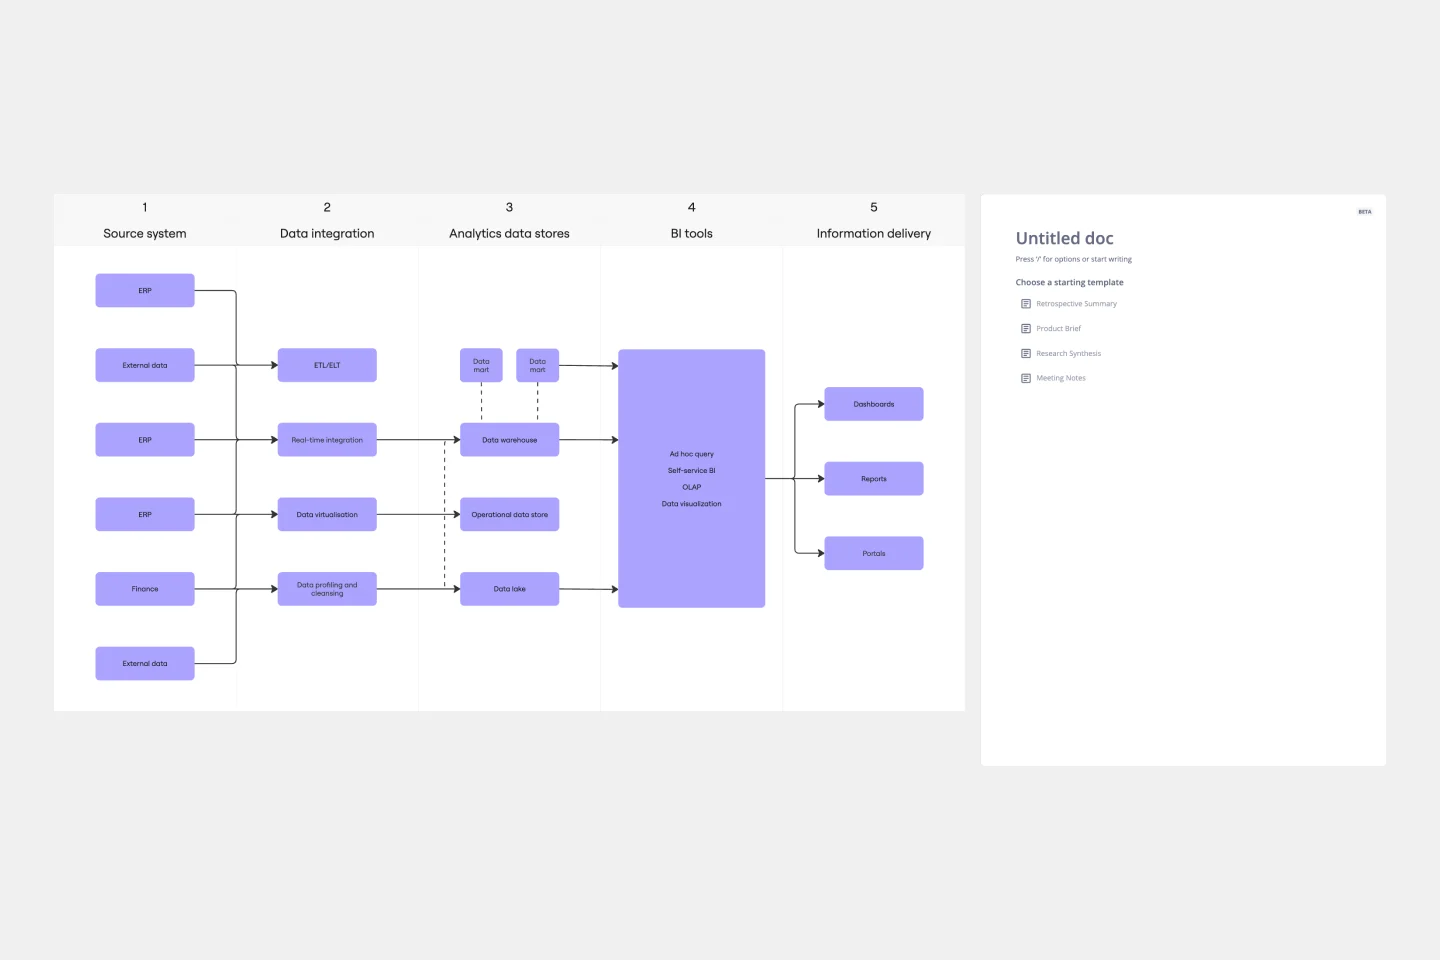
Business Intelligence Architecture Template
Works best for:
Diagramming
The Business Intelligence Architecture Diagram Template in Miro visually maps the complex landscape of business intelligence systems. With elements encompassing data sources, warehouses, ETL processes, tools, and end-user interfaces, the template enables users to communicate complex concepts with clarity. One standout feature is the template's dynamic adaptability, empowered by Miro's automated diagramming capabilities. This feature ensures that the diagram remains up-to-date with minimal effort, allowing users to effortlessly incorporate changes in data structures and processes, thus maintaining the relevance and accuracy of their visual representations over time.
Precedence Diagram
Works best for:
Diagramming, Mapping
The Precedence Diagram Template offers a visual tool that maps out project activities and their interrelated sequences. This diagram empowers teams to recognize and anticipate workflow structures by illustrating the connections and dependencies among tasks.
UML Use Case Diagram
Works best for:
UML Diagrams, Diagramming
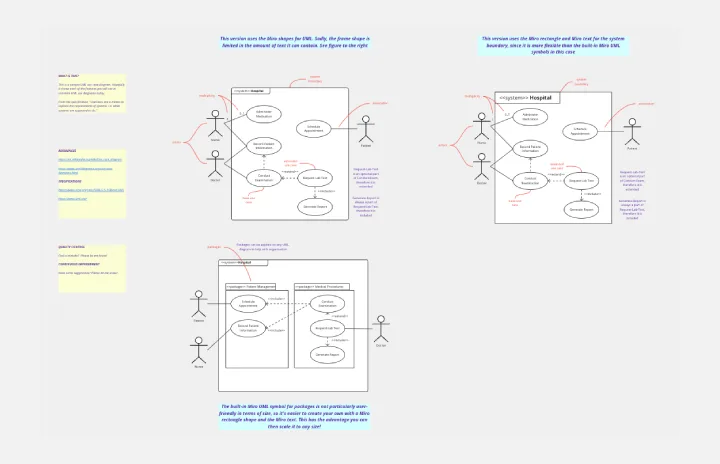
Visualize system interactions with the UML Use Case Diagram. This template helps you map out user interactions and system processes, providing a clear overview of functional requirements. Ideal for software developers, business analysts, and project managers, it supports planning and communicating system functionalities. Use it to ensure all user scenarios are considered and to facilitate better design and implementation of software systems.

BPM
Works best for:
Diagramming
The BPM (Business Process Management) template is a visual tool for modeling, analyzing, and optimizing business processes. It provides a structured framework for documenting process flows, identifying bottlenecks, and improving efficiency. This template enables organizations to streamline operations, enhance productivity, and drive business performance. By promoting process transparency and agility, the BPM template empowers teams to achieve operational excellence and deliver value to stakeholders.