T-Chart Template
Make better, faster decisions by organizing and comparing your ideas.
Trusted by 65M+ users and leading companies


About the T-Chart Template
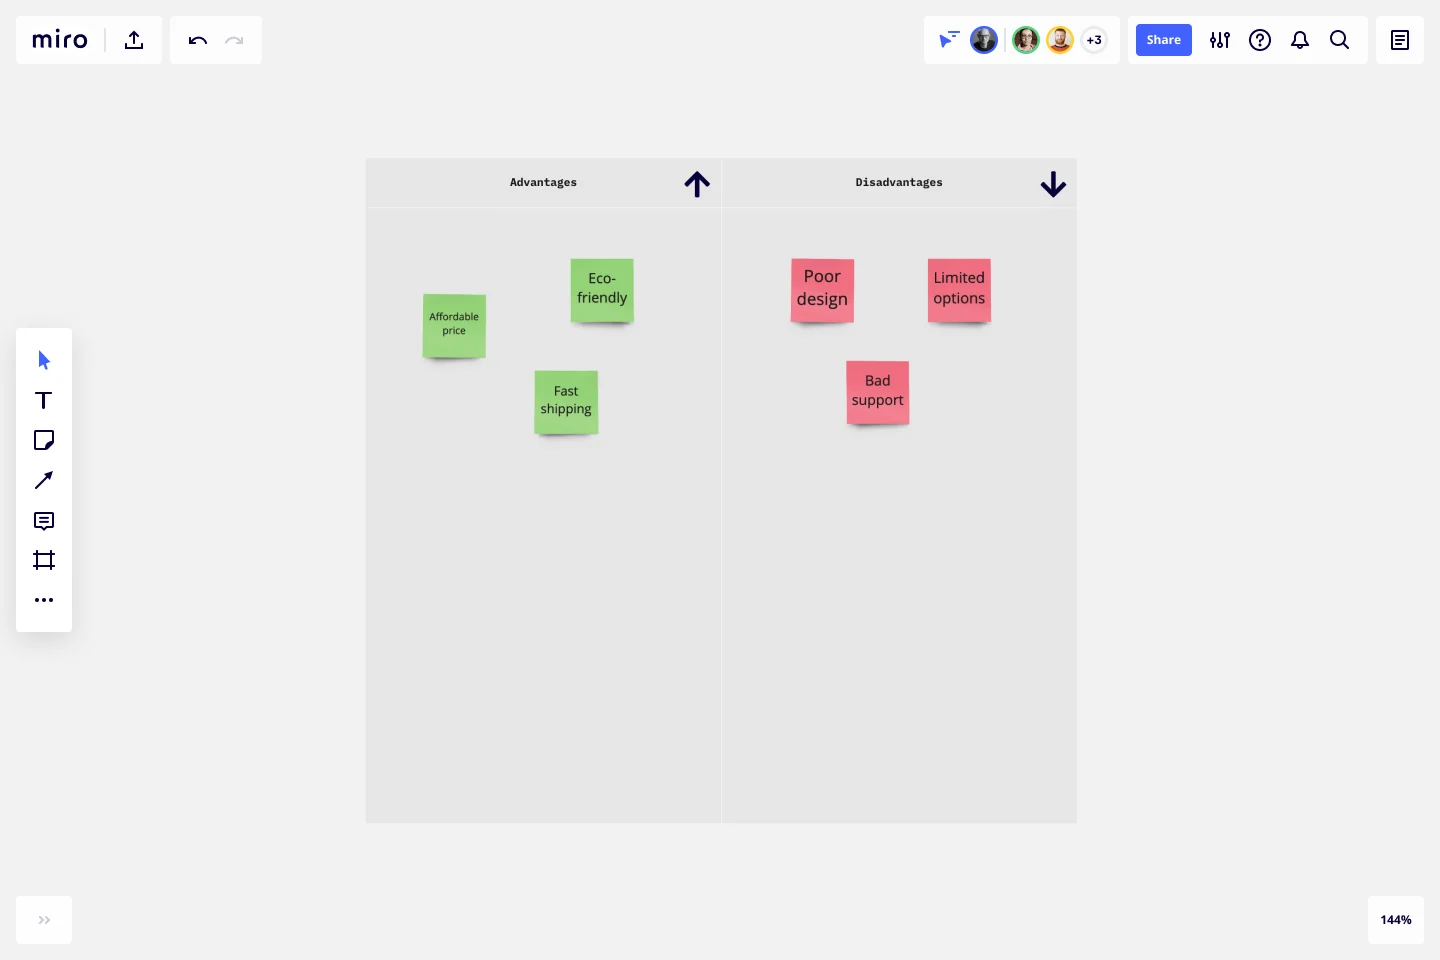
T-Charts can help you compare and contrast two different ideas, group information into different categories, and prove a change through “before” and “after” analysis. Designers and content creators can use T-Charts to turn possibilities into actionable ideas.
What is a T-Chart
T-Charts are a visual organizational tool that can help problem solve and compare aspects of two ideas. You can make comparisons such as pros and cons, facts and opinions, strengths and weaknesses, or big-picture views versus specific details.
When to use a T-Chart
T-Charts are useful for discussing differences and similarities with your team or clients and can help you to reach a decision together. Try testing out different headings or themes depending on the kind of problem you’d like to solve. This can include:
Compare pros and cons
Analyze personality traits
Contrast before and after states
Define cause and effect
Compare then and now states
Build a glossary to keep track of words and definitions
Outline hypothetical solutions and their potential outcomes
T-Charts allow your team to record new insights, spot patterns, and share knowledge. T- Charts often complement statistical data and graphs that can be presented with a formed narrative.
Create your own T-Chart
Making your own T-Charts is easy. Miro is the perfect canvas to create a T-chart and share them. Get started by selecting the T-Chart Template, then take the following steps to make one of your own:
Decide why you need a T-Chart. Are you comparing and contrasting design or content-related ideas to make a decision? Or outlining situations to plan ahead of important events? Either way, thinking ahead can create a strong foundation for your chart.
Invite your team or clients to fill in the blanks. Up to 300 people can collaborate seamlessly on your Miro board. If you need input or feedback to narrow down your ideas, invite others to participate.
Add visuals to strengthen your text, or make a final decision. Adding emojis or photos will bring an emotional layer or more context for your team. You can use imagery as a tool to vote for a preferred option. Imagery can also help bring the chart to life with real-life references.
Get started with this template right now.
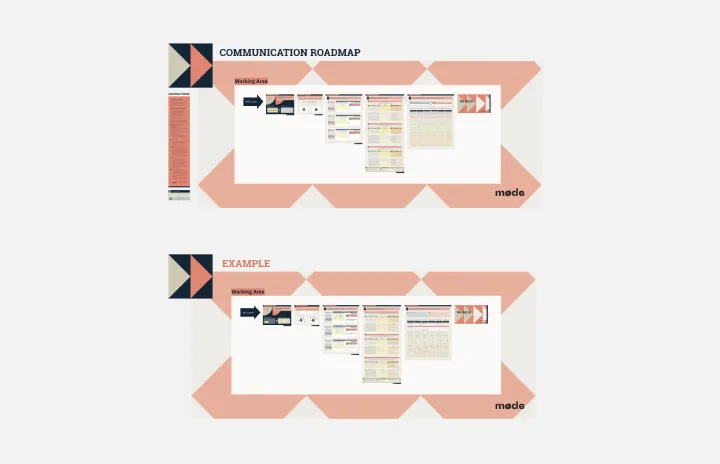
Communication Roadmap
Works best for:
Roadmap, Mapping, Planning
The Communication Roadmap template enables teams to plan and execute effective communication strategies. By outlining key messages, channels, and stakeholders, teams can ensure consistent and targeted communication throughout a project lifecycle. This template fosters alignment and transparency, enabling teams to engage stakeholders effectively and mitigate risks associated with miscommunication.
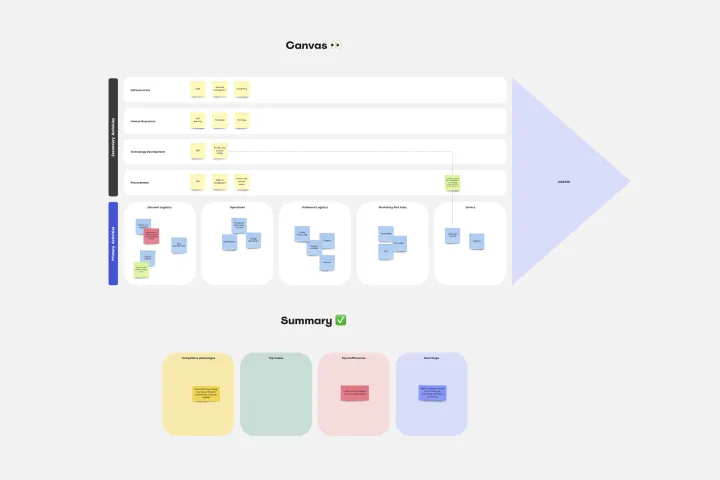
Value Chain Analysis Template
Works best for:
Leadership, Strategic Planning, Workflows
First coined by Harvard Business School professor Michael Porter, the value chain analysis helps your team evaluate your business activities so you can find ways to improve your competitive advantage. A value chain is a set of activities that a company performs in order to deliver a valuable product from start to finish. The analysis itself allows your team to visualize all the business activities involved in creating the product—and helps you identify inefficiencies, bottlenecks, and miscommunication within the process.
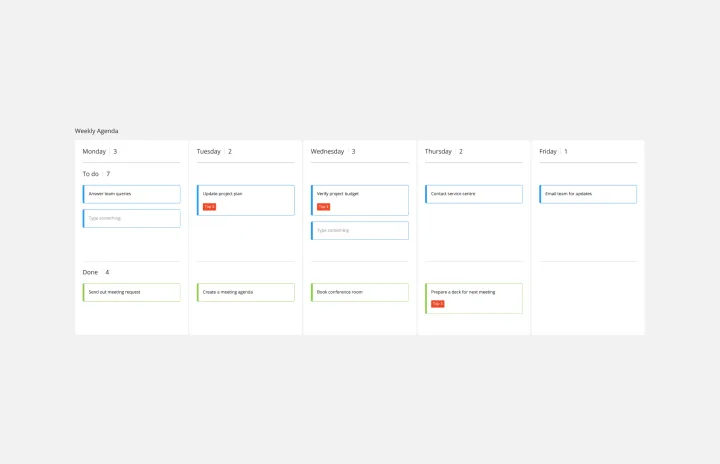
Weekly Planner Template
Works best for:
Business Management, Project Planning
A weekly planner is a schedule that outlines your plans and activities for the week ahead. It helps you manage your time, keep track of your tasks, and organize your team on a day-to-day basis. Unlike traditional planners, which are often non-customizable, this weekly planner can be modified to suit your specific needs.
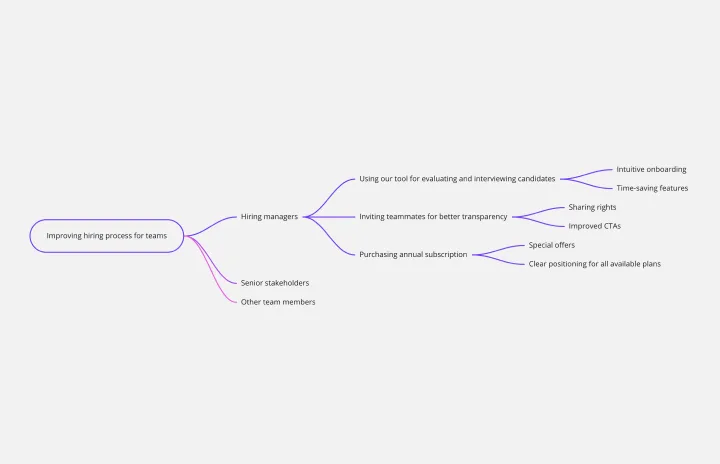
Impact Mapping Template
Works best for:
Agile Methodology, Mapping, Agile Workflows
When you’re building products and shipping goods (oh, and everything in between) there’s nothing more important than staying organized and on-task. Impact mapping is a great way to do it. This trusty product planning technique creates a graphical representation of all your goals and the steps it’ll take to reach each one — so you can clearly communicate with your teammates, align on business objectives, and build better roadmaps. Our template will help you do impact mapping for any type of project planning.
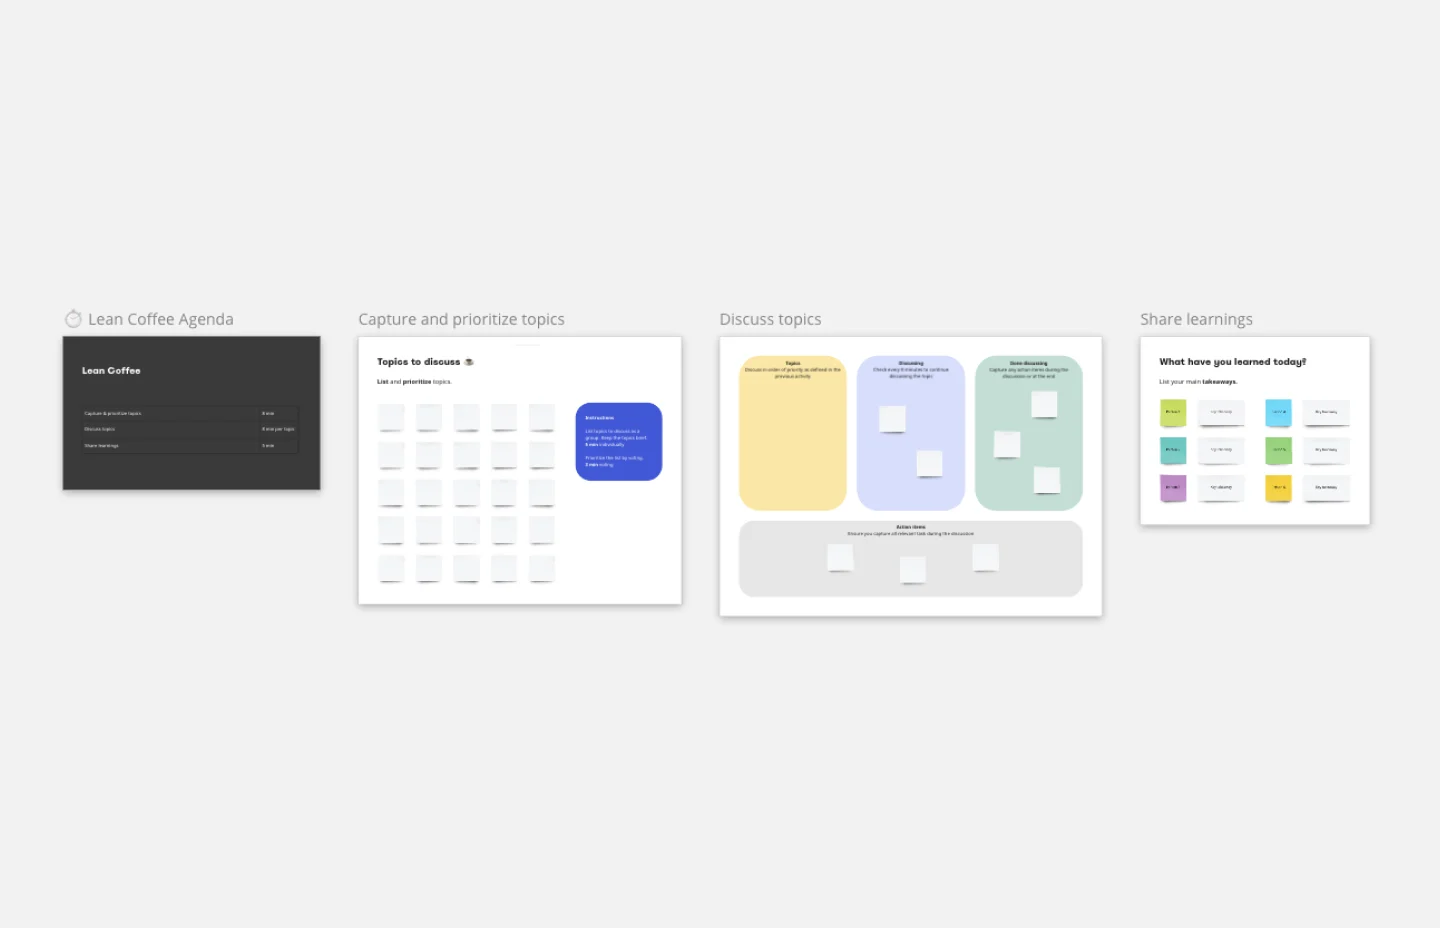
Lean Coffee Template
Works best for:
Agile Methodology, Product Management, Meetings
What makes a great meeting (other than donuts)? It’s appreciating everyone’s skills, resources, and time by making the very best use of them. That’s what the Lean Coffee approach is designed to do. Great for team brainstorms and retrospectives, Lean Coffee breaks the meeting into three basic stages: what to discuss, what’s being discussed, and what’s been discussed. This template makes it easy for you to collect sticky notes and to update the columns as you go from topic to topic.
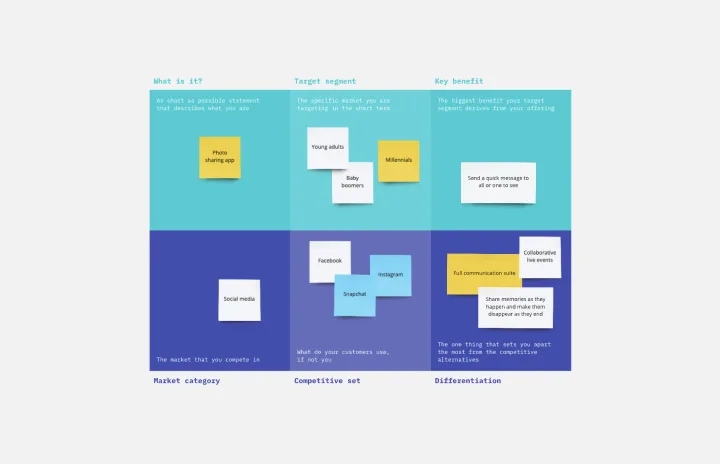
Product Positioning Template
Works best for:
Marketing, Product Management, Desk Research
For better or for worse, your company’s chances for success hinge partially on your market. As such, before you start building products and planning strategies, it’s a good idea to conduct a product positioning exercise. A product positioning exercise is designed to situate your company and your offering within a market. The product positioning template guides you to consider key topics such as defining your product and market category, identifying your target segment and competitors, and understanding your key benefits and differentiation.