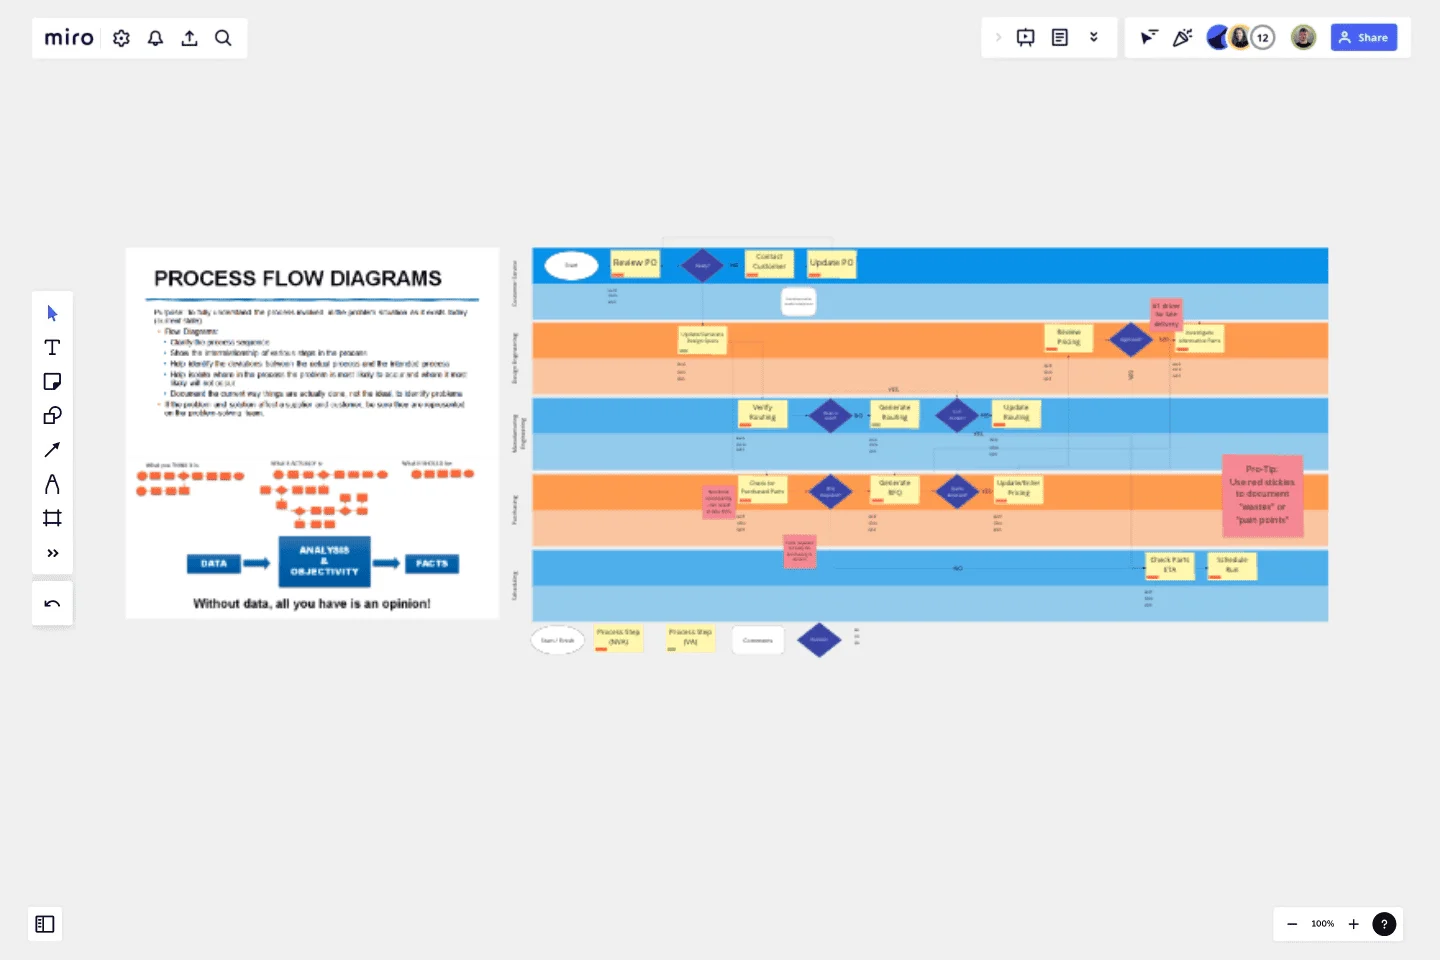
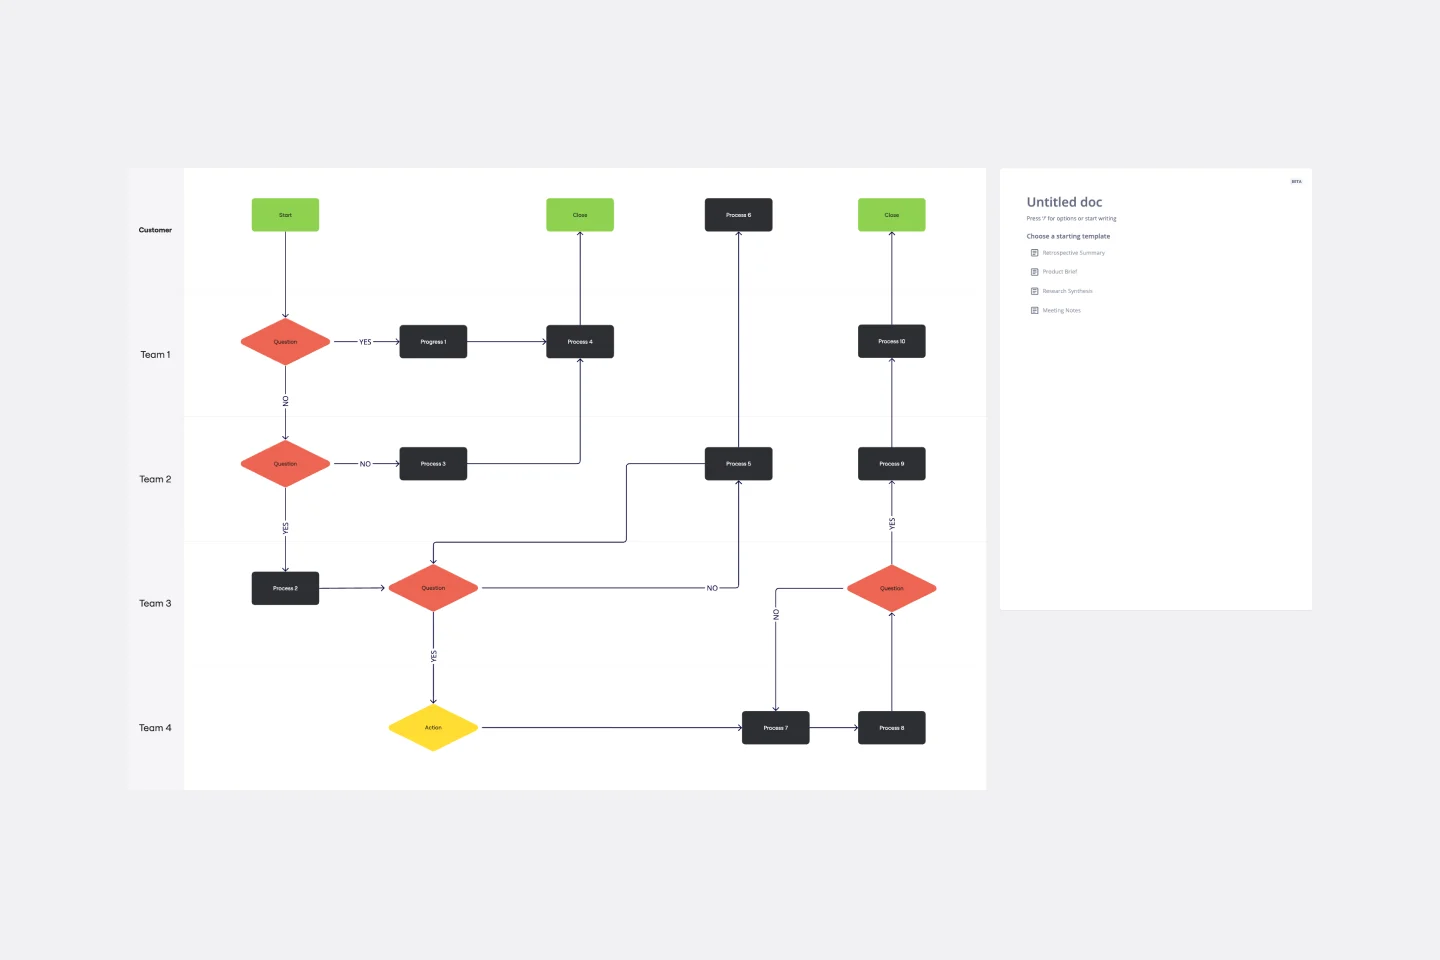
Swim Lane Diagram with Data
This swim lane diagram is a fundamental tool to any transactional process improvement
This template allows you to visualize the process, understand the current state, and enables you to visualize a complex transactional process covering multiple roles and departments. The insights that you will gain while building this diagram as a team can be exceptionally meaningful.
This swim lane diagram will help you to:
Clarify the process sequence
Capture process relevant data
Show the interrelationship of various steps in the process
Help identify deviations between the actual process and the intended process
Help isolate where in the process the problems are most likely to occur
Visually demonstrate the number of hand-offs between roles and/or departments
When evaluating your process document the current way things are actually done, not the ideal, to identify problems. This is accomplished by going to the actual place where the work is done and observing the actual work while talking to the individuals who perform the tasks. Do not take for granted that you know what happens. It is always important to go and see.
This template was created by NEXT LEVEL Partners.
Get started with this template right now.
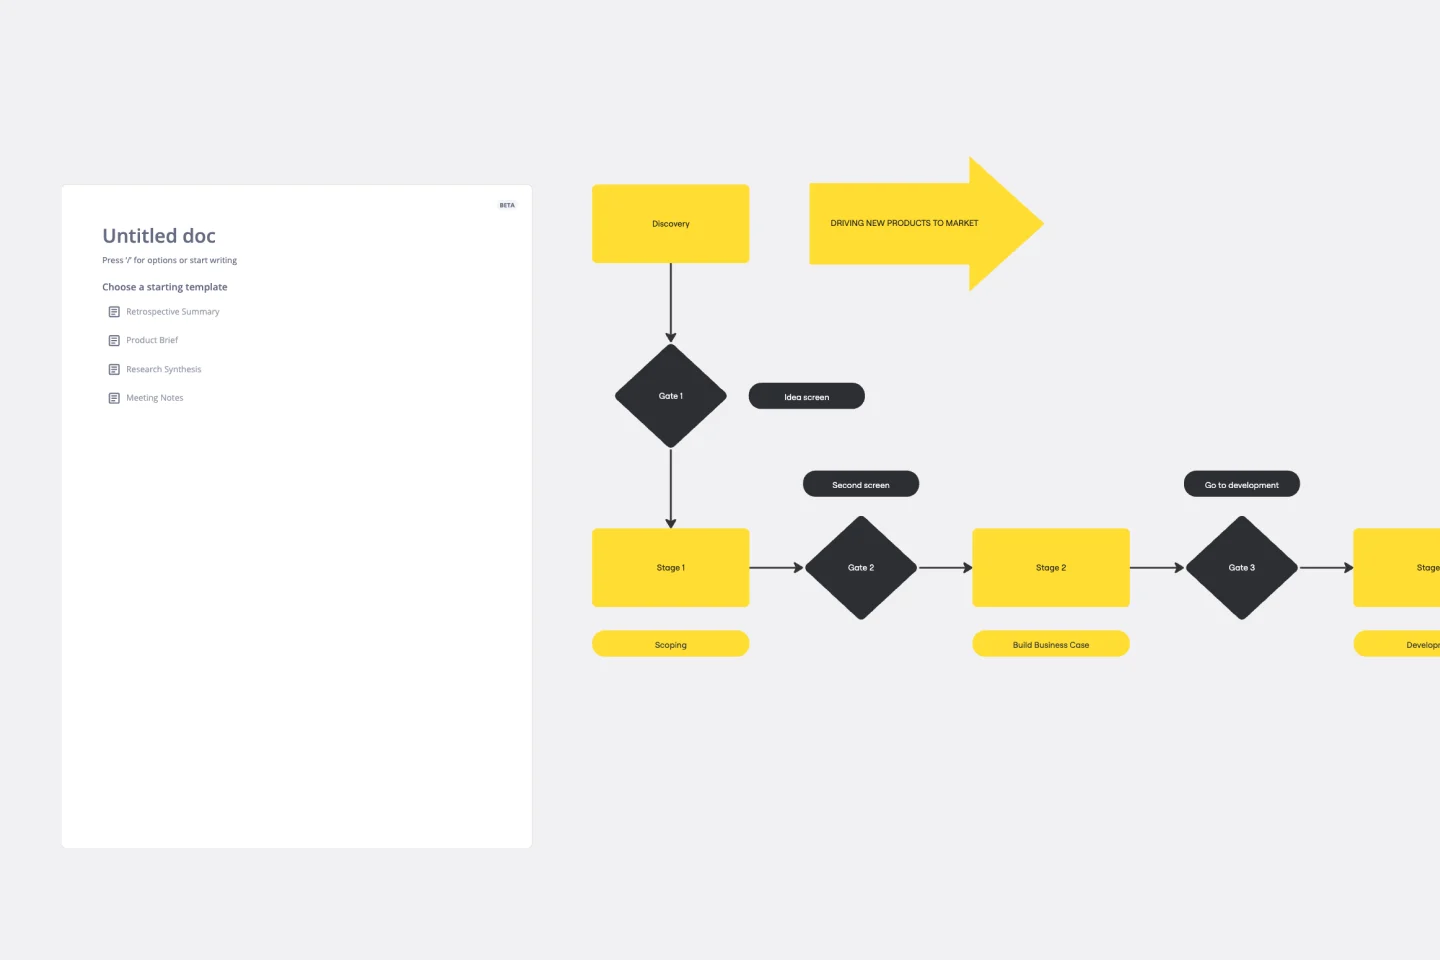
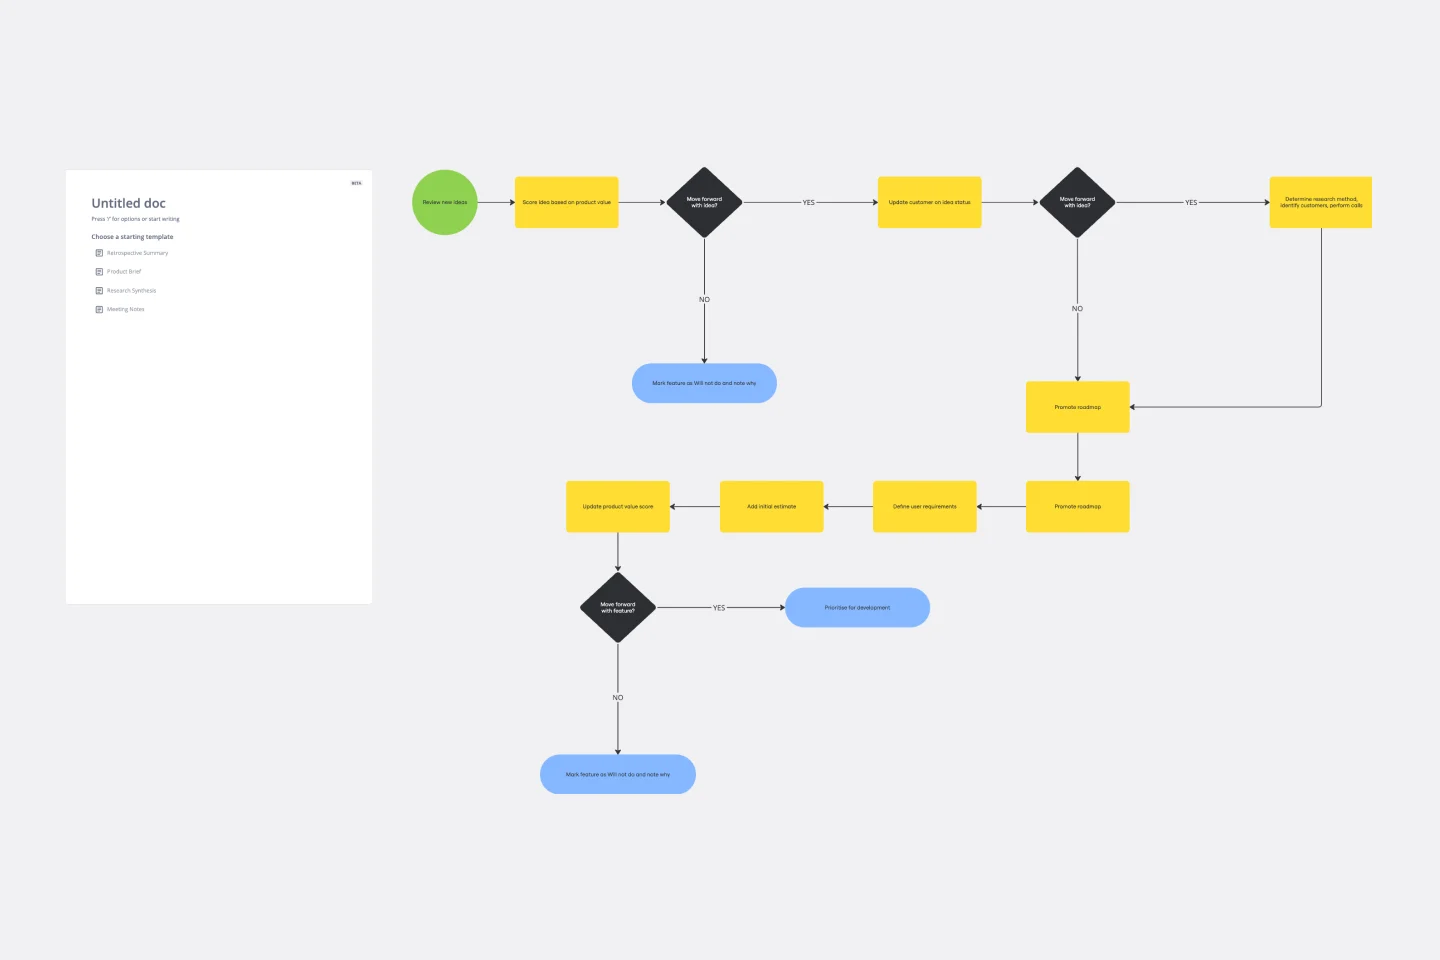
Stage-Gate Process Flowchart Template
Works best for:
Diagramming, Project Management
The Stage-Gate Process Flowchart Template structures a project into distinct stages separated by decision-making gates, enhancing the quality of decisions and leading to more successful project outcomes.
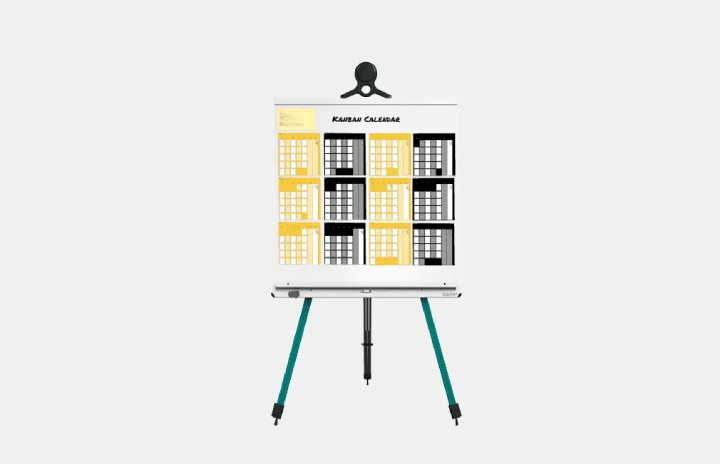
Kanban Calendar
Works best for:
Kanban Boards, Agile Methodology, Agile Workflows
Kanban Calendar template enhances workflow visualization by integrating Kanban principles with time management. It enables teams to plan and track tasks across days, weeks, or months, facilitating efficient resource allocation and timely delivery. With customizable features and intuitive design, this template empowers teams to optimize their workflow and meet project deadlines effectively.
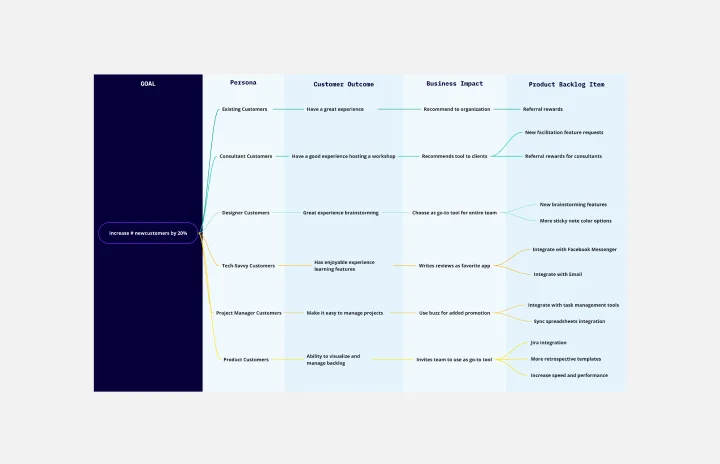
Outcome Mapping Template
Works best for:
Diagrams, Mapping, Project Management
Use Miro’s outcome mapping template to improve your operational efficiency. Outcome mapping will help you visualize all the possible strategic outcomes for your upcoming project, allowing you to see into the black box to identify any potential challenges along the way.
Cross Functional Flowchart
Works best for:
Org Charts, Business Management
Have a quick look at everyone on a project and see exactly what they’ll contribute. That’s the clarity and transparency a cross-functional flowchart will give you. These are also called “swim lane” flowcharts because each person (each customer, client, or representative from a specific function) is assigned a lane—a clear line—that will help you visualize their roles at each stage of the project. This template will empower you to streamline processes, reduce inefficiencies, and make meaningful cross-functional relationships.
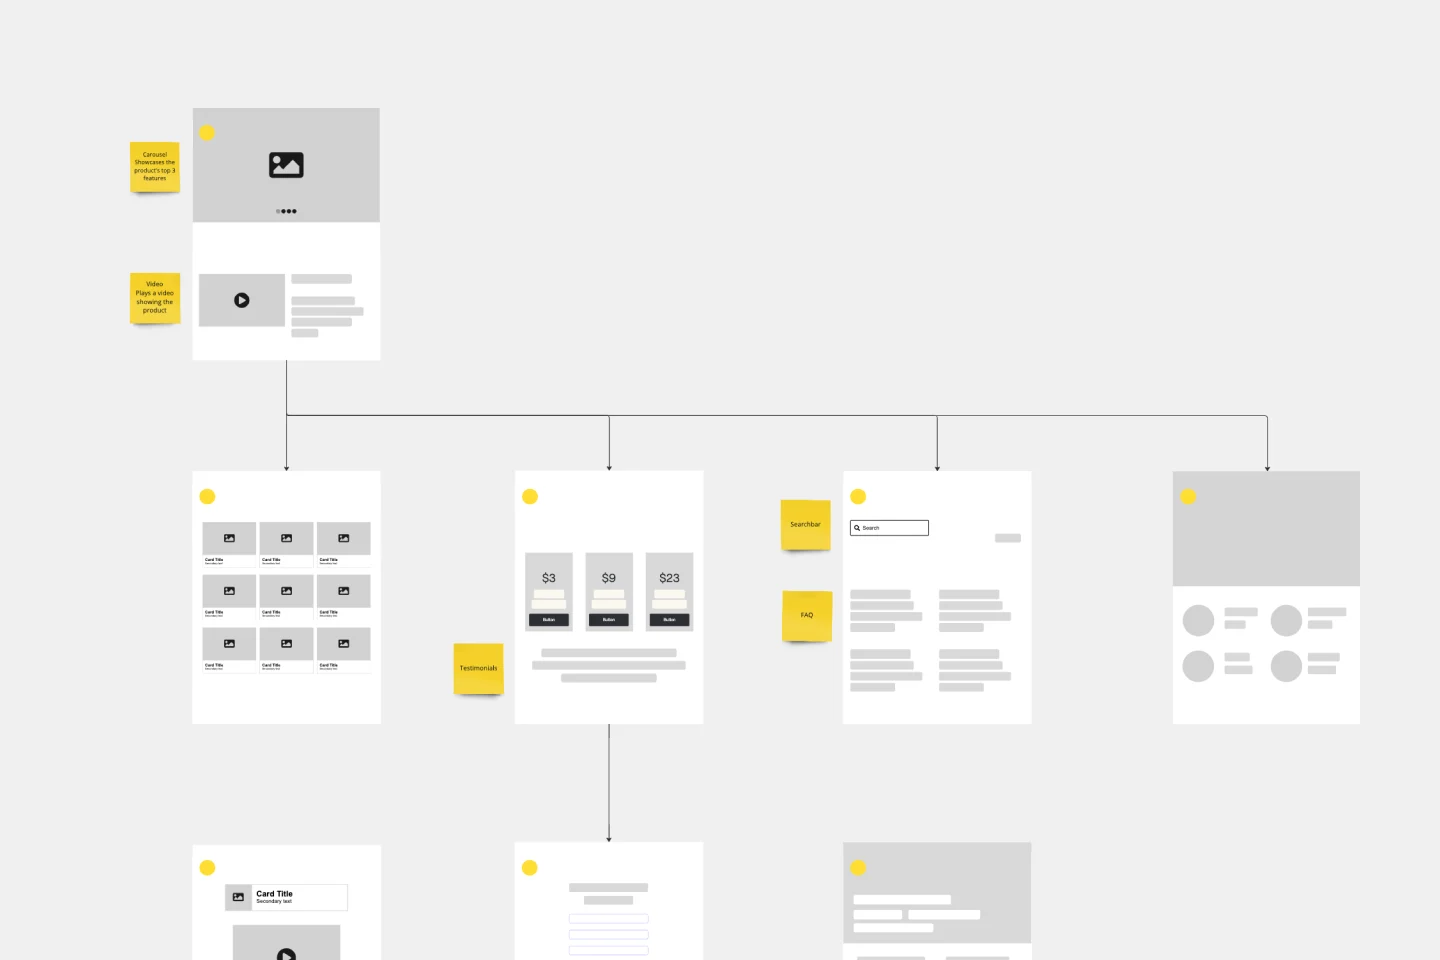
Website Flowchart Template
Works best for:
Flowcharts, Mapping, User Experience
A website flowchart, also known as a sitemap, maps out the structure and complexity of any current or future website. The flowchart can also help your team identify knowledge gaps for future content. When you’re building a website, you want to ensure that each piece of content gives users accurate research results based on keywords associated with your web content. Product, UX, and content teams can use flowcharts or sitemaps to understand everything contained in a website, and plan to add or restructure content to improve a website’s user experience.
Workflow Diagram Template
Works best for:
Diagramming, Mapping, Process mapping
The Workflow Diagram Template maps out and represents processes or systems using standardized symbols and shapes. By delineating the various steps or stages in a process, it ensures that tasks flow seamlessly from initiation to completion. One of the standout benefits of using this template is its clarity. By translating processes into a visual format, all participants can gain a comprehensive understanding at a glance, eliminating confusion and ensuring everyone is on the same page. This clarity not only promotes efficient task execution but also fosters collaboration among team members.