Storyboards by maad labs
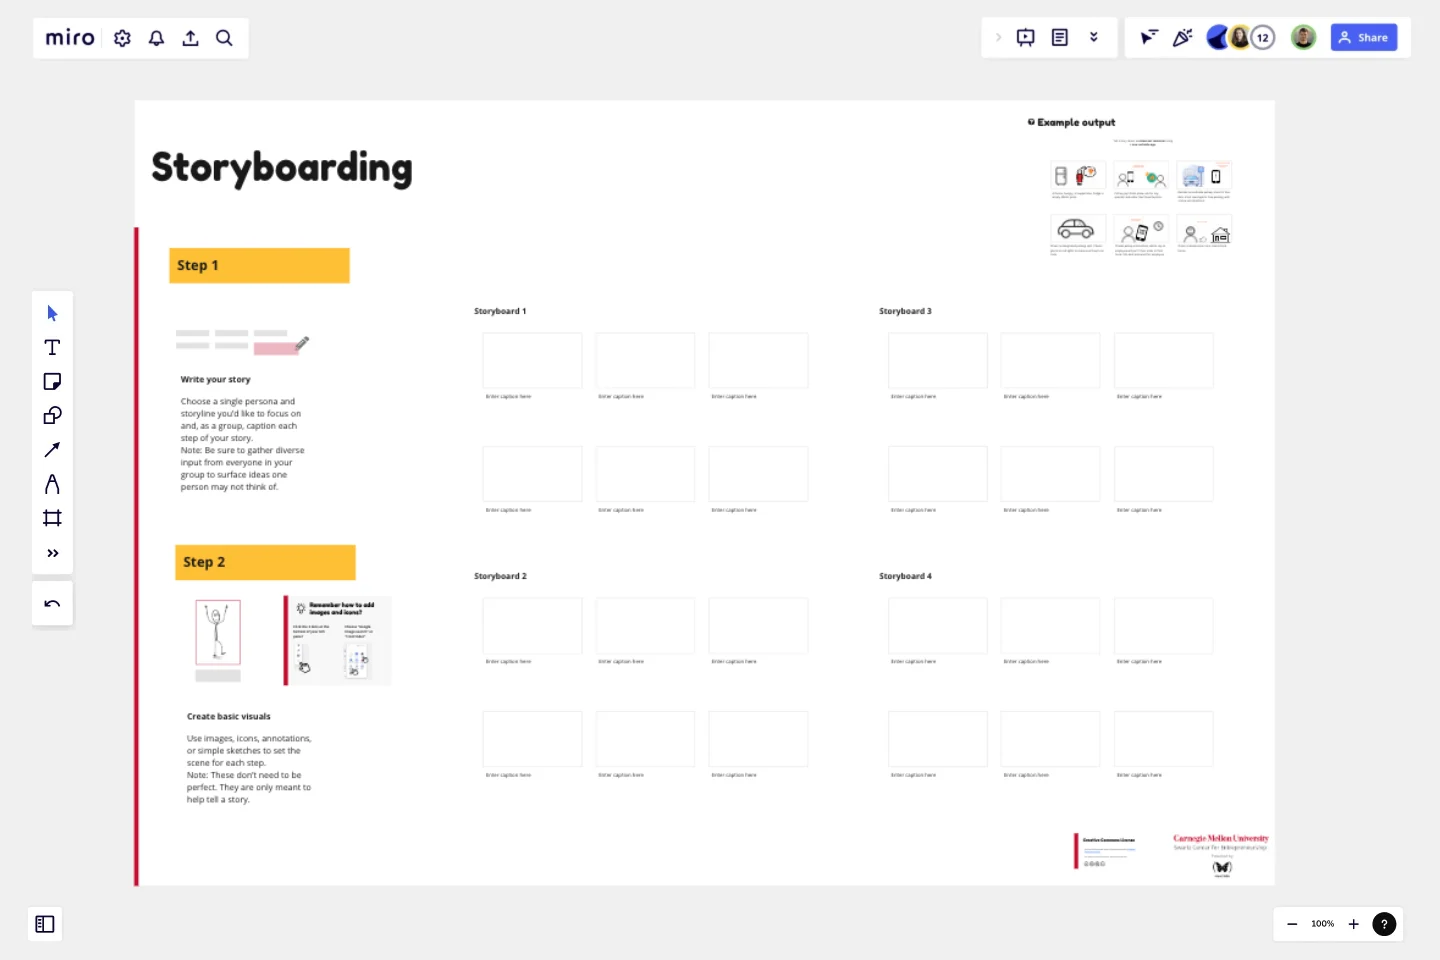
Storyboards are a great tool to map out either an experience that you want to create or an experience that you are imagining.
This process allows you to put it back in front of users to validate whether the needs you are expressing in the storyboard actually exist. What are the key moments, milestones, or ideas in an experience that we can react to? Get creative and put it out there!
Start by writing your story. Choose a single persona and storyline you’d like to focus on and, as a group, caption each step of your story. Be sure to gather diverse input from everyone in your group to surface ideas one person may not think of.
Next, you’ll want to create some basic visuals. Use images, icons, annotations, or simple sketches to set the scene for each step. These don’t need to be perfect. It’s important to keep in mind that they are only meant to help tell a story.
Collaborate with your team to find the best story!
This template was created by maad labs.
Get started with this template right now.
Fiction Storyboard
Works best for:
Storyboard, Planning, Design
Unleash your creativity with the Fiction Storyboard template. Perfect for writers and storytellers, this template helps you map out your fictional narratives, including plot points, character arcs, and scene transitions. It provides a structured framework to visualize your story's progression and ensure consistency. Use it to organize your ideas, explore different storylines, and create a compelling narrative that captivates your audience from start to finish.
Storyboard for User Experience Template
Works best for:
Storyboard
The Storyboard for User Experience template helps design seamless, user-friendly journeys. It maps out scenarios, actions, thoughts, and emotions to create a cohesive user experience. This template is perfect for UX designers, product teams, and developers aiming to enhance usability, reduce friction, and improve user satisfaction. Visualize interactions, identify pain points, and iterate designs for a more intuitive and engaging experience.
Visual Prototyping Template
Visual and emotional aspects play a vital role in determining a product or service's usability and user experience. To evaluate these aspects of your proposed solution, consider using the Visual Prototyping Template. By creating a model that closely resembles the real product or service, and gathering feedback from key stakeholders, you can assess whether the form of your creation is advantageous or detrimental.
Card Sorting Template
Works best for:
Desk Research, UX Design, Brainstorming
Card sorting is a brainstorming technique typically used by design teams but applicable to any brainstorm or team. The method is designed to facilitate more efficient and creative brainstorms. In a card sorting exercise, you and your team create groups out of content, objects, or ideas. You begin by labeling a deck of cards with information related to the topic of the brainstorm. Working as a group or individuals, you then sort the cards in a way that makes sense to you, then label each group with a short description. Card sorting allows you to form unexpected but meaningful connections between ideas.
Video Storyboarding Template
Videos can be a game-changer when presenting a new idea. To create an engaging video, structure your narrative effectively using a Video Storyboarding Template. This ensures your message is clear and easy to understand and can help you gain support and feedback.
Empathy Map for Food Ordering App
Empathy Map template aids in visualizing your users' experiences. It helps teams understand what users see, think, and feel, ensuring your product meets their needs. This tool is essential for building empathy and designing better user experiences.
