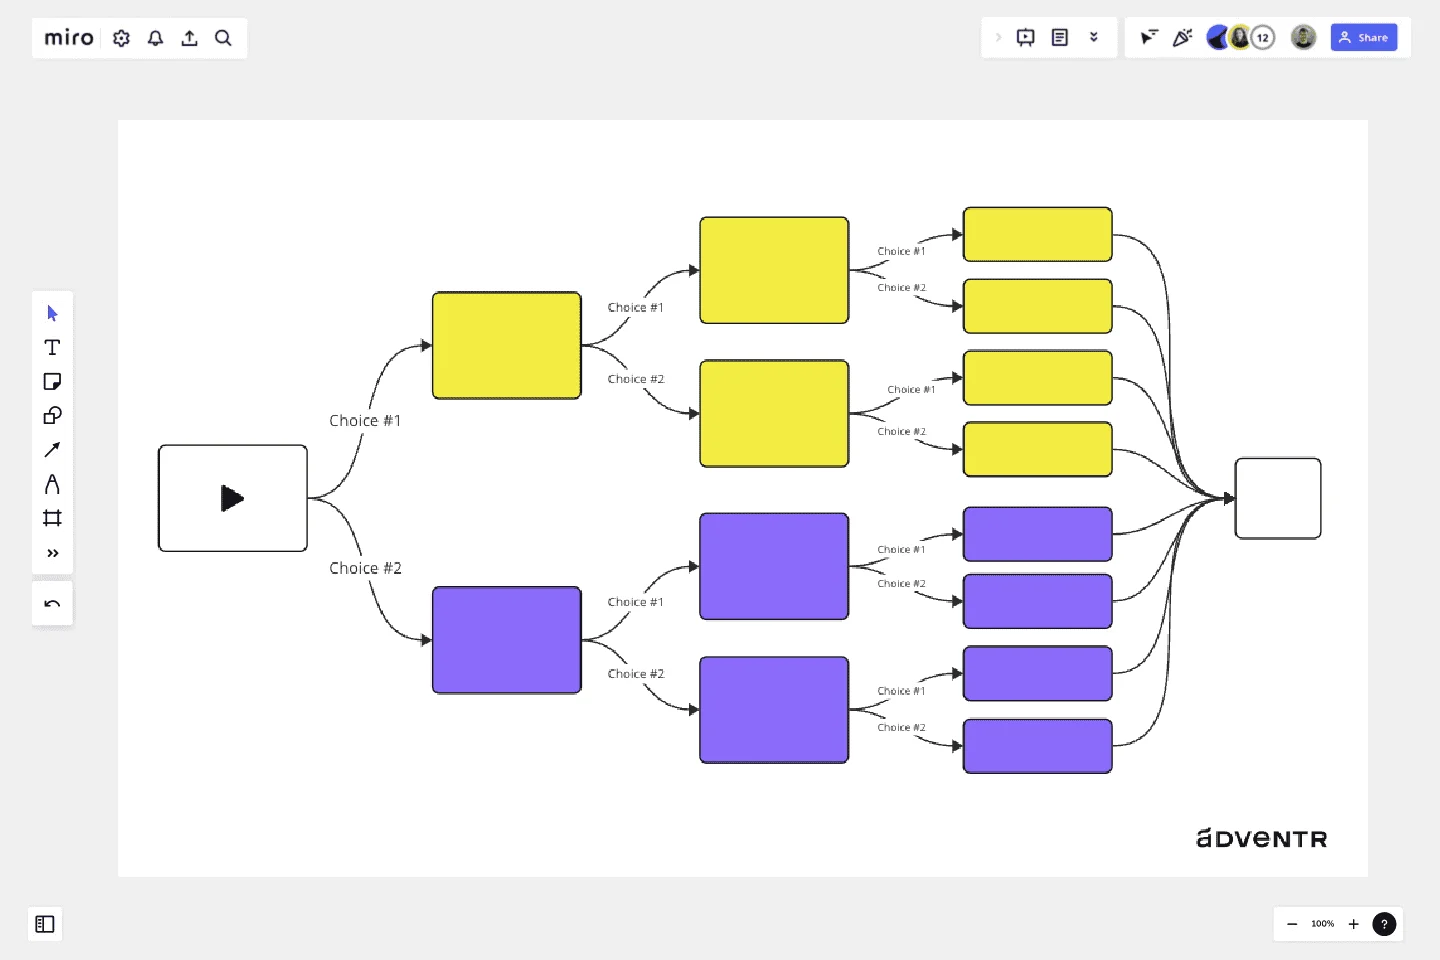
Interactive Video Storyboard Canvas
Embark on the creation of your interactive video with our thoughtfully designed branching storyboard template.
This intuitive roadmap is your guide through the captivating world of Adventr, where every choice leads to a unique path, weaving a tapestry of narrative possibilities.
Begin at the starting point, marked 'A1', where your audience's journey commences. From there, navigate through the initial pathways, offering the viewer a pivotal decision between 'Choice #1' and 'Choice #2', each leading to distinct scenarios B1 and B2, respectively.
This template was created by Adventr.
Get started with this template right now.
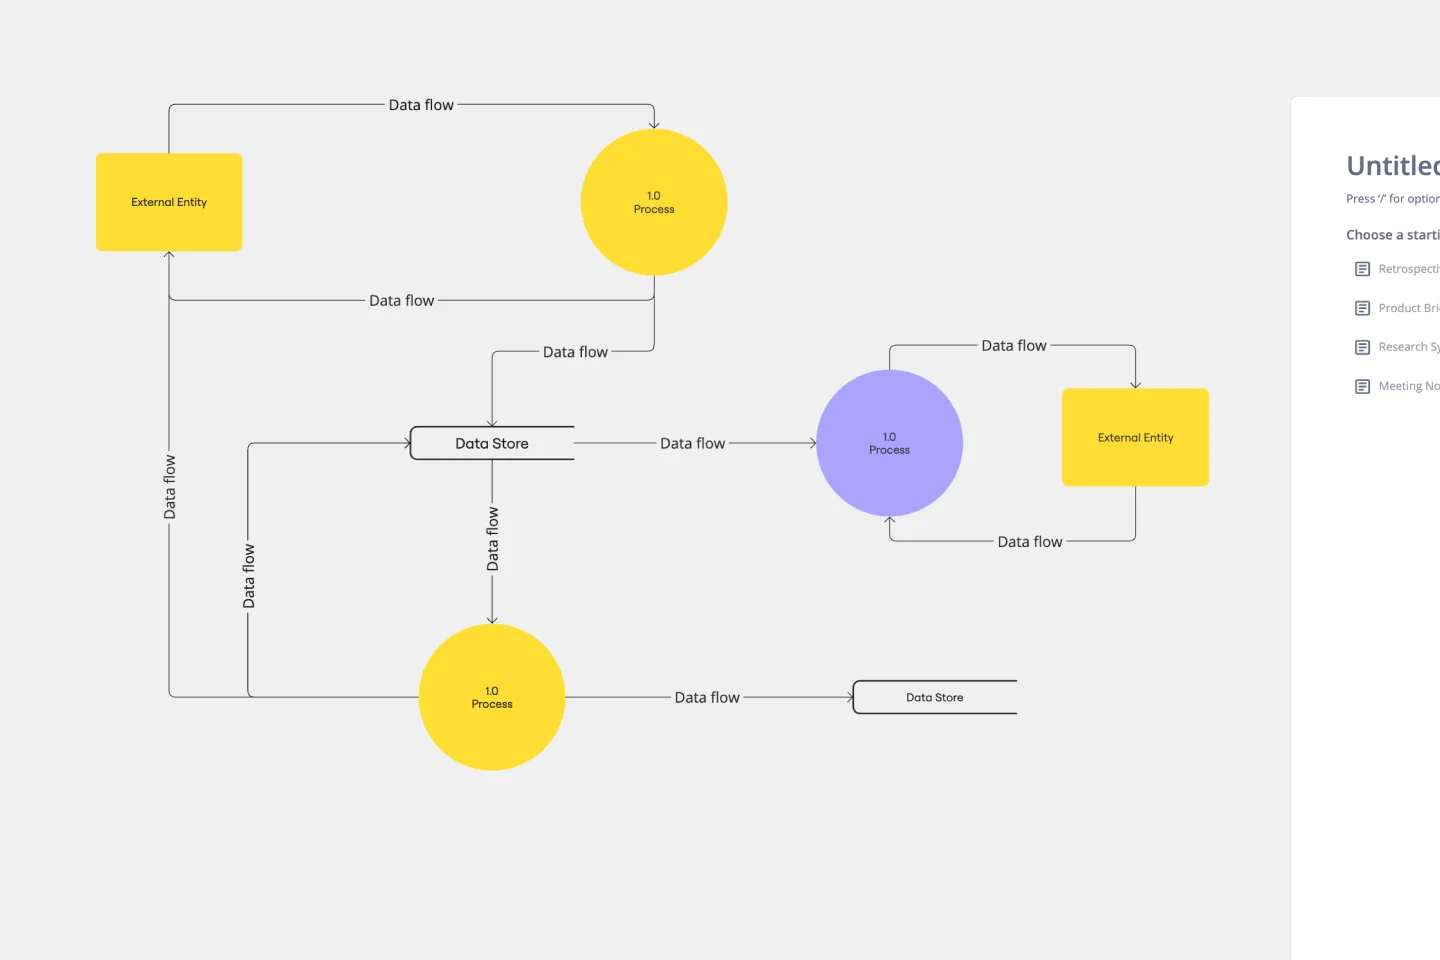
Data Flow Diagram Template
Works best for:
Flowcharts, Software Development, Diagrams
Any process can get pretty complex, especially when it has multiple components. Get a better grasp of your process through a data flow diagram (DFD). DFDs create a simple visual representation of all components in the flow of data and requirements in an entire system. They’re most often used by growth teams, data analysts, and product teams, and they’re created with one of three levels of complexity—0, 1, or 2. This template will help you easily build the best DFD for your process.
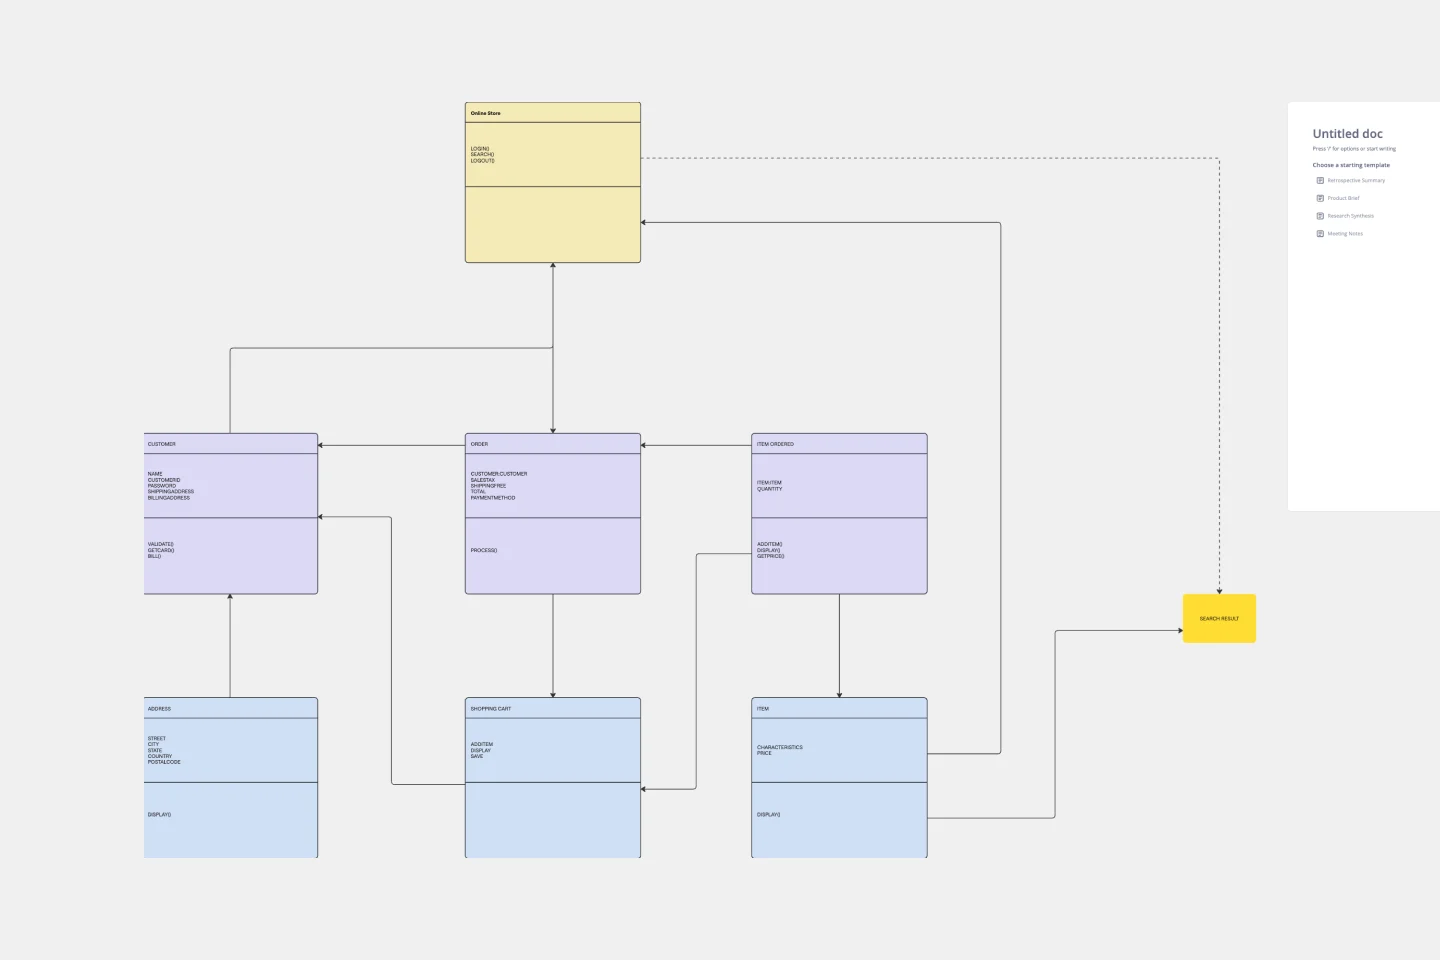
UML Diagram Template
Works best for:
Diagrams, Software Development
Originally used as a modeling language in software engineering, UML has become a popular approach to application structures and documenting software. UML stands for Unified Modeling Language, and you can use it to model business processes and workflows. Like flowcharts, UML diagrams can provide your organization with a standardized method of mapping out step-by-step processes. They allow your team to easily view the relationships between systems and tasks. UML diagrams are an effective tool that can help you bring new employees up to speed, create documentation, organize your workplace and team, and streamline your projects.
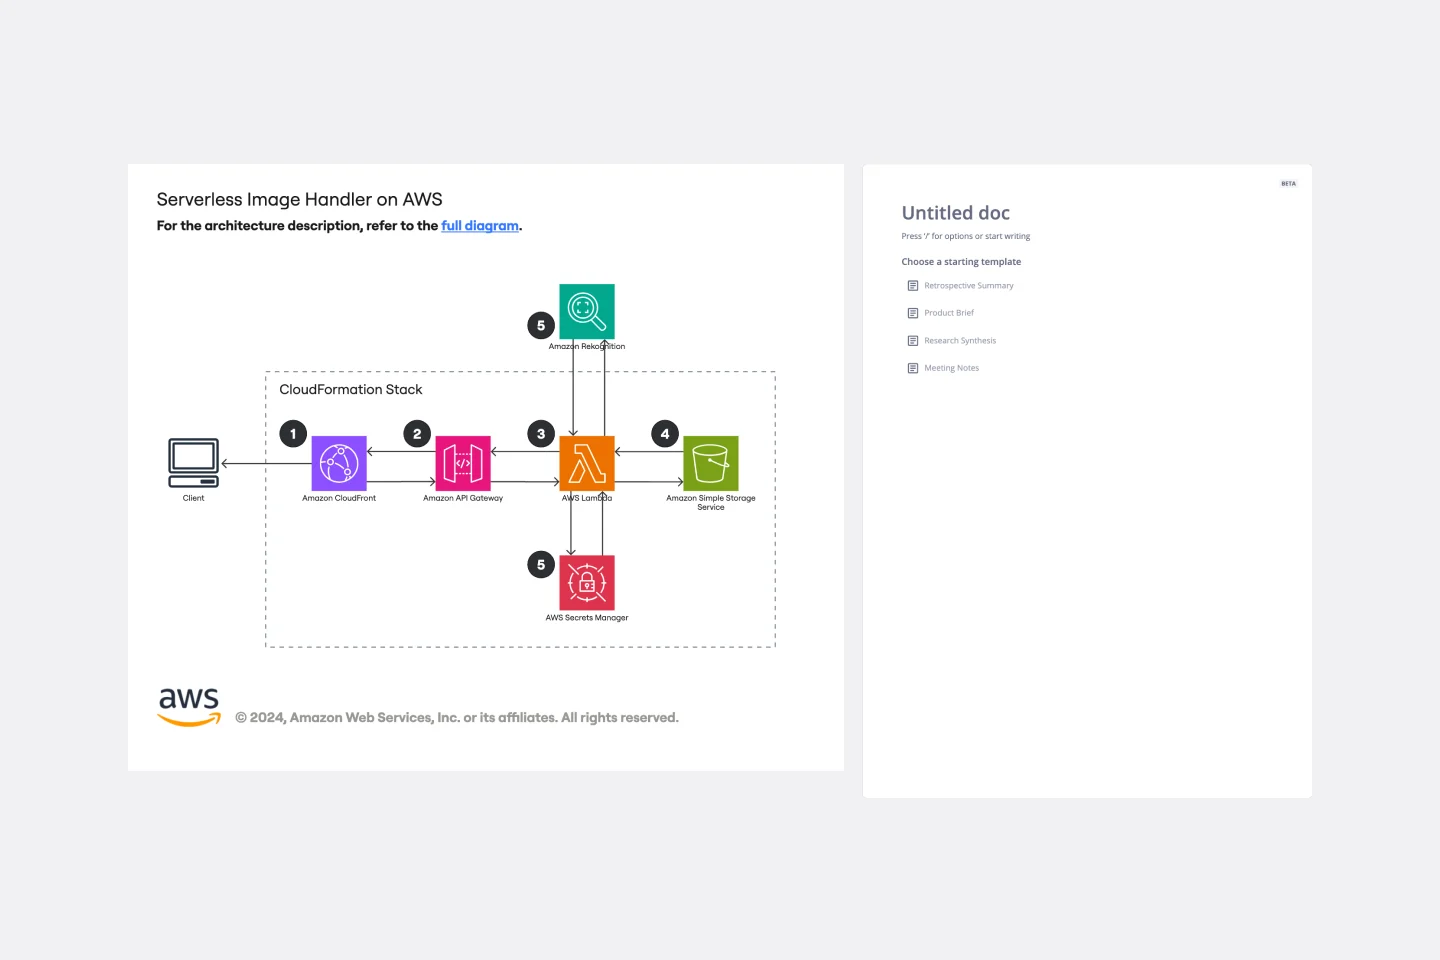
Serverless Image Handler on AWS Template
Works best for:
AWS
The Serverless Image Handler on AWS template is designed to facilitate the management and transformation of images in cloud-based projects without the need for server infrastructure management. It is particularly useful for applications and projects that require dynamic image management, offering benefits like efficiency, scalability, and seamless integration with AWS services. By incorporating this template into Miro boards or projects, teams can streamline their workflows, especially when dealing with digital assets or dynamic content, ensuring that their image-handling needs are met efficiently as they scale.

BPM
Works best for:
Diagramming
The BPM (Business Process Management) template is a visual tool for modeling, analyzing, and optimizing business processes. It provides a structured framework for documenting process flows, identifying bottlenecks, and improving efficiency. This template enables organizations to streamline operations, enhance productivity, and drive business performance. By promoting process transparency and agility, the BPM template empowers teams to achieve operational excellence and deliver value to stakeholders.
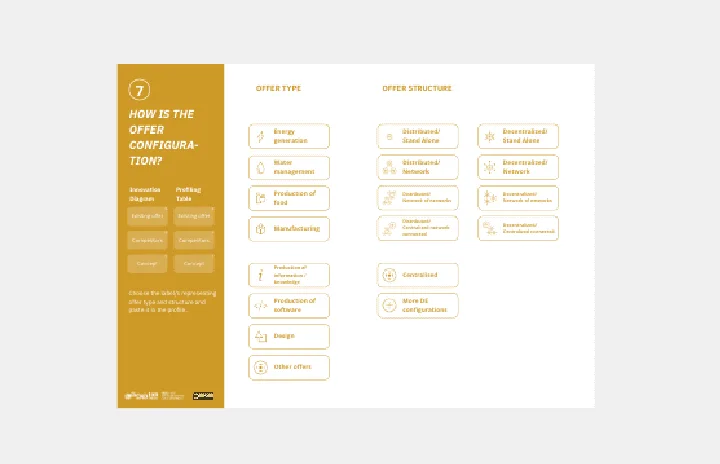
Innovation Diagram_S.PSS
Works best for:
Diagramming
The Innovation Diagram_S.PSS template offers a visual framework for mapping out the innovation process using the S.PSS (Service Product System Strategy) approach. It provides elements for defining service components, product features, and system interactions. This template enables teams to visualize and communicate their innovation strategy, facilitating alignment and collaboration across stakeholders. By promoting systematic innovation and holistic thinking, the Innovation Diagram_S.PSS empowers organizations to drive sustainable growth and competitive advantage through service and product innovation.
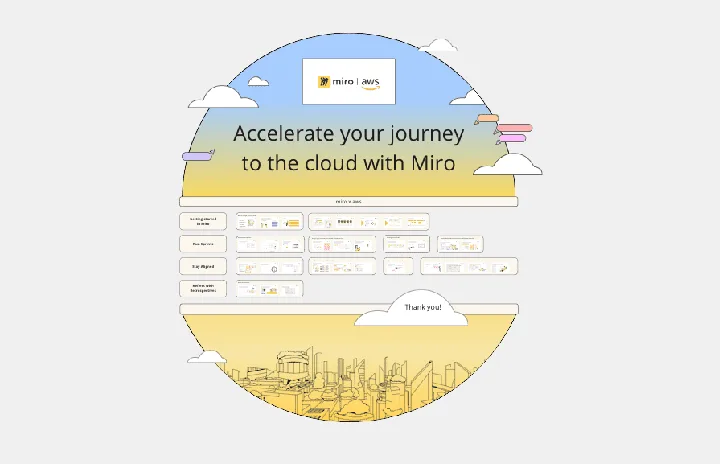
Miro x AWS: Accelerate your cloud journey
Works best for:
Diagramming
The Miro x AWS: Accelerate your cloud journey template offers a visual framework for planning and executing cloud migration and optimization projects using Amazon Web Services (AWS). It provides elements for mapping out cloud architectures, migration strategies, and cost optimization initiatives. This template enables teams to collaborate effectively, align on objectives, and accelerate their cloud journey with AWS services. By promoting collaboration and alignment, the Miro x AWS template empowers organizations to leverage AWS cloud technologies efficiently and achieve their business objectives effectively.