Stage-Gate Process Flowchart Template
Improve decision-making, mitigate risks, and drive project success with the stage-gate process flowchart template.
About the Stage-Gate Process Flowchart Template
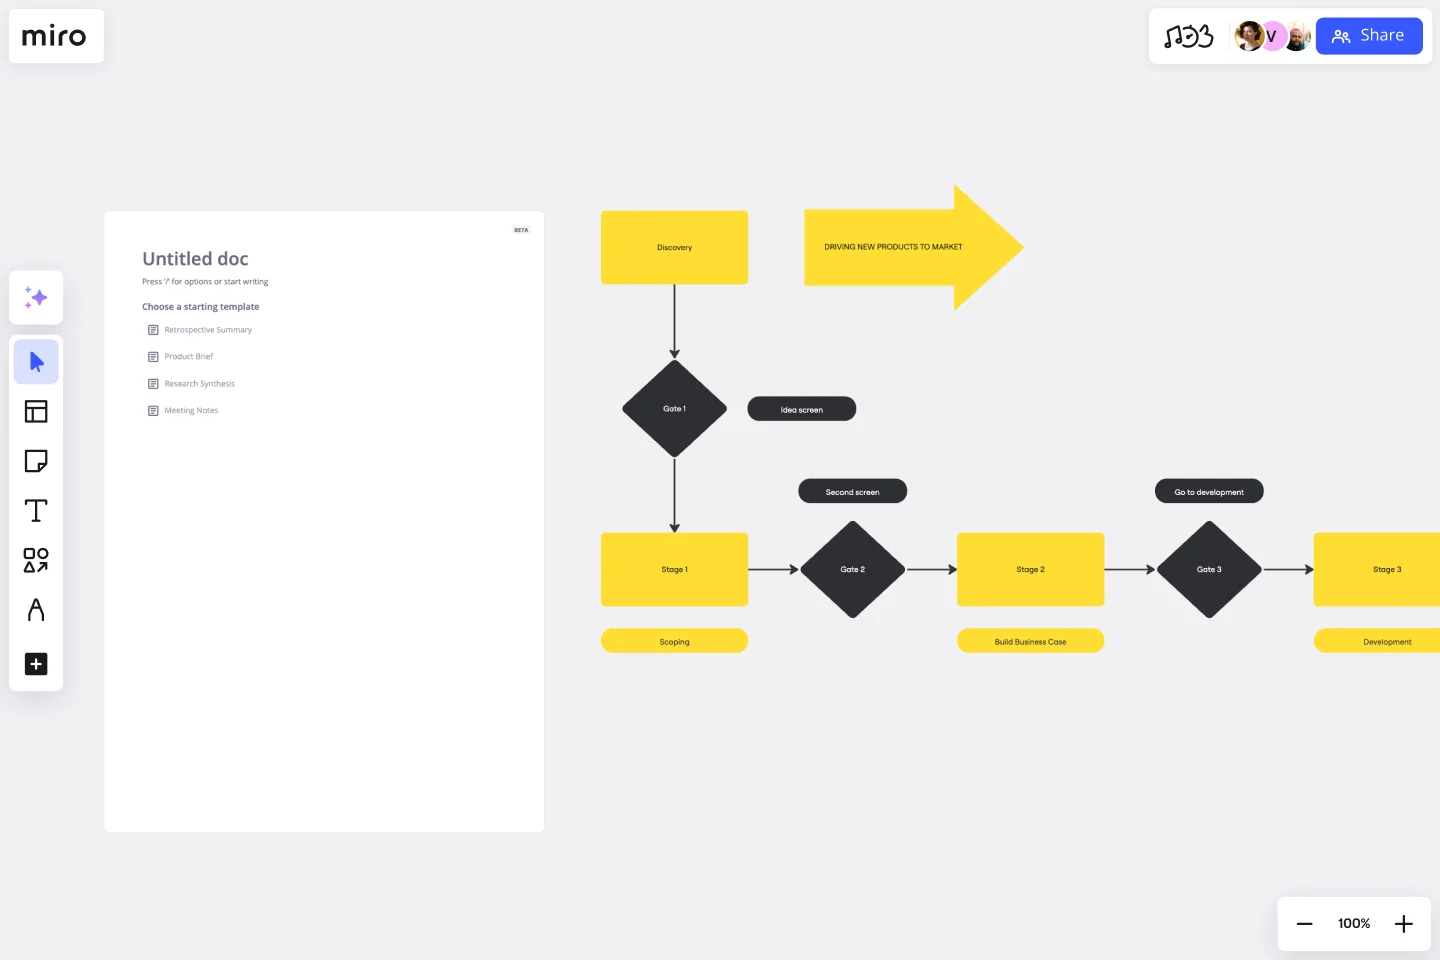
The Stage-Gate Process Flowchart Template is a significant asset for project management, designed to simplify the advancement of projects through different stages. This template provides a systematic approach that helps teams efficiently manage and monitor each phase of a project, starting from the beginning to completion. It guides teams through a sequence of checkpoints or "gates" where decisions are made before moving on to the subsequent stage.
This template is divided into sections representing a project's various stages and decision points. Each stage signifies a key phase in the project, such as ideation, planning, execution, and review. The decision points, positioned between stages, serve as checkpoints where progress is evaluated, and a decision is made to either continue, change, or stop the project. Using this template, you can systematically track progress, identify potential issues early on, and ensure that each project phase aligns with the objectives.
How to use the Stage-Gate Process Flowchart Template in Miro
Customize the template: Easily edit the template with just a few clicks. Change the stage names and descriptions to suit the project's specific needs.
Expand with diagramming tools: Use Miro's automated diagramming features to add more shapes and connector lines, enriching the flowchart with additional details and complexities as needed.
Integrate artifacts: Enhance the flowchart by adding any relevant artifacts directly onto the Miro board. This could include documents, images, or links, providing context and information at each stage.
Collaborate and share: Invite team members to view, edit, and comment on the flowchart, fostering a collaborative environment where everyone stays informed and aligned.
Why should you use a Stage-Gate Process Flowchart Template?
Improved project clarity: Clearly define each project stage, ensuring team members understand their roles and responsibilities at every phase.
Informed decision-making: The gate checkpoints facilitate informed decisions based on thorough project progress and feasibility evaluations.
Risk mitigation: Early identification and management of potential risks and issues, reducing the likelihood of project delays or failures.
Efficient resource allocation: Allows for the best distribution and utilization of resources throughout the project lifecycle.
Facilitates communication: Provides a visual representation of the project plan, improving Communication and understanding among stakeholders.
Can the template be customized for different project types?
Yes, the template is highly adaptable and can be tailored to fit a wide range of project types and industries.
How does the template assist in risk management?
The template allows for regular assessments at each gate, enabling teams to identify and address risks early in the project lifecycle.
Get started with this template right now.
ICOR® Workflows
Works best for:
Flowcharts, Diagrams, Mapping
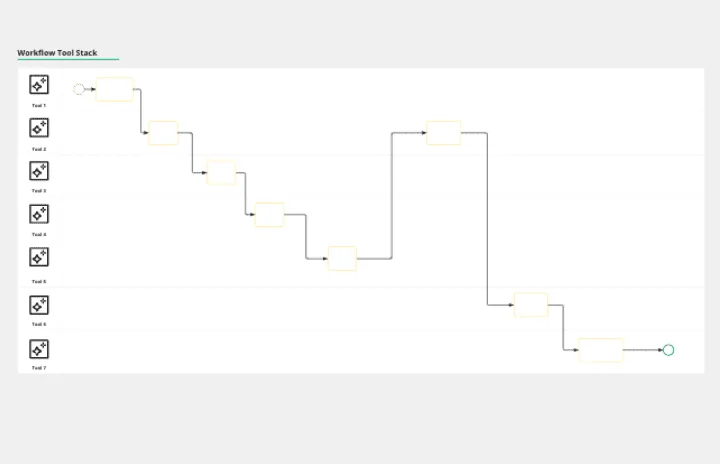
The ICOR® Workflows template offers a visual framework for documenting and optimizing business processes according to the ICOR® (Input, Control, Output, Resources) methodology. It provides elements for defining process inputs, controls, outputs, and resource requirements. This template enables organizations to streamline operations, enhance quality management, and achieve process excellence. By promoting systematic process documentation and analysis, the ICOR® Workflows template empowers organizations to optimize efficiency, minimize risks, and deliver value to stakeholders effectively.
Euler Diagram Template
Works best for:
Business Management, Operations, Diagrams
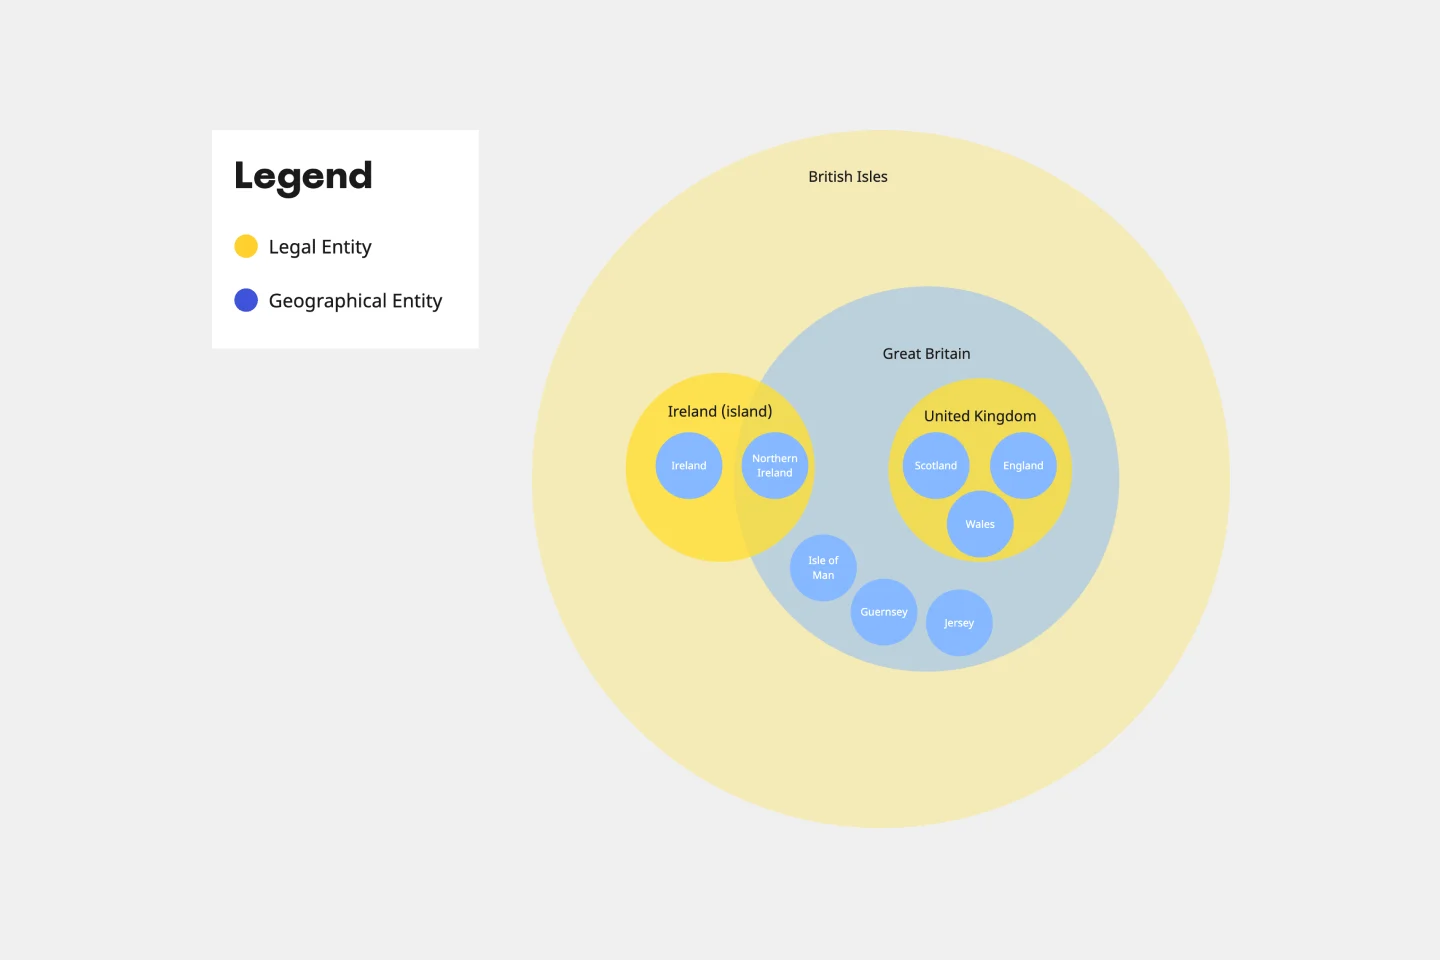
Euler diagrams are valuable for showing different relationships between subjects by representing them with circles or "cells." Euler diagrams are frequently used in IT systems to show how objects relate to one another and how they interact. However, you can use them for any sort of explanation that needs to show connections.
Cisco Recommended Security Architecture Template
Works best for:
Software Development, Diagrams
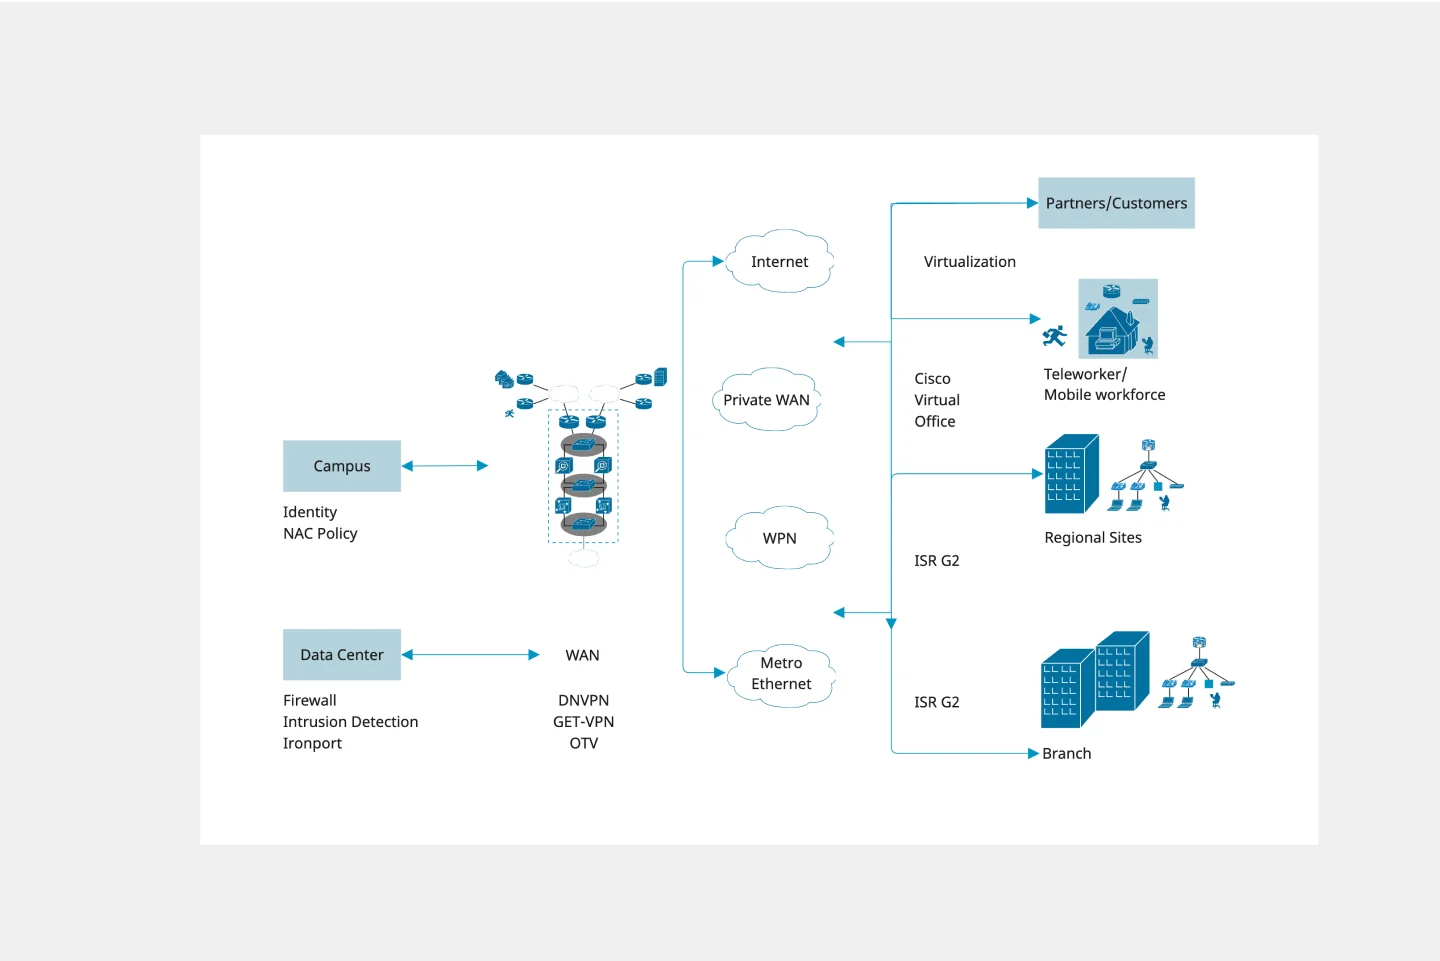
Cisco offers data center and access networking solutions built for scale with industry-leading automation, programmability, and real-time visibility. The Cisco Recommended Security Architecture uses Cisco elements to visually show the network design of Cisco networks.
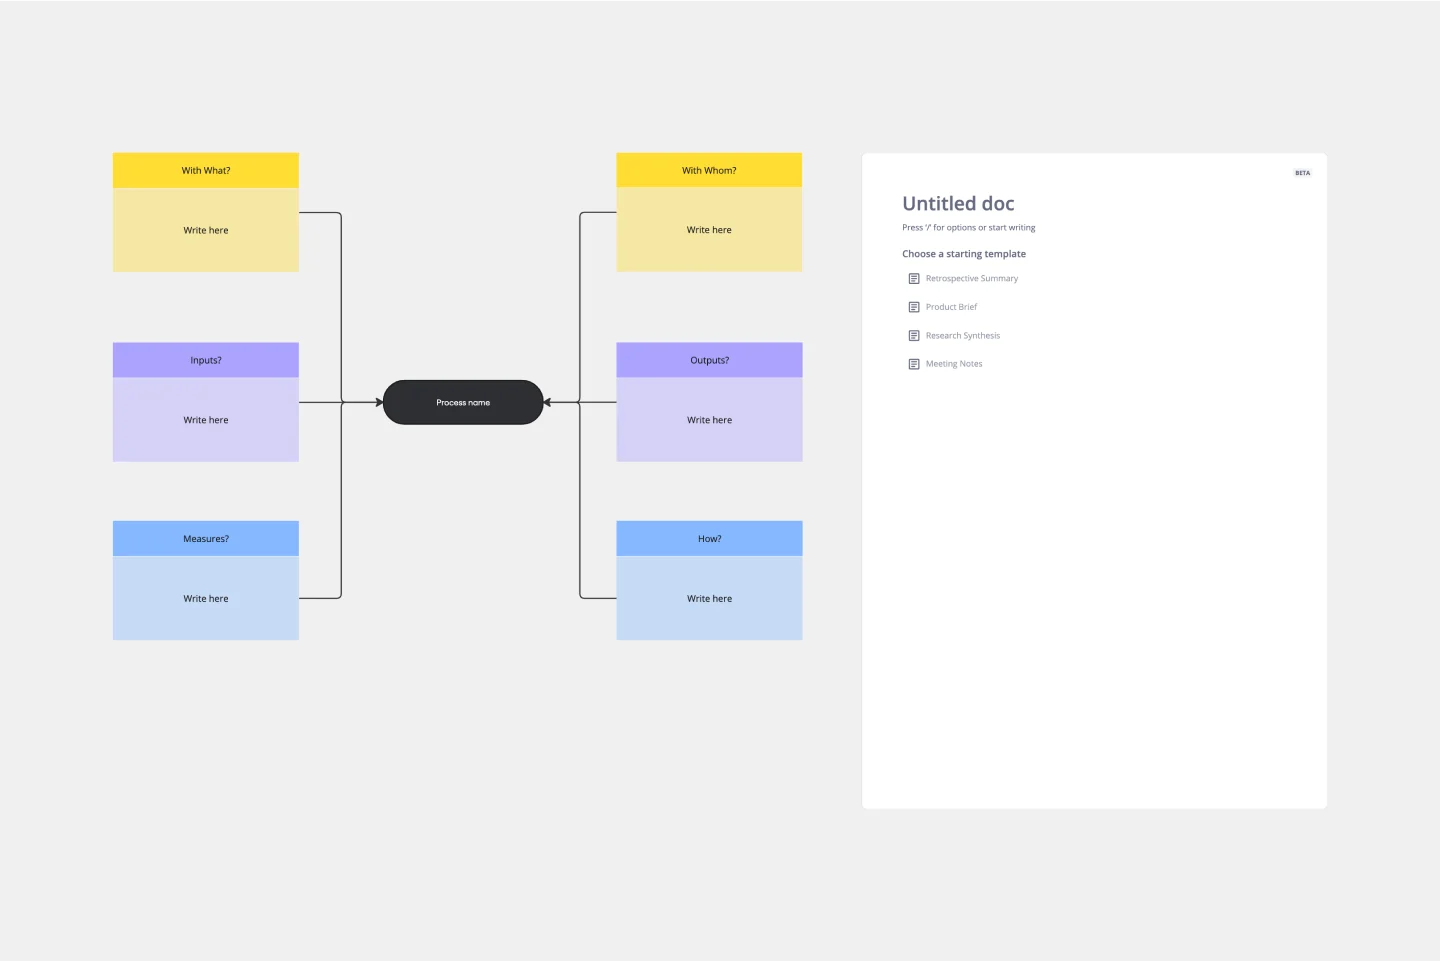
Turtle Diagram Template
Works best for:
Diagramming
The Turtle Diagram Template is an essential tool for capturing the essence of a process. It offers many benefits, but one stands out: it fosters clear and comprehensive communication within teams. By breaking down processes into digestible components, the template creates a common ground for discussion. It helps team members unfamiliar with certain processes or from different departments collaborate effectively by ensuring everyone's on the same page about the inputs, outputs, roles, resources, and procedures. This is crucial for organizations that aim to maintain coherence in quality management practices and drive collective efforts toward operational excellence.
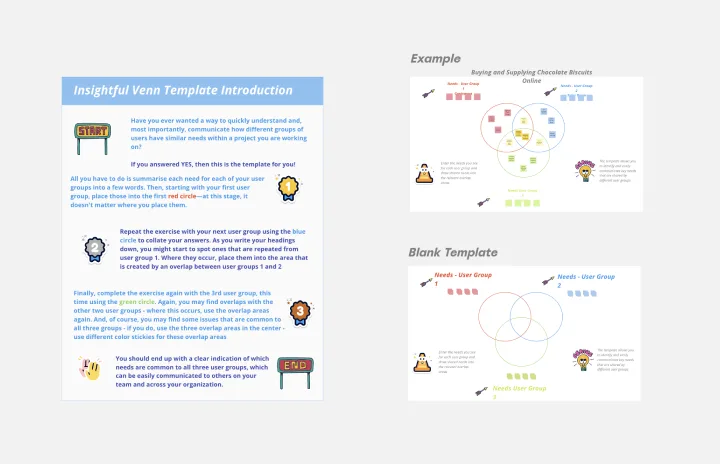
Insightful Venn
Works best for:
Venn Diagram
Discover insights and visualize data relationships with the Insightful Venn template. This tool helps you compare multiple datasets, identify intersections, and understand unique and common elements. Use it for data analysis, research, and presentations to communicate complex information effectively. Perfect for analysts, educators, and researchers aiming to convey data-driven insights visually.
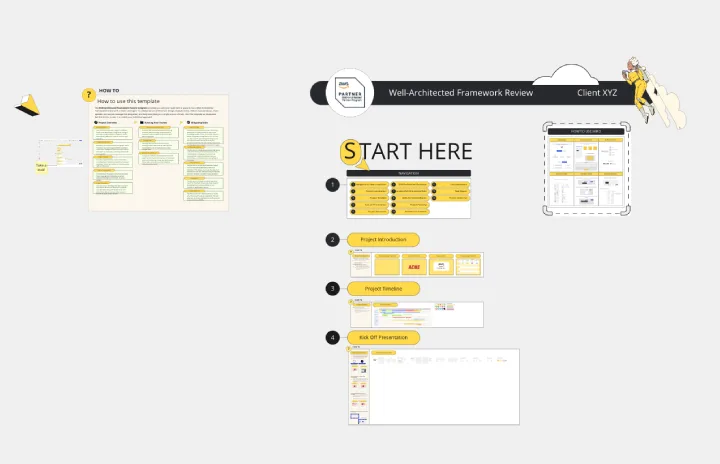
Miro for AWS Well-Architected Framework Reviews
Works best for:
Diagramming, AWS
This AWS Well-Architected Framework Review (WAFR) template provides you and your team with a dedicated space to conduct a Well-Architected Framework Review with a client.