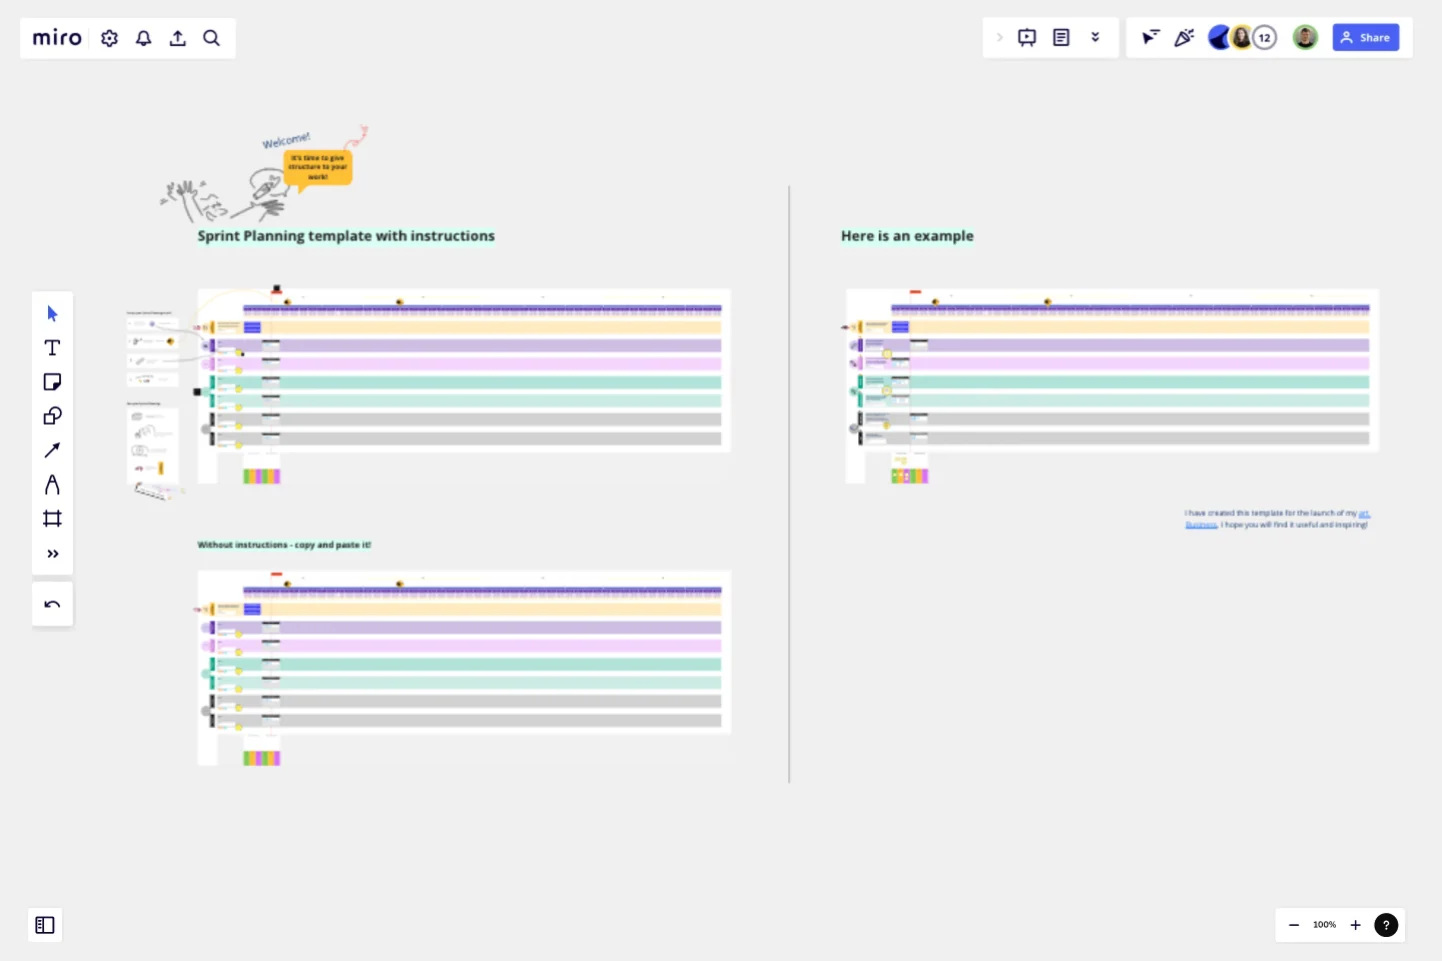
Sprint Planning by Piera Mattioli
The Sprint Planning board has been designed to enable every person or team to have a structured way of working and to achieve specific goals by defining weekly/ biweekly/ monthly tasks, and by creating moments of reflections.
How to set up the Sprint Planning board:
1. Define your workstreams/ projects, make it visual and select an icon to easily recognize it!
2. For each workstream/ project write down the goal you are trying to achieve;
3. How will you measure success? Define key results for each workstream/ project;
4. If needed prioritize workstreams/ projects.
How to run your Sprint Planning meeting:
1. Define your cadence, you might have Sprint Planning weekly, biweekly or monthly. If in a team, assign a team member to facilitate the meeting;
2. Always take the time to reflect on the previous Sprint, only by cultivating this habit you can improve your way of working!
3. Design your agenda and make it fun for the people to participate by adding an ice breaker that can foster connection!
This template was created by Piera Mattioli.
Get started with this template right now.
Objectives and Key Results (OKRs) Template
Works best for:
Leadership, Strategic Planning, Project Planning
Clarity, focus, and structure — those are the key ingredients to feeling confident in your company’s directions and decisions, and an OKR framework is designed to give them to you. Working on two main levels — strategic and operational — OKRs (short for objectives and key results) help an organization’s leaders determine the strategic objectives and define quarterly key results, which are then connected to initiatives. That’s how OKRs empower teams to focus on solving the most pressing organizational problems they face.
Competitor Product Research
Works best for:
Product Management, Planning
The Competitor Product Research template assists product teams in analyzing competitor offerings and market landscapes effectively. By identifying competitor strengths, weaknesses, and market trends, this template enables teams to uncover insights and opportunities for differentiation. With sections for conducting feature comparisons, SWOT analysis, and market positioning assessments, it facilitates informed decision-making and strategic planning. This template serves as a valuable resource for gaining competitive intelligence and driving product innovation and differentiation.
Project Timeline Template
Works best for:
Project Management
The Project Timeline Template simplifies project management. Illustrating tasks, milestones, and deliverables on a calendar visually shows teams a project's progression. One of its standout benefits is its ability to foster clarity. With this template, project milestones are translated into an easily digestible format, enabling team members to quickly comprehend the entirety of the project's scope and sequence, thereby enhancing productivity and reducing potential misunderstandings.
3 Horizons of Growth Template
Works best for:
Leadership, Strategic Planning, Project Planning
Featured in The Alchemy of Growth, this model gives ambitious companies a way to balance the present and the future—in other words, what’s working in the existing business and what emerging, possibly-profitable growth opportunities lie ahead. Then teams across the organization can make sure that their projects map to and support the organization’s goals. The 3 Horizons of Growth model is also a powerful way to foster a culture of innovation—one that values and depends on experimentation and iteration—and to identify opportunities for new business.
AARRR Template
Works best for:
Marketing, Strategic Planning, Project Planning
Sometimes called “Pirate Metrics” because of the name (go ahead, say it, it’s fun), AARRR is a valuable approach for startups to consider. That’s because AARRR stands for Acquisition, Activation, Retention, Referral, and Revenue—five key types of user behavior that are highly measurable and drive growth. Ask and answer the right questions around each of these five factors, and you’ll be able to establish clear goals and identify the best steps to help reach them.
8 Different Ways to Organize Your Backlog
Works best for:
Agile
Explore 8 different techniques for managing and prioritizing work effectively with this template. From prioritization matrices to story mapping, it offers a comprehensive overview of backlog management strategies. By understanding the strengths and limitations of each approach, teams can tailor their backlog organization to optimize workflow, empowering teams to stay organized and focused on delivering value.
