Spider diagram templates
Miro's spider diagram templates help you explore ideas and visualize relationships effortlessly. Whether you're brainstorming, planning, or organizing, these templates provide a clear structure to map concepts, identify connections, and spark new insights.
Spider Diagram Template
Works best for:
Diagramming, Mapping
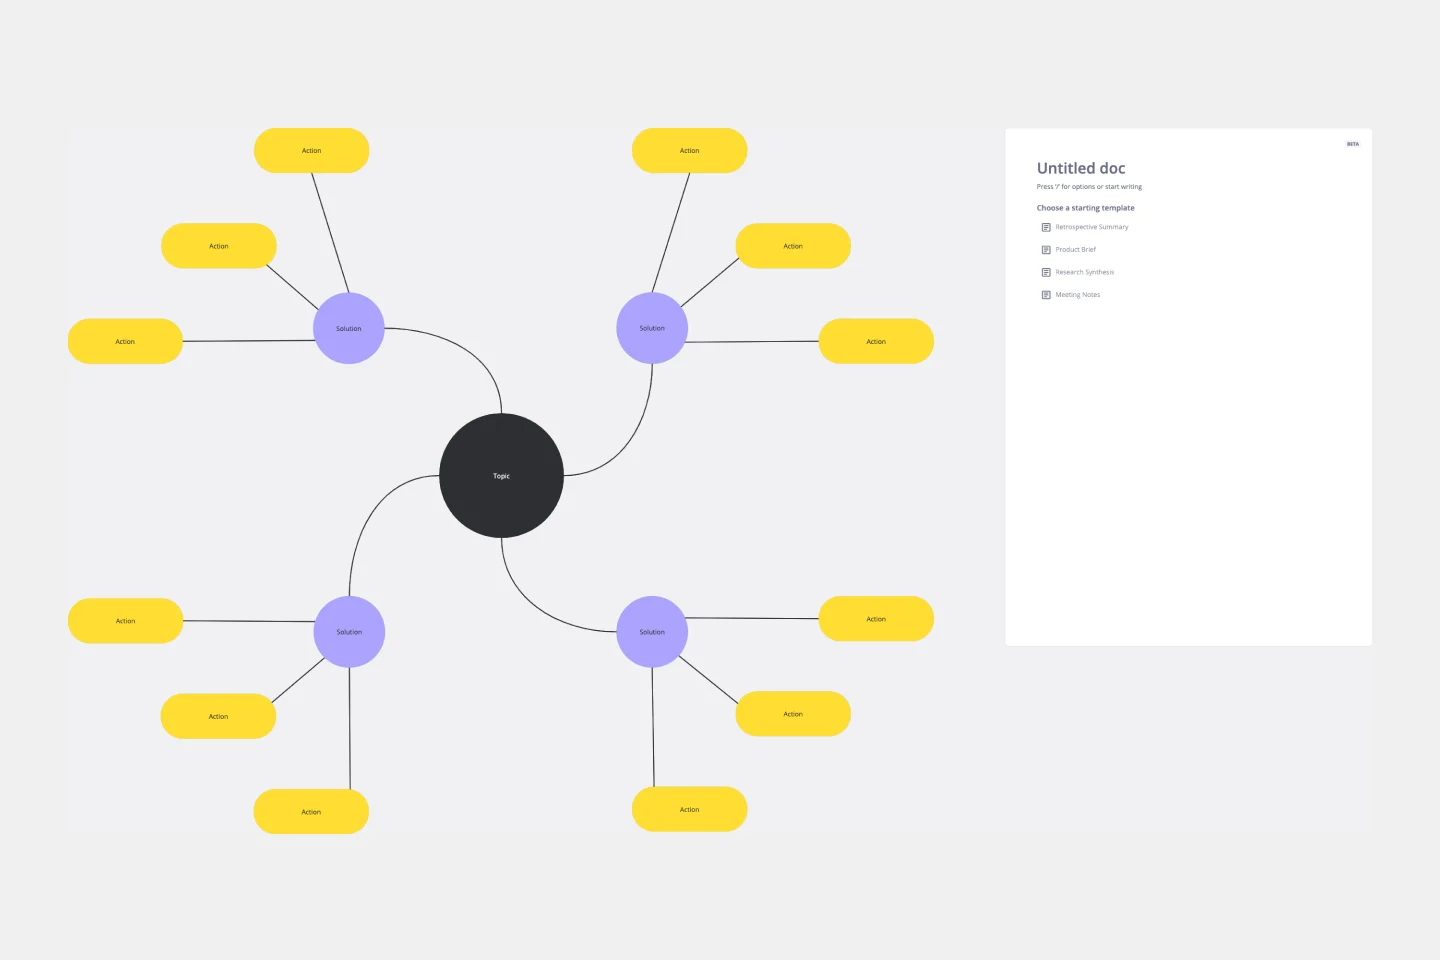
Perfect for brainstorming sessions, project planning, or simply organizing thoughts, the Spider Diagram Template allows you to create 'legs' branching out from a central idea, representing related topics or subtopics.
Ecomap Template
Works best for:
Strategy & Planning, Diagramming
The Ecomap Template illustrates the multifaceted relationships and environmental interactions encircling an individual or entity. Determine crucial patterns and dynamics by providing a clear and comprehensive visualization of how different systems intertwine and influence each other.
Web Diagram Template
Miro's Web Diagram Template simplifies complex project organization and promotes effective communication. It allows users to easily connect elements and gain a comprehensive understanding of complex relationships, making it a versatile and invaluable asset for diverse projects.
Join thousands of teams collaborating and doing their best work on Miro.
Sign up freeAbout the Spider Diagram Templates Collection
Spider diagrams, also known as mind maps, are a powerful tool for visualizing ideas and concepts. Our spider diagram templates are designed to help people brainstorm, organize thoughts, and explore connections between different ideas. These templates are versatile and can be used for various purposes, from project planning to problem-solving.
Why you'll love our spider diagram templates
Using Miro's spider diagram templates offers many benefits:
Enhanced brainstorming: Quickly capture and organize ideas during brainstorming sessions. The visual format helps identify relationships and hierarchies among concepts.
Clarity and focus: Break down complex topics into manageable parts, making it easier to focus on specific areas without losing sight of the bigger picture.
Collaboration: Miro's editable spider diagram templates allow team members to collaborate in real-time, ensuring everyone is on the same page and contributing to the discussion.
Flexibility: Start with a blank spider diagram template or customize an existing one to fit your specific needs. The templates are fully editable, allowing you to adjust them as your project evolves.
How to use the spider diagram templates in Miro
Select a template: Choose a spider diagram template from Miro's template library. You can start with a blank spider diagram template or select an editable spider diagram template that suits your needs.
Add your main idea: Place your central concept or topic in the center of the diagram. This will be the starting point for your brainstorming session.
Branch out: Create branches from the central idea to represent related subtopics or categories. Use short phrases or keywords to keep it concise.
Expand further: Add more branches to each subtopic to explore ideas in greater detail. This hierarchical structure helps in organizing thoughts logically.
Customize and collaborate: Use Miro's tools to customize your diagram. Add colors, icons, and images to make it visually appealing. Invite team members to collaborate and contribute in real-time.
Review and refine: Regularly review and refine your spider diagram as your project progresses. Update it with new information and insights to keep it relevant.
By leveraging Miro's spider diagram templates, teams can brainstorm more effectively, visualize complex ideas, and collaborate seamlessly, ultimately helping them to thrive in their projects.
