SIPOC Template
Identify all the relevant elements of a process improvement plan. Use the SIPOC template to document the working process from beginning to end.
About the SIPOC Diagram Template
The SIPOC model brings transparency and alignment to a process. This template offers a quick, convenient way to create a SIPOC diagram with minimal fuss. Use this visual tool to document the inputs and outputs of a process and share the final product with the rest of your team.
What is a SIPOC diagram?
A SIPOC diagram enables you to summarize the inputs and outputs of a process in the form of a customized table. This allows teams to identify relevant aspects of a process improvement project before starting work. SIPOC is useful when defining a complicated project that isn't necessarily well-scoped.
SIPOC is an acronym for Suppliers, Inputs, Process, Outputs, and Customers. The name invites the team to think about the suppliers of your process, the inputs to the process, the process itself, the outputs that you produce, and the customers who receive those outputs.
A SIPOC diagram can help you answer questions like:
Who supplies inputs to this process?
Who are the customers?
What are their needs?
What specifications are placed on inputs?
How to use the SIPOC diagram template in Miro
Here’s a step-by-step walkthrough of how to use the SIPOC diagram template to create your own diagram:
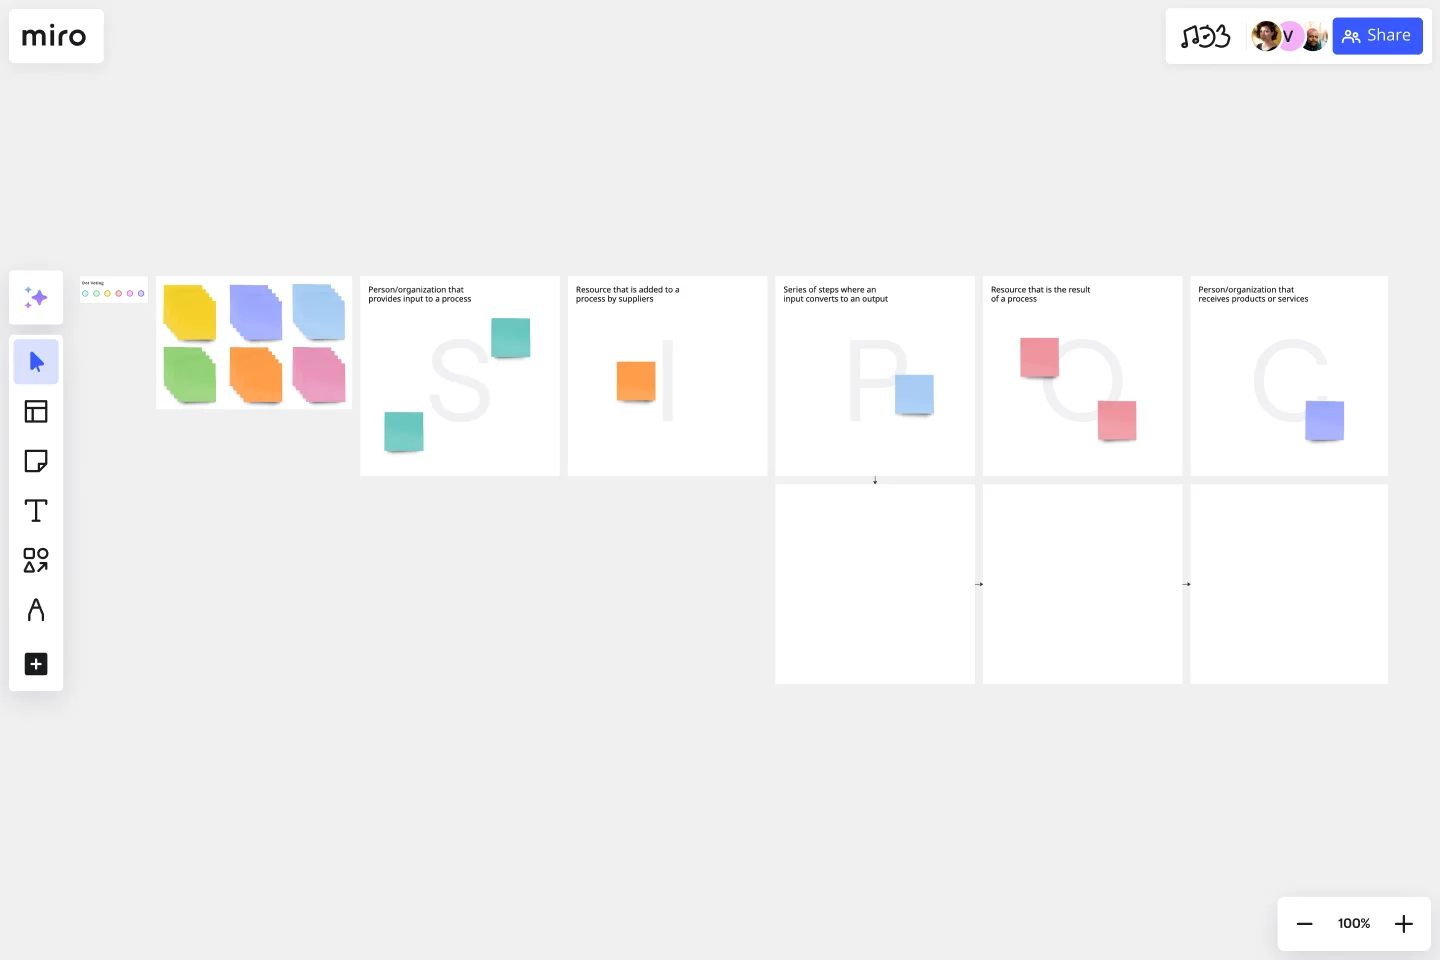
The SIPOC diagram template has the following sections under each letter:
S for suppliers
I for inputs
P for process
O for outputs
C for customers
Add the relevant information under each section with sticky notes, text, or any other artifact you see fit.
The Process section is organized so you can map a process chain, allowing information to be quickly and easily entered. Since the idea is to identify each step in a process from start to finish, others can add steps in an automatically growing chain.
Once the first step is identified, the blue circle can be clicked to automatically add another step in the process. This can be repeated until all steps of the process have been entered. The process will then be displayed in an easily understood visual format.
Benefits of using a SIPOC diagram template
Here’s how your team can benefit from using the SIPOC template:
Visual planning: A SIPOC diagram is a great tool for bringing a process into focus before any actions are taken. It offers an excellent preproduction stage that allows issues to be ironed out in advance.
Streamline processes: A SIPOC diagram can act as an improvement tool for processes or projects that have already been completed. Even if the process or workflow was a success, the diagram still provides an easy way to find areas for improvement.
Enhanced communication: Project teams and individuals are made aware of all aspects of the project or process in an easily understood and quickly digested visual tool format. The SIPOC template provides a full perspective for your team on a single page.
Better collaboration: The tool helps your team identify all persons or organizations providing input into a process. This helps everyone understand what input they are providing and how that input relates to all other aspects of the process.
Customer-centric: Customer requirements aren't only identified, but specific expectations are also highlighted. Therefore, all parties involved can appreciate the ultimate goal of the process and aim toward it more efficiently.
What is SIPOC used for?
The SIPOC Diagram is used to plot out the various steps of a process. It includes everyone involved in the process, as well as specific customer requirements. The diagram can serve either to effectively visualize a process before it is acted on or to improve a process that's already in effect. It isn't necessary to include detailed steps when creating a diagram but rather to identify all persons and parties involved.
What do I do after SIPOC?
Depending on what the SIPOC Diagram is used for, the steps that follow will differ. If the diagram was used to plan a process, the next step would be implementation. This would include contacting relevant parties, informing them of the strategy, and moving forward into action. It’s a good idea to provide all parties with the finished SIPOC Diagram for reference. If the SIPOC Diagram was used to improve an existing process, the next steps would be to inform all parties involved of any inefficiencies or problems uncovered and agree steps to tackle them. Again, providing the diagram would be necessary.
What is the difference between SIPOC and a process map?
A SIPOC diagram is different from a process map, otherwise called a flow chart, in several ways. Essentially, a process map is a simplified version of a SIPOC diagram, identifying only the steps involved in a process. A SIPOC Diagram aims to identify the process and the parties involved in each step.
Can I collaborate with others using a SIPOC diagram template?
Yes, collaboration is often encouraged when creating a SIPOC diagram. Input from various team members and stakeholders can provide a more comprehensive understanding of the process.
Can a SIPOC diagram be used in various industries?
Yes, SIPOC diagrams are versatile and can be applied across different industries, including manufacturing, services, healthcare, and more.
Get started with this template right now.
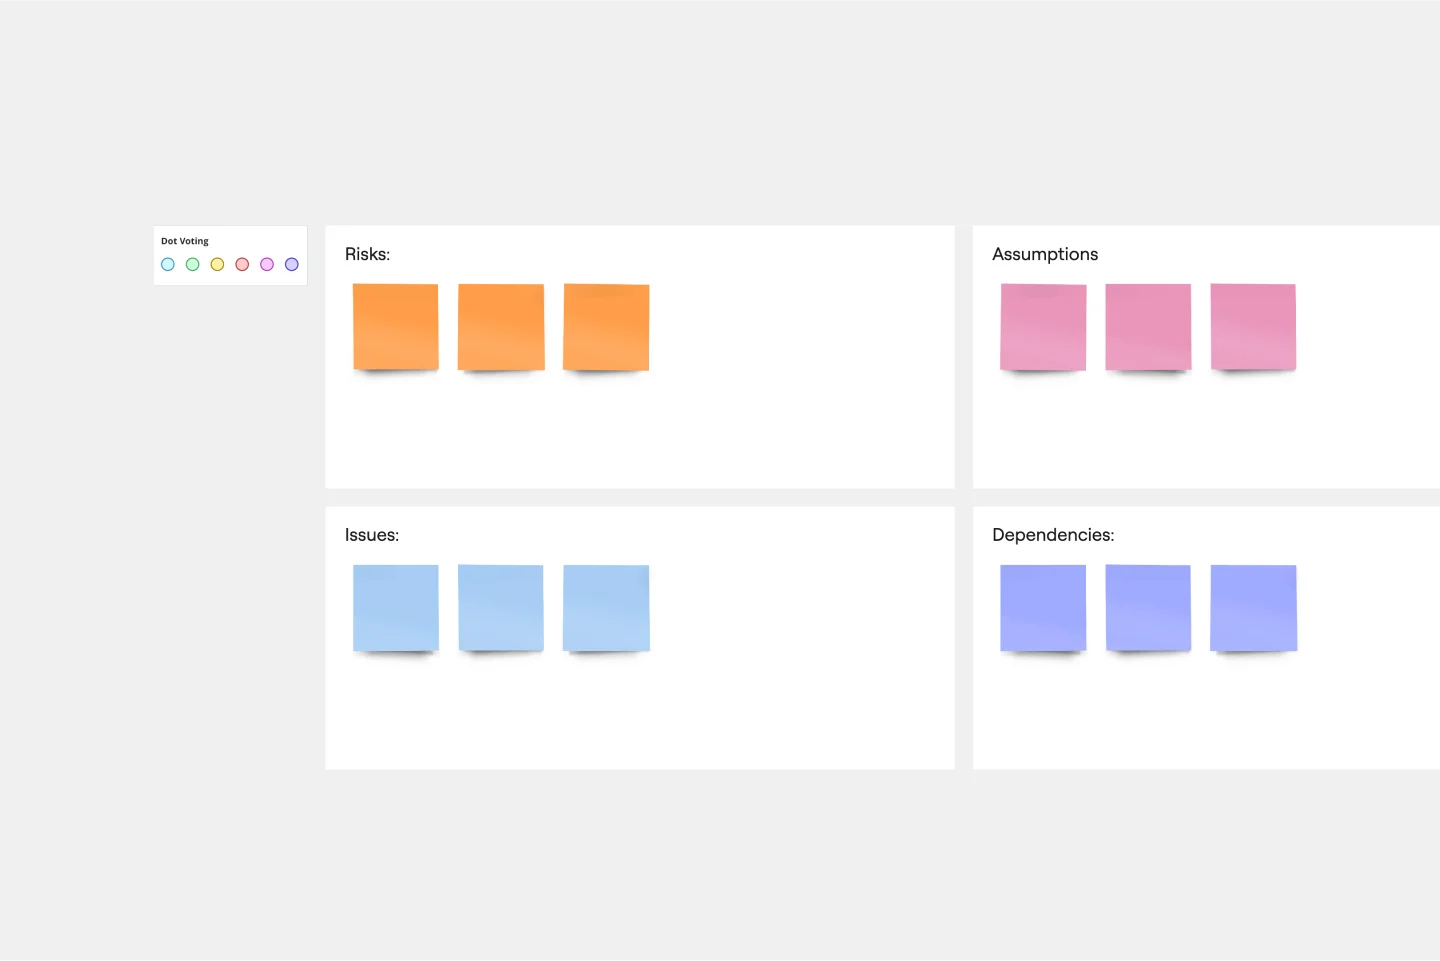
RAID Log Template
Works best for:
Agile Methodology, Project Management, Agile Workflows
Use the RAID Log template to better understand potential risks, assumptions, issues, and dependencies relating to an upcoming project. With this information, you can make effective contingency plans and prepare your resources accordingly. You’ll know what could go wrong throughout the project and how to fix the problem.
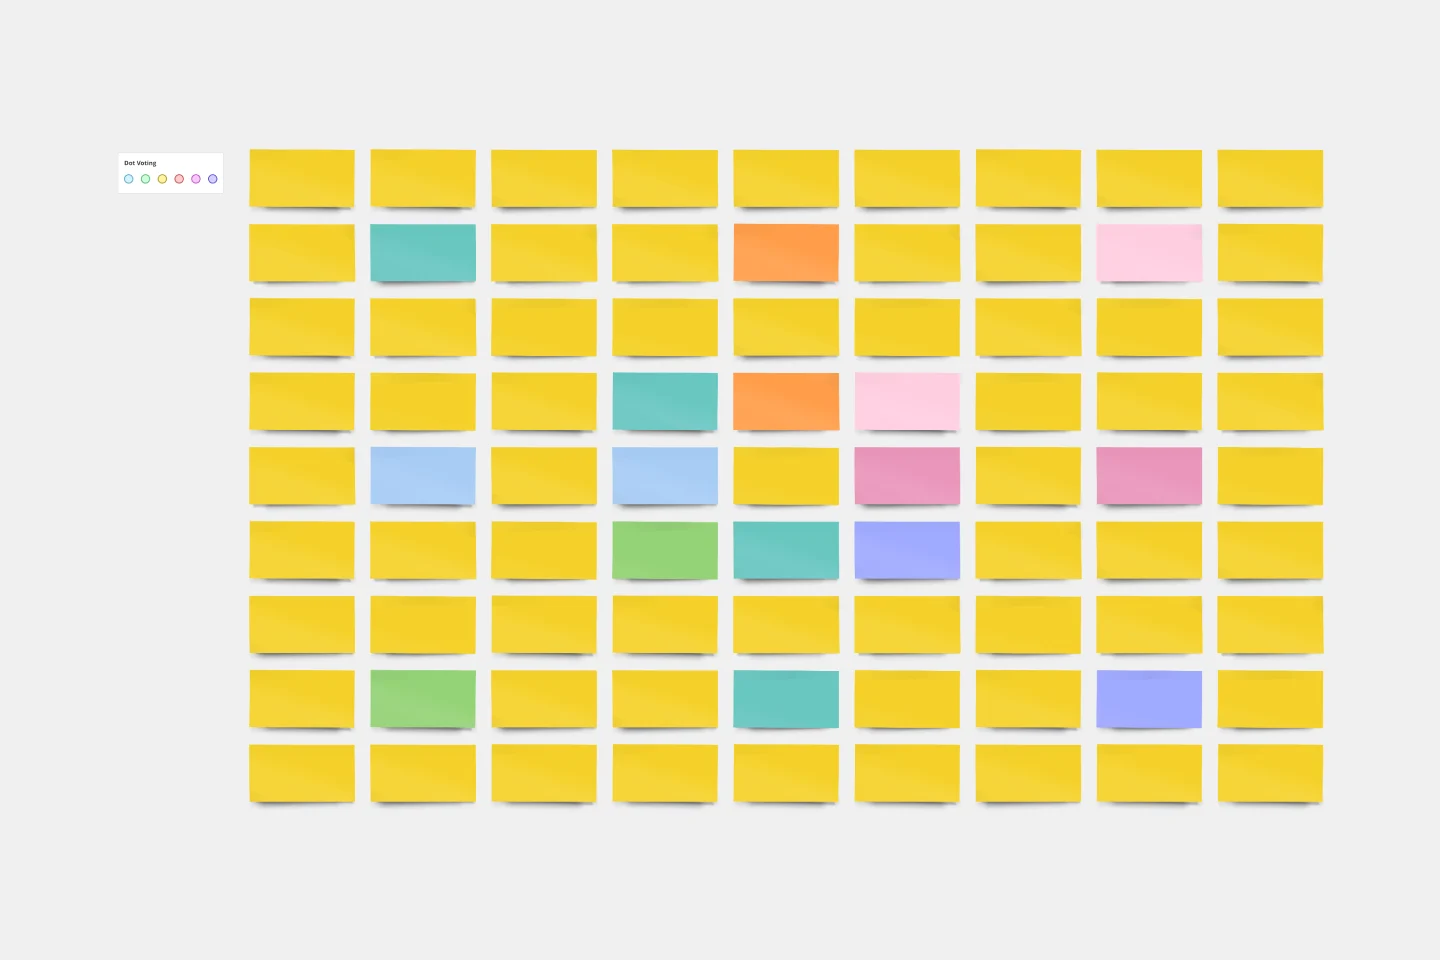
Lotus Diagram Template
Works best for:
UX Design, Ideation, Diagrams
Even creative thinkers occasionally need help getting their creative juices flowing. That's where a lotus diagram comes in. It'll empower you to run smoother, more effective brainstorming sessions. This creative-thinking technique explores ideas by putting the main idea at the diagram center and ancillary concepts in the surrounding boxes. This template gives you an easy way to create Lotus Diagrams for brainstorms, as well as an infinite canvas for the endless ideas generated.
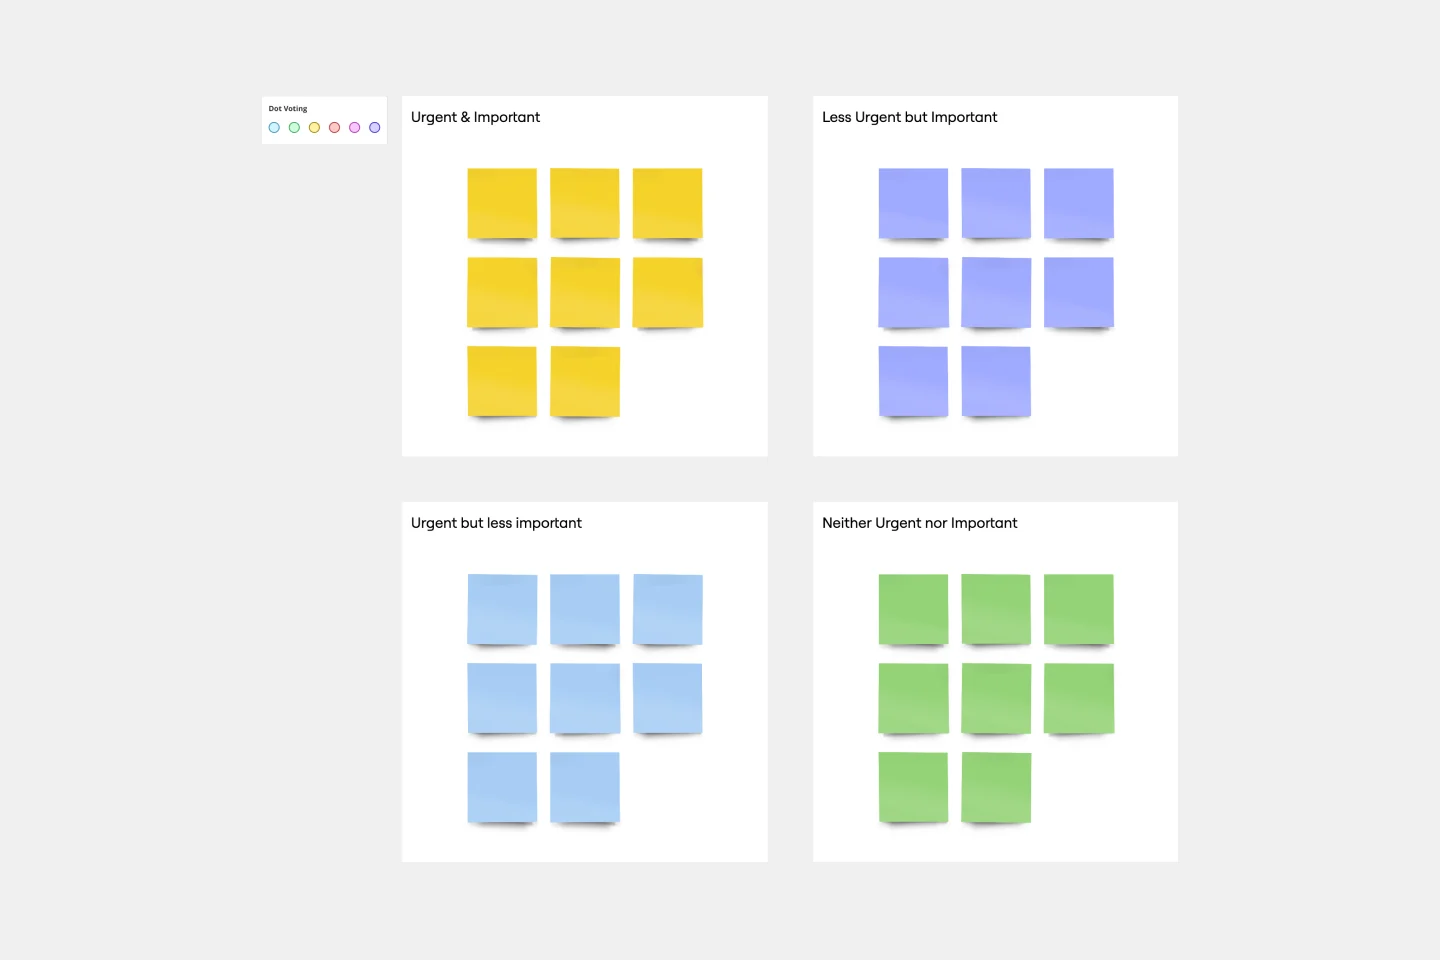
Eisenhower Matrix Template
Works best for:
Leadership, Strategic Planning, Prioritization
Have an overwhelming list of to-dos? Prioritize them based on two key factors: urgency and importance. It worked for American president Dwight D. Eisenhower, and it can work for you—this decision-making framework will help you know where to start and how to plan your day. With our template, you can easily build an Eisenhower Matrix with a quadrant of key areas (Do, Schedule, Delegate, and Don’t Do) and revisit it throughout the day as your priorities change.
Production Workflow Template
Works best for:
Agile Workflows, Agile Methodology, Project Management
Whether you’re producing a podcast, a marketing campaign, a TV show, or a piece of content, establishing a production workflow is crucial. A production workflow creates a visual guide to the different steps in a process. It can be used to train new team members or give a high-level overview to stakeholders. Although production workflows vary by team and business, they generally contain information about who the stakeholders are, how you brainstorm ideas, what your timeline looks like, and what resources you need to succeed.
Visual Story Map Template
Works best for:
Marketing, Desk Research, Mapping
Some people like to think of a visual story map as a stylized to-do list, but it’s a lot more powerful than that. Visual story mapping allows your product management team to visualize multiple dimensions of information.
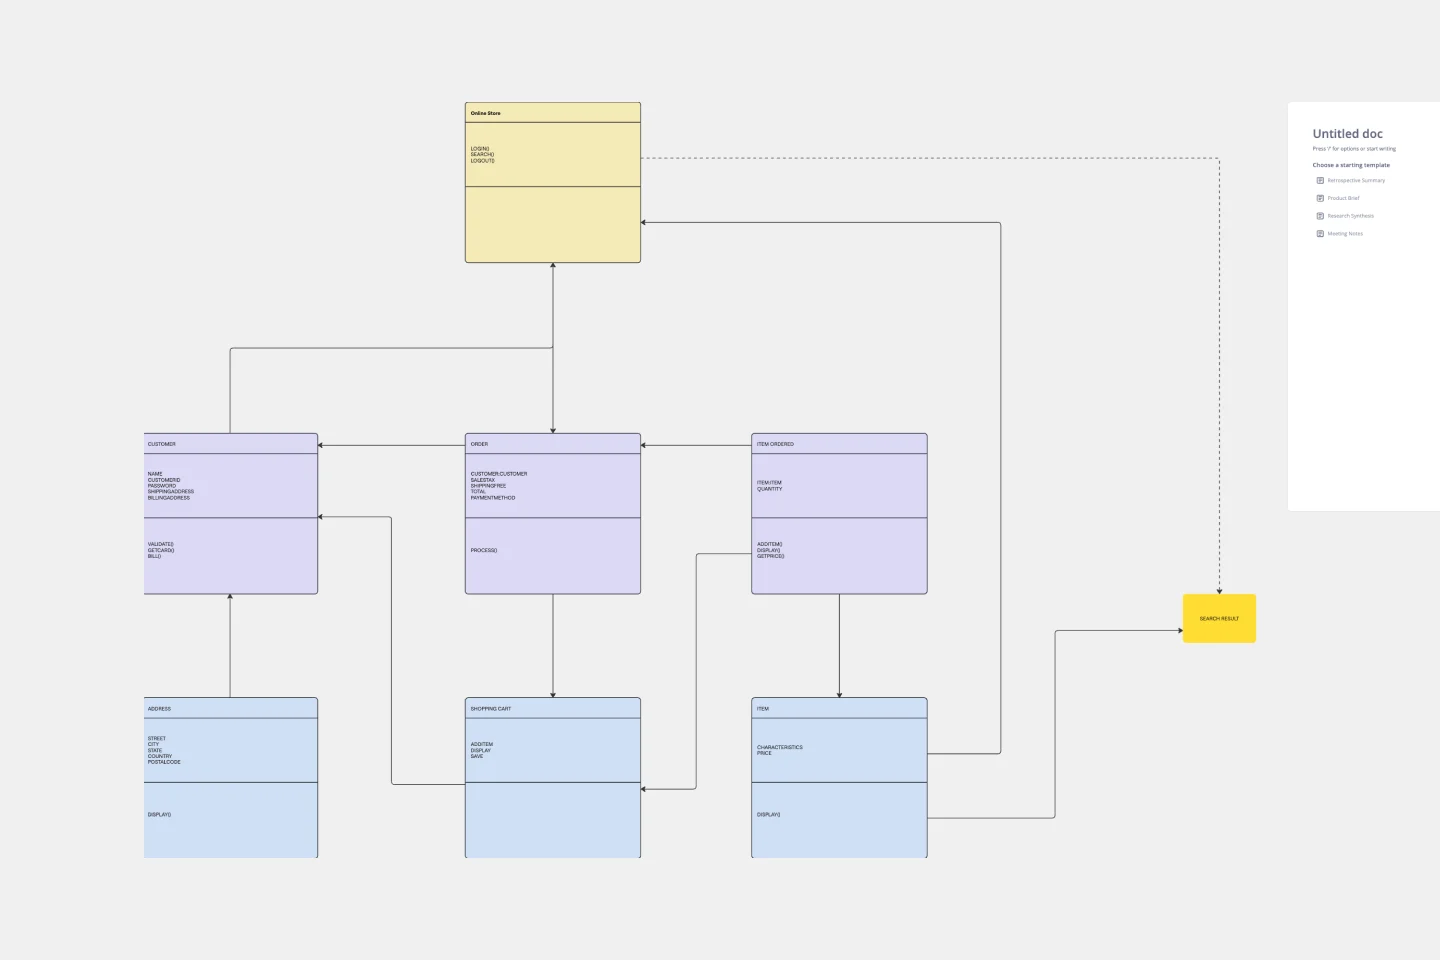
UML Diagram Template
Works best for:
Diagrams, Software Development
Originally used as a modeling language in software engineering, UML has become a popular approach to application structures and documenting software. UML stands for Unified Modeling Language, and you can use it to model business processes and workflows. Like flowcharts, UML diagrams can provide your organization with a standardized method of mapping out step-by-step processes. They allow your team to easily view the relationships between systems and tasks. UML diagrams are an effective tool that can help you bring new employees up to speed, create documentation, organize your workplace and team, and streamline your projects.