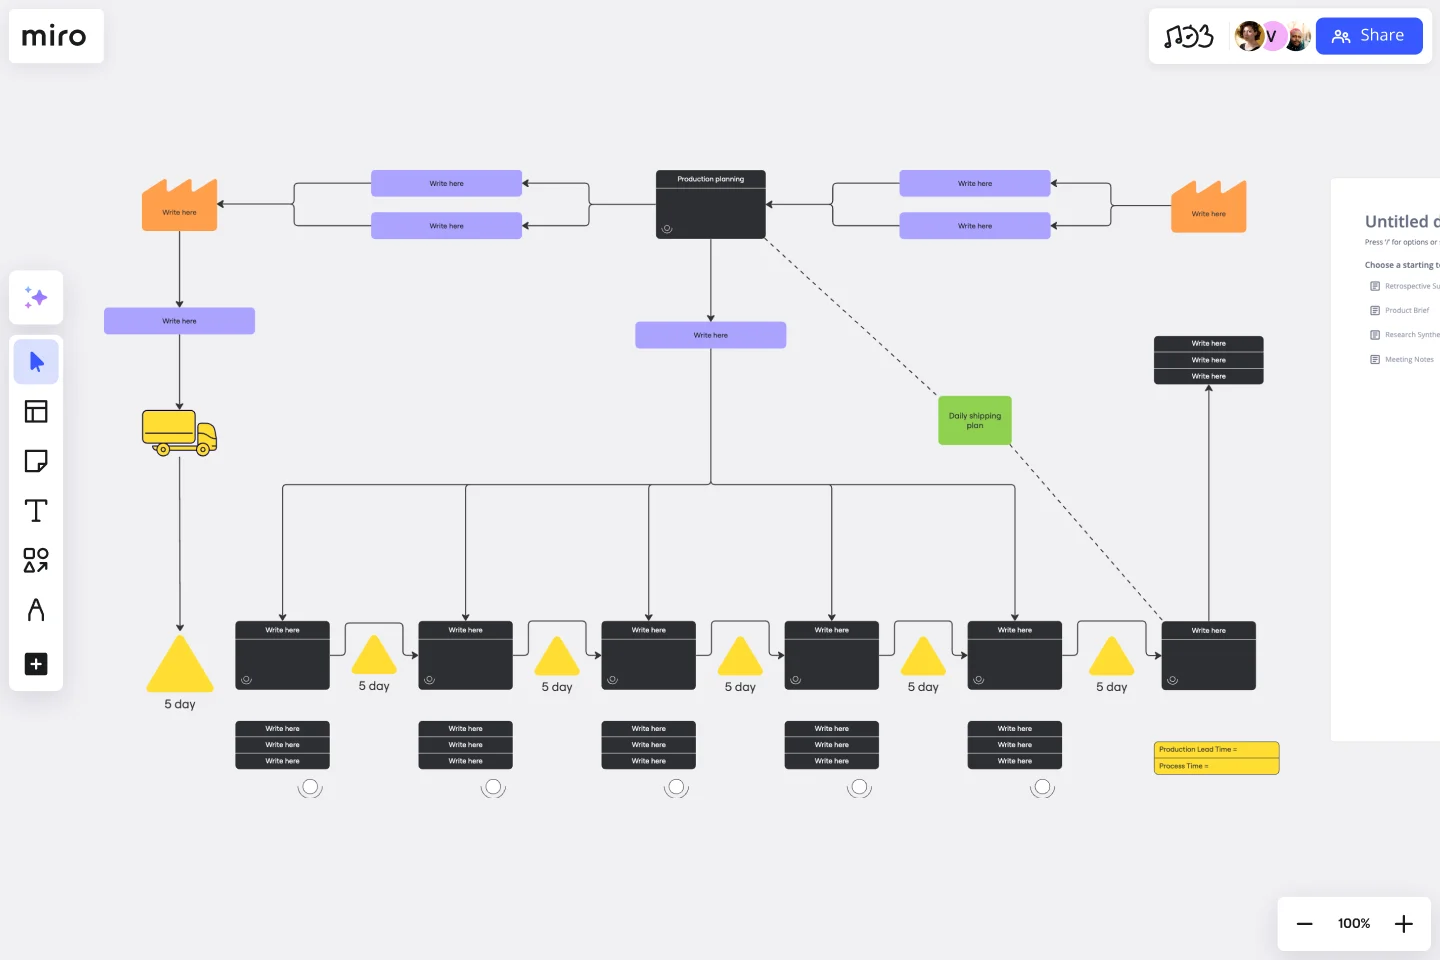
Value Stream Mapping Template
Define and optimize the various steps of delivering a product using lean methodology with the value stream mappping template.
About the Value Stream Mapping Template
To optimize repeatable processes, it is important to understand them thoroughly. Our value stream mapping template can help you create a map easily.
Toyota developed this framework as part of its lean manufacturing methodology. By following their "just-in-time" strategy, Toyota only delivers enough finished cars to meet customer demand, avoiding losses due to storage and holding patterns. However, this approach requires continuous improvement, and a clear value stream analysis is essential.
The value stream map template promotes communication and collaboration to improve cross-functional processes. With this template, you can identify obstacles that hinder your production process, regardless of your industry.
How to use the value stream mapping template
Start by opening the value stream mapping template by clicking the "use template" button at the top of this page. Invite your team to collaborate on the template, then follow these steps:
1. Determine your scope
Figure out the start and endpoints of your value stream. When do you start adding value to the raw materials, and when do you hand the finished product off, either to a customer or another business?
2. Add objects for each step
What steps do you take to prepare a single product or feature for the customer? Create a box for each one. It might help to think of each team as its own step.
3. Add the flow of materials between each object
Add an arrow between each step. Label each arrow with the resources that must be transferred for the next step to be possible.
4. Add information flows
Add arrows of a different color to show which steps must communicate with each other to complete the process. Include flows that don’t match the resource flows, such as sending regular updates to a central management team.
5. Show how long each step takes
Add a timeline and base it on your real-world cycle time data. This is how you’ll be able to shed light on which steps and transitions are wasting time and resources.
6. Revise as needed
Remember, lean management demands continuous improvement. Once you’ve drawn your map, don’t be afraid to iterate. How does your timeline look? What process steps have you mapped out? Is your lead time too long? Are you seeing test failures? Identify any steps in the process that do not add value to the customer.
For more details on how to create a value stream map, you can see our in-depth guide, which can also help if you're planning on facilitating a value stream mapping workshop.
What are the benefits of using a VSM template?
Value stream mapping is a critical component of any business strategy. Here are a few things a value stream mapping tool can help you with.
Foster collaboration
Value stream maps make it easy to identify gaps in communication between teams and across functions. Once you’ve identified these gaps, you can brainstorm ideas for fostering communication and knowledge-sharing.
Reduce waste
Most of the waste in your production process occurs during handoffs between teams. When a project changes hands from Team A to Team B, it’s crucial to make sure all of Team A’s knowledge, experience, tools, and resources go with it.
If anything falls through the cracks, Team B has to waste time reinventing the wheel. That costs your company precious time and resources.
Value stream analysis allows you to overcome this obstacle by clarifying which handoffs are causing waste and why. With value stream mapping, you can reduce downtime from team transitions, making a Toyota-style lean strategy more feasible.
Focus on the customer
At all stages of production, your focus should be on the customer. But when there are so many teams and moving parts to think about, that focus can be hard to maintain.
The value stream mapping exercise forces you to evaluate whether each step in the process is adding value from the customer’s standpoint. This laser focus maintains your competitive advantage the only way it’s possible to do so sustainably: by producing the most value for your customers in the leanest way possible.
What factors should you keep in mind when creating a value stream map?
1. Business value
Which aspect of the product has the highest business value? Answer that question before you start building your map.
2. Responsibility
Who is mapping the value stream? It’s important to assign this task to an experienced team who can see the current state map and future state maps from start to finish.
3. Identifying the problem
What problem are you solving? Looking at the current state map, what are the deficiencies in the process flow? How can you improve future states?
Think about this question from the customer’s perspective. What have you been hearing from your customers? Do they think the price of your product is too high or the quality is low? Make sure everyone is on the same page about your problem before you start mapping.
4. Setting tangible objectives
What is the scope? Make sure you know what problems you can’t solve or don’t need to solve right away. That will help you create a clear, effective map with no extraneous parts.
Using process mapping software can be a game changer when you need to connect teams, optimize business processes, and scale your organization. Looking for more options to visualize and optimize your processes? Miro's template library offers a wealth of value stream map templates variations.
How do you create a value stream map?
To create a value stream map, you need to first articulate a clear objective for the processes that you want to improve. Then, break the process into its constituent steps, including both the flow of materials and information, gather data on these processes, and then look for inefficiencies that can be rectified.
How often should I update my value stream mapping template?
It is essential to revisit and update your value stream map regularly. This will help to ensure that it reflects any changes in processes and evolving business needs.
Can I share the value stream mapping template with external collaborators?
You can easily share your Miro board with external collaborators via a link. This will provide them with a transparent view of your value stream.
Are there any limitations on the number of process steps I can include in the template?
No, there are no limitations on the number of process steps you can include in the template. The template is scalable, allowing you to map as many process steps as needed for a comprehensive analysis.
How can I involve my team in the value stream mapping process?
You can foster team collaboration by inviting members to the Miro board. This will encourage input, feedback, and a shared understanding of the processes involved.
Get started with this template right now.
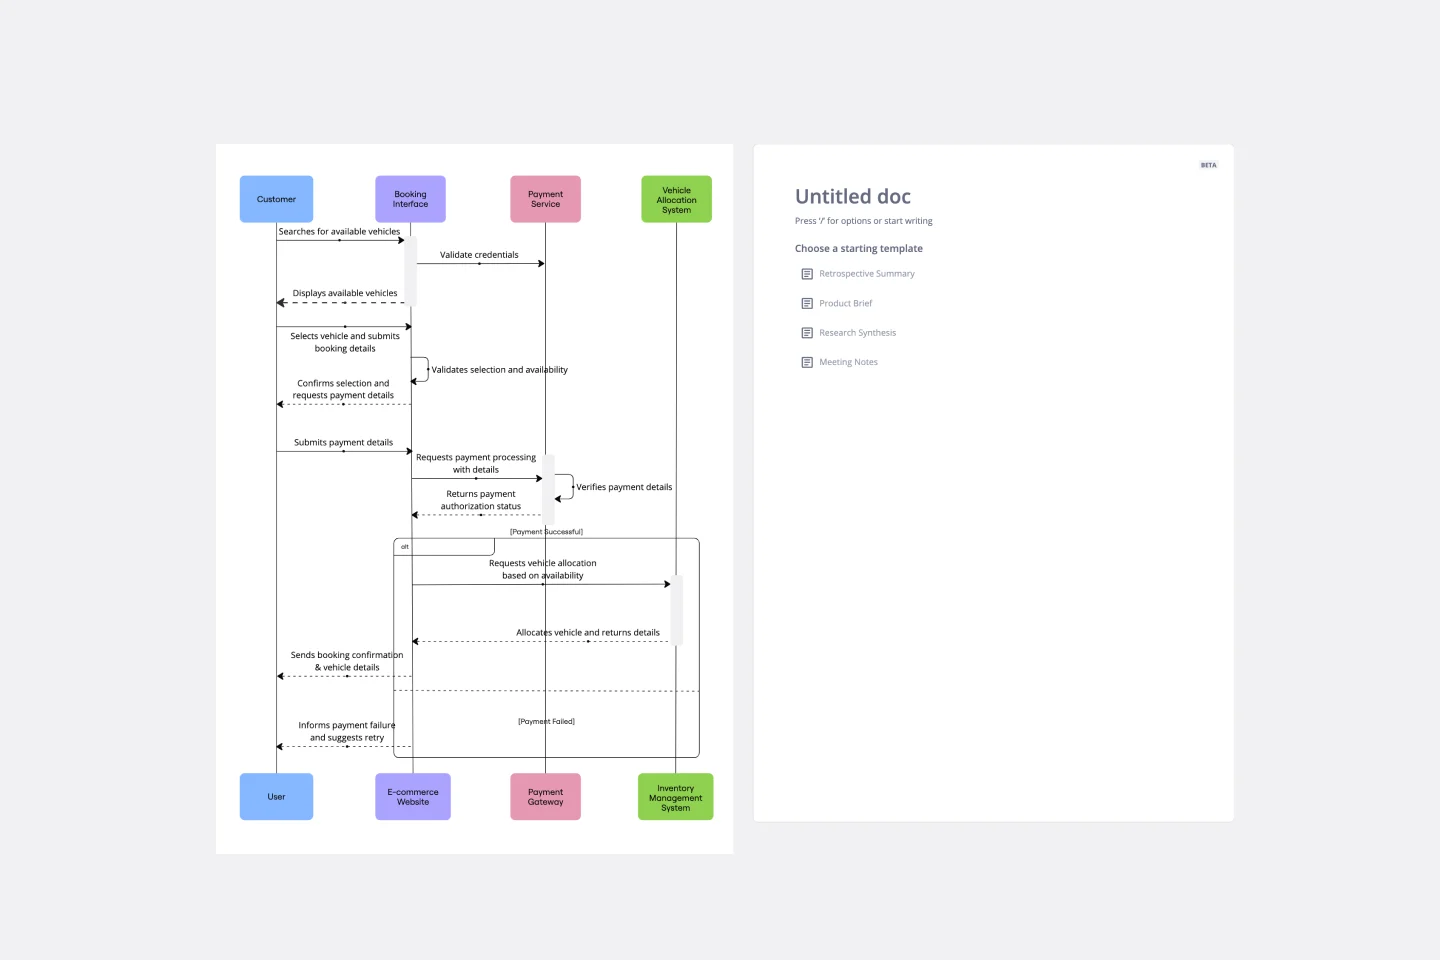
UML Sequence Rental Booking System Template
Works best for:
UML
The UML Sequence Rental Booking System Template streamlines the process of documenting and visualizing the interactions within a car rental booking system. This template maps out the communication flow between the customer, user interface, payment service, and vehicle allocation system, ensuring a smooth and efficient workflow. By providing a clear visual representation of these interactions, the template helps in improving understanding among team members and stakeholders, promoting efficient design and collaboration.
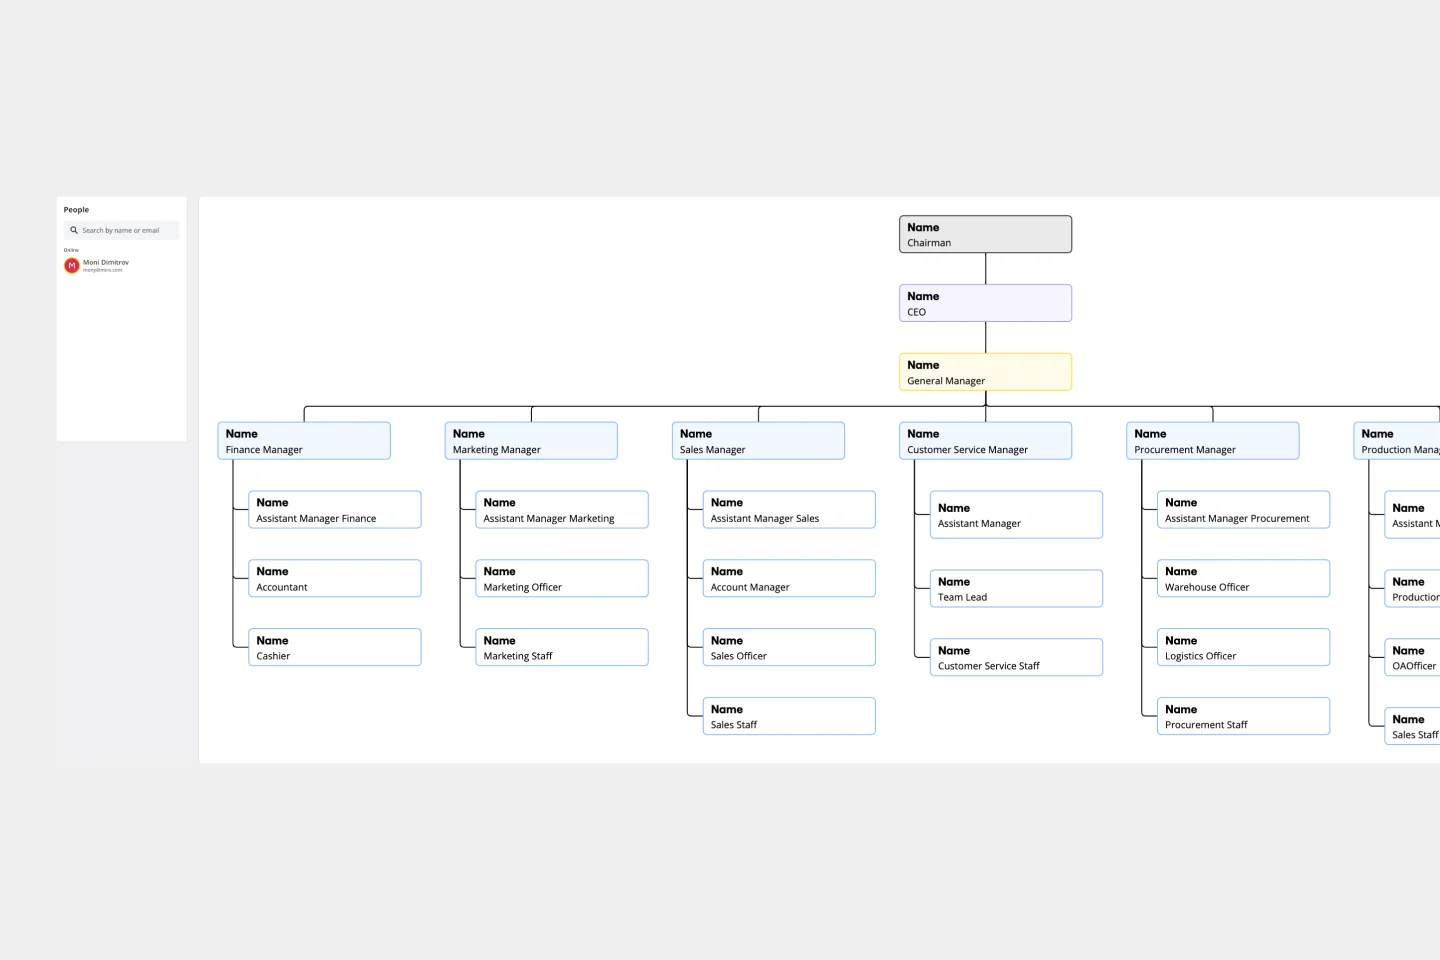
Vertical Organizational Chart
Works best for:
Organizational Charts, Organizational Design
The Vertical Organizational Chart Template is an efficient way to illustrate the hierarchy of an entity in a top-down format. This tool helps represent roles and relationships in a clear manner, starting from the topmost authority and branching downwards. It allows for a better understanding of the flow of responsibilities and communication channels within the organization. One of its most significant advantages is promoting clear communication. Depicting the organization's structure helps avoid misunderstandings and ensures everyone is on the same page regarding the chain of command.
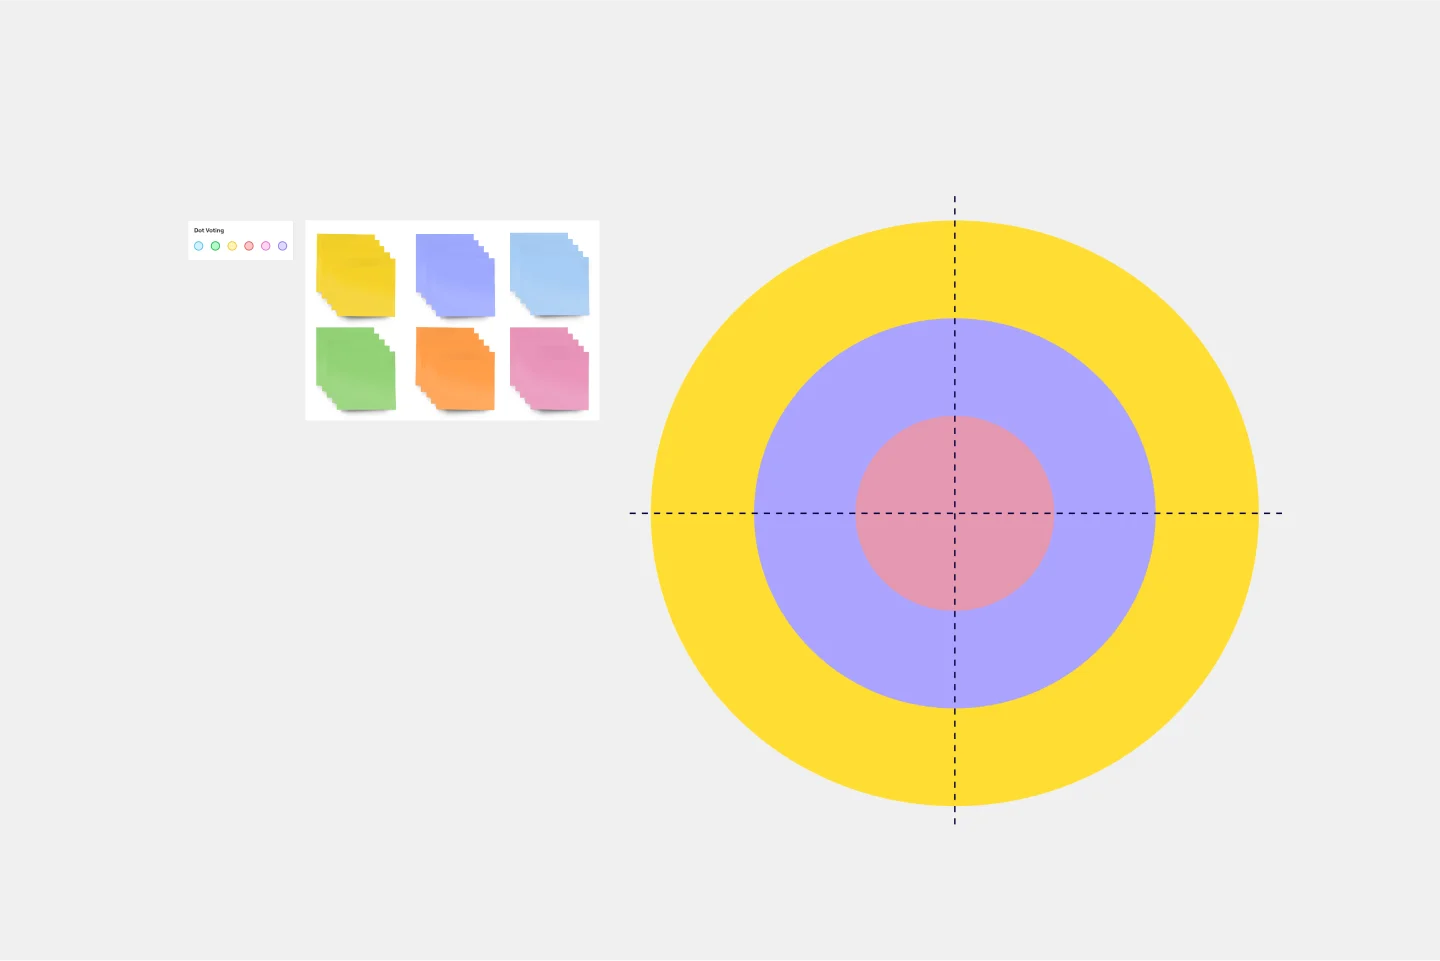
What's on Your Radar Template
Works best for:
Business Management, Operations, Strategic Planning
Do you or your team feel overburdened by tasks? Having trouble focusing on particular problems? What’s on Your Radar is a thought exercise in which you plot ideas according to their importance or relevance. Designers and teams use what’s on your radar to ensure that their ideas are within the scope of a given project. They also rely on the method to assess whether a given solution is likely to solve the problem at hand. But even if you’re not a designer, the method can help assign priorities and ground your ideas in reality.
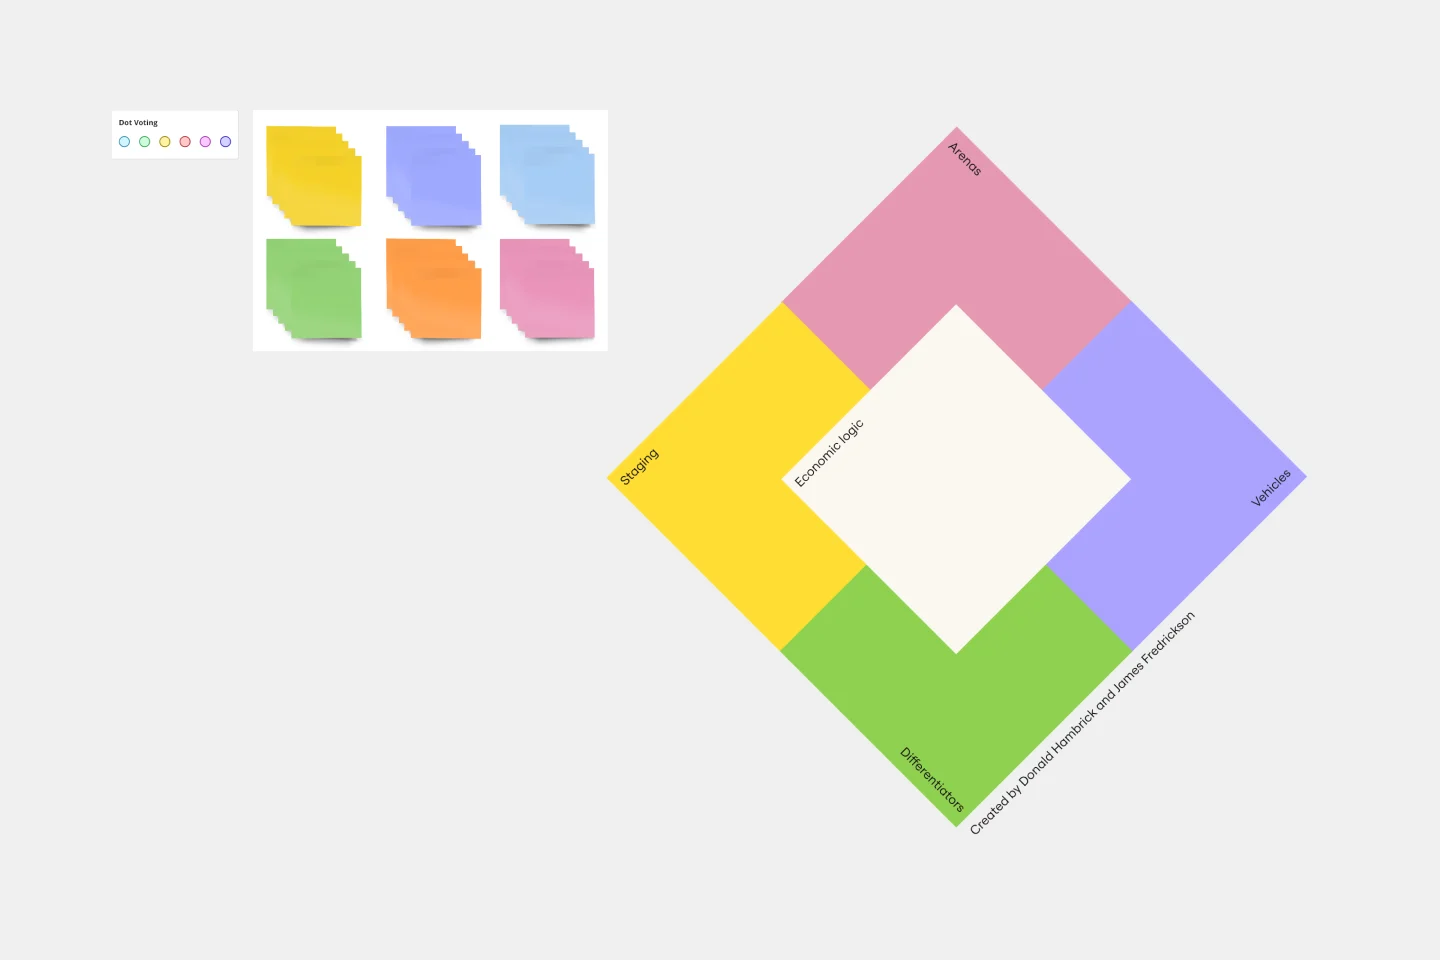
Strategy Diamond Template
Works best for:
Leadership, Operations, Strategic Planning
To achieve key objectives, every business assembles a series of strategies. But what elements should you consider when building a strategy? A strategy diamond is a collection of elements forming a coherent business strategy. These elements include: Arenas, Differentiators, Vehicles, Staging, and Economic Logic. Most strategic plans focus on just one or two of these elements, creating gaps that might cause problems for your business later on. A strategy diamond can help you stay focused and ensure you’re fulfilling all of your business’s needs rather than one or two.
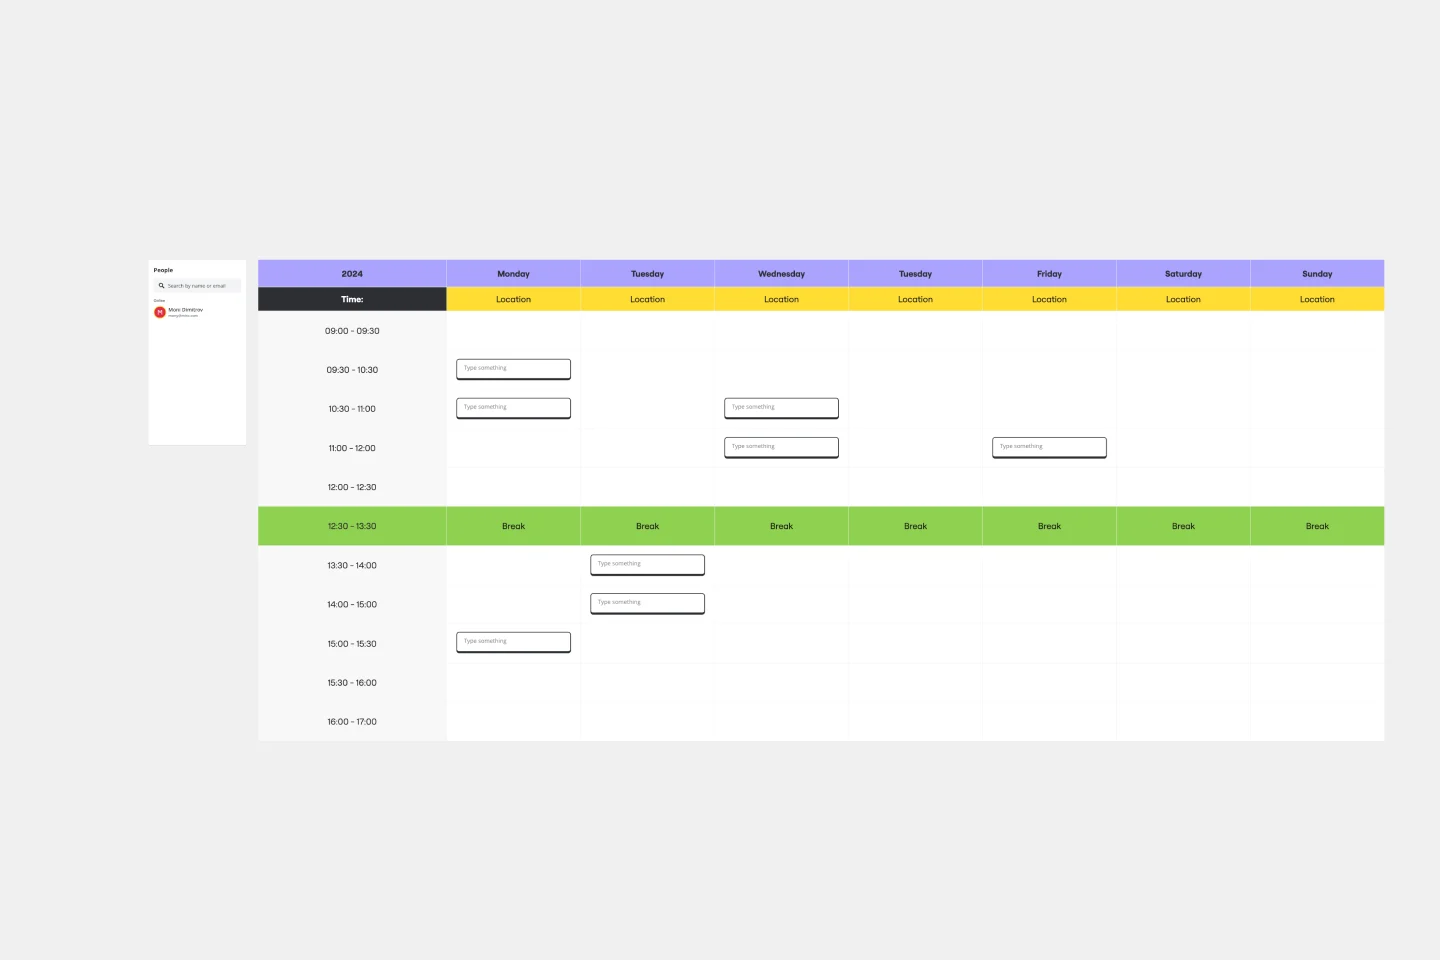
Weekly Schedule Template
Works best for:
Planning, Project Management
The Weekly Schedule Template is a powerful tool that makes it easy for users to manage their time effectively. Specifically designed for weekly planning, this template provides a visual guide for organizing tasks, events, and activities. Its most notable feature is its ability to prioritize and allocate time systematically throughout the week. This unique flexibility ensures that users have a comprehensive overview of their schedule and can adjust it as needed to meet changing priorities and goals. With this template, people can achieve a well-organized and balanced week, promoting increased productivity and focus.