Logic Model Template
Outline your program’s activities and outputs with the logic model template. Map out the project lifecycle and bring alignment to teams.
About the Logic Model Template
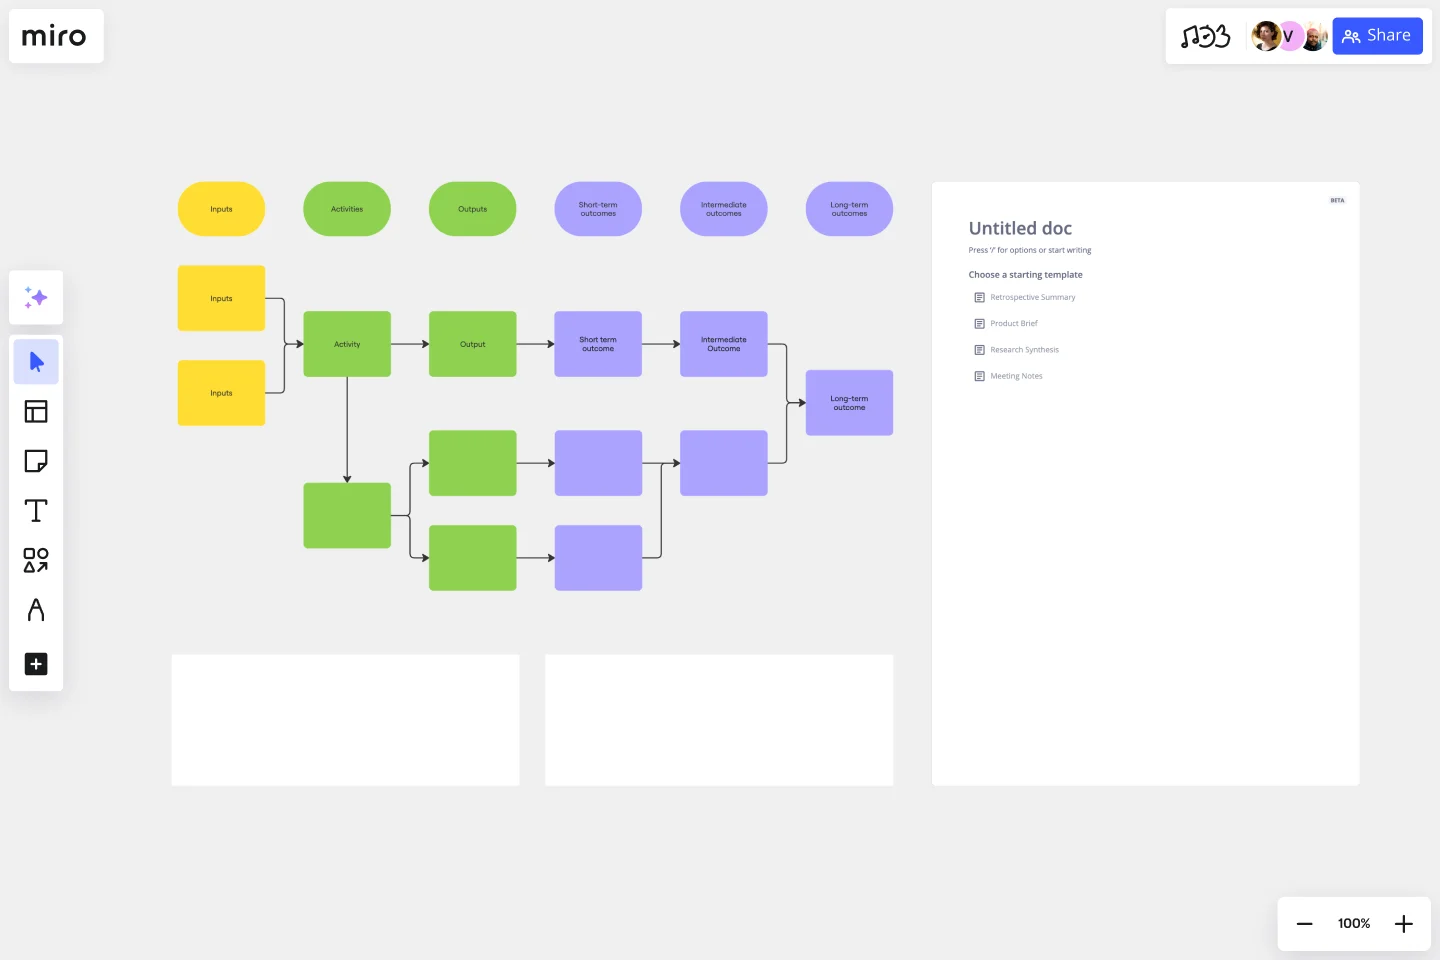
This logic model template offers an illustrative approach to program planning, evaluation, and management. The template visually represents the connection between resources, activities, and desired outcomes, ensuring a clear roadmap for your project or initiative.
Businesses, nonprofits, and educators can use the logic model template to visually depict the relationship between program inputs, activities, outputs, and outcomes. It illustrates how the invested resources will be transformed into the anticipated results through interconnected steps.
Step-by-step guide to using the logic model template
Setting up the logic model template to fit your project or business is easy. Start by opening the template onto a Miro board, then follow this guide to customize it to your needs.
Edit the template: Click on any element within the template to quickly edit or change it. You can change text, colors, or reposition sections as needed.
Expand with automated diagramming: If you need to add more sections or components, use Miro’s automated diagramming feature by clicking on shapes and connector lines. This lets you seamlessly expand and edit the existing structure of the template.
Add artifacts: To make your logic model more comprehensive, drag and drop any documents, images, links, or other artifacts onto the board.
Collaborate in real-time: Invite team members to join the board. They can provide instant input, comments, or feedback, ensuring a collaborative approach.
Share and collect feedback: Once your logic model is complete, you can share the board with stakeholders or team members for further review or implementation.
Why use a logic model template?
Clear visualization: The template provides a visual map, enabling stakeholders to quickly understand the entire project lifecycle and its components.
Improved resource allocation: Clearly defining inputs and anticipated outcomes ensures resources are used efficiently and directed toward activities that genuinely matter.
Alignment with goals: The template ensures all activities align with the overarching project or program goals, minimizing deviations or distractions.
Facilitates evaluation: With the logic model, it's easier to monitor and evaluate a program's effectiveness, pinpointing improvement areas.
Stakeholder communication: The template acts as a shared language, making communicating complex ideas or plans to different stakeholders simpler.
If you'd prefer to start from scratch, Miro's flowchart maker is the perfect tool to diagram a logic model. You can add shapes and connector lines with just one click.
Can I customize the logic model template?
The template is designed to be flexible, allowing you to tailor it according to your specific needs and preferences.
Can multiple team members collaborate on the template in real time?
The template supports real-time collaboration, ensuring all stakeholders can provide input and feedback instantly.
What kind of projects or initiatives is the logic model template best suited for?
The template is versatile and can be used for various projects, from educational initiatives and nonprofit programs to business projects and strategic planning.
Do I need any special skills to use the logic model template?
Not at all! The template is user-friendly, and even if you're new to such tools, you'll find it intuitive and easy to navigate.
Get started with this template right now.
Azure Demand Forecasting Template
Works best for:
Software Development, Diagrams
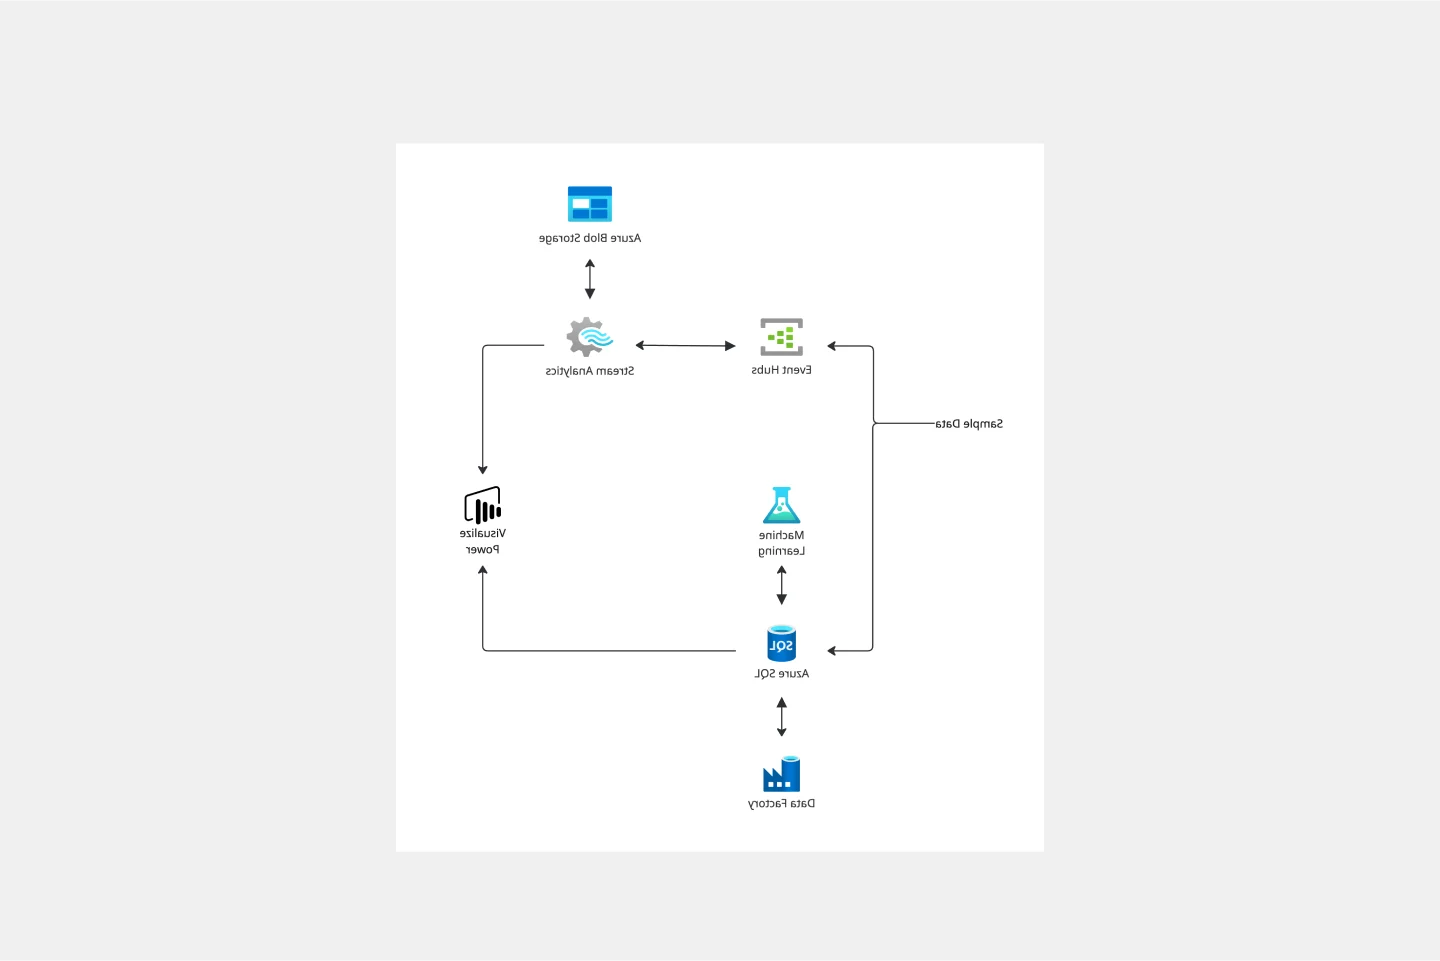
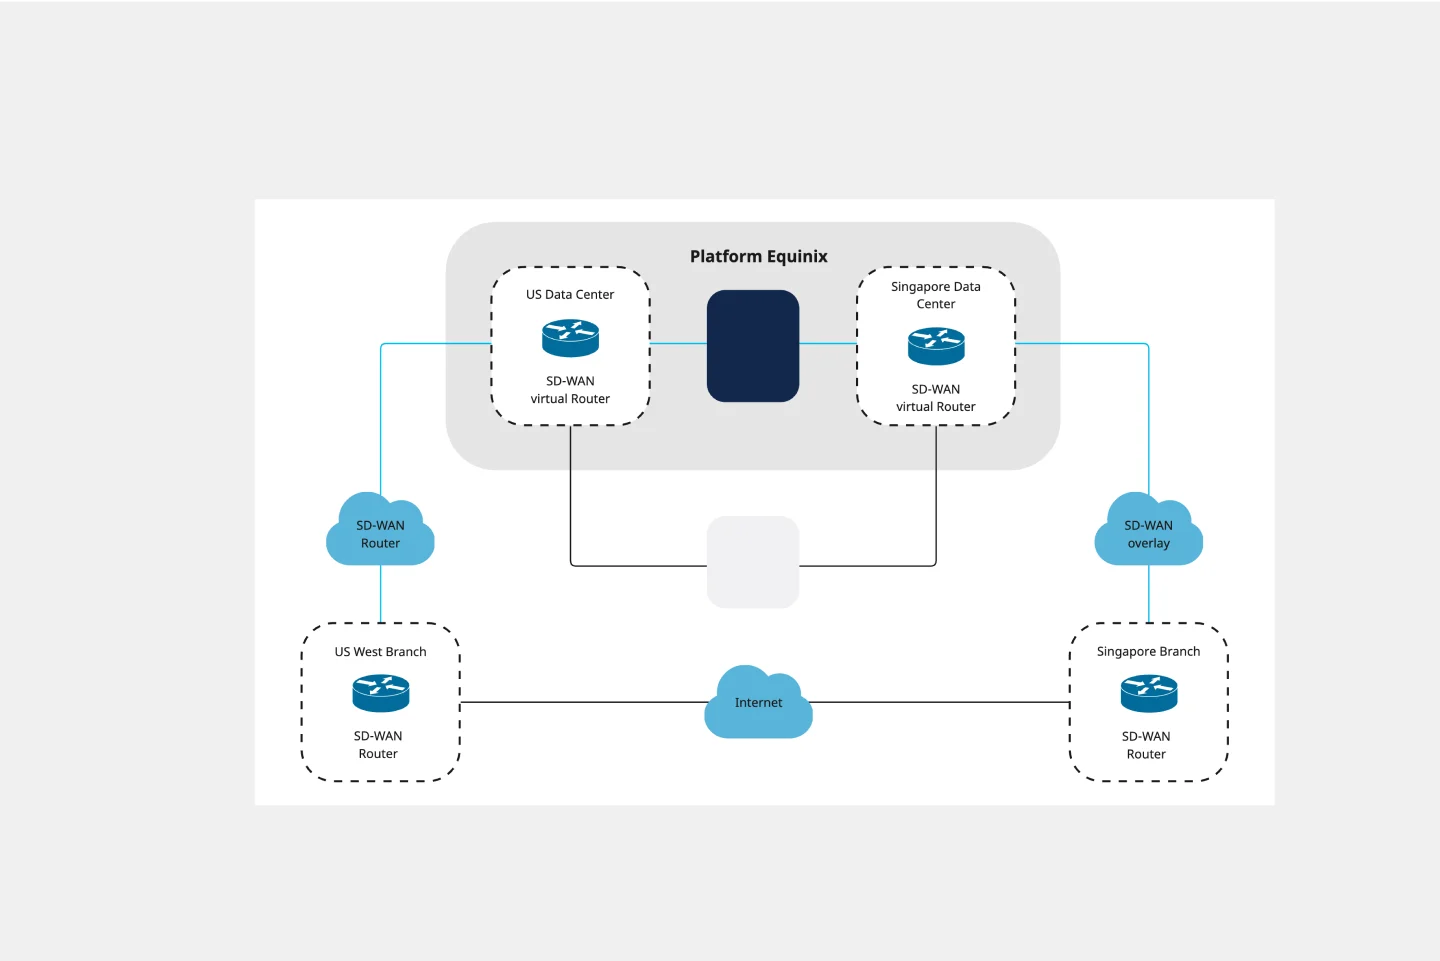
The Azure Demand Forecasting diagram will show the architecture of a demand forecast, making it easier for you to predict data consumption, costs, and forecast results. Azure is Microsoft’s cloud computing platform, designed to provide cloud-based services such as remote storage, database hosting, and centralized account management. Azure also offers new capabilities like AI and the Internet of Things (IoT).
Bar Chart / Diagram Combined
Works best for:
Diagramming
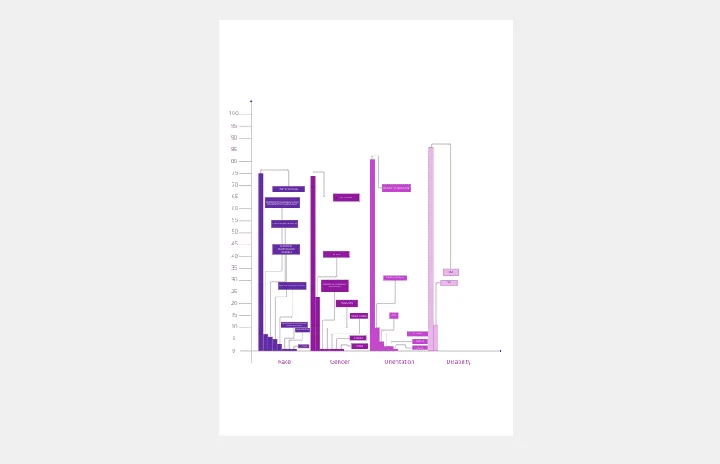
The Bar Chart / Diagram Combined template offers a versatile tool for creating visualizations that combine bar charts with other diagrammatic elements. It provides elements for representing data trends, relationships, and comparisons effectively. This template enables teams to create customized visualizations that communicate complex information in a clear and compelling manner. By promoting visual clarity and insight, the Bar Chart / Diagram Combined template empowers teams to make data-driven decisions and communicate findings with impact.
Opportunity Solution Tree
Works best for:
Diagramming
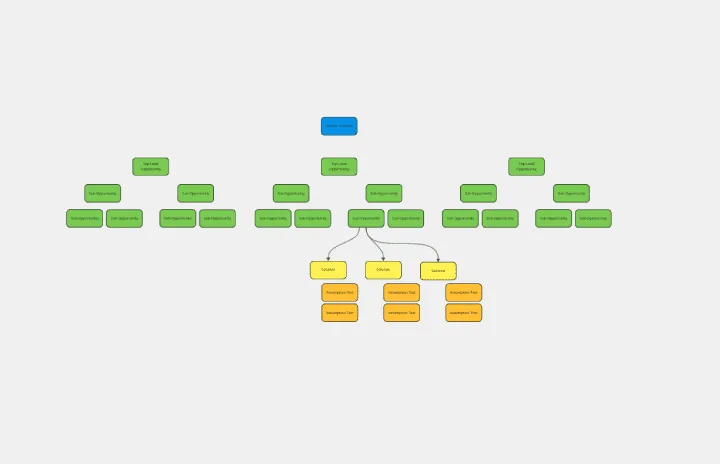
The Opportunity Solution Tree template is a visual tool for identifying and prioritizing opportunities and solutions. It provides a structured framework for mapping customer needs, pain points, and potential solutions. This template enables teams to explore divergent ideas, evaluate alternatives, and focus on high-impact solutions. By promoting customer-centricity and innovation, the Opportunity Solution Tree empowers teams to address market needs effectively and deliver value-driven solutions.
Cisco Data Network Diagram Template
Works best for:
Software Development
Cisco offers data center and access networking solutions built for scale with industry-leading automation, programmability, and real-time visibility. The Cisco Data Network Diagram uses Cisco elements to show the network design of Cisco Data Networks visually.
Inverted Org Chart Template
Works best for:
Org Charts, Organizational Design
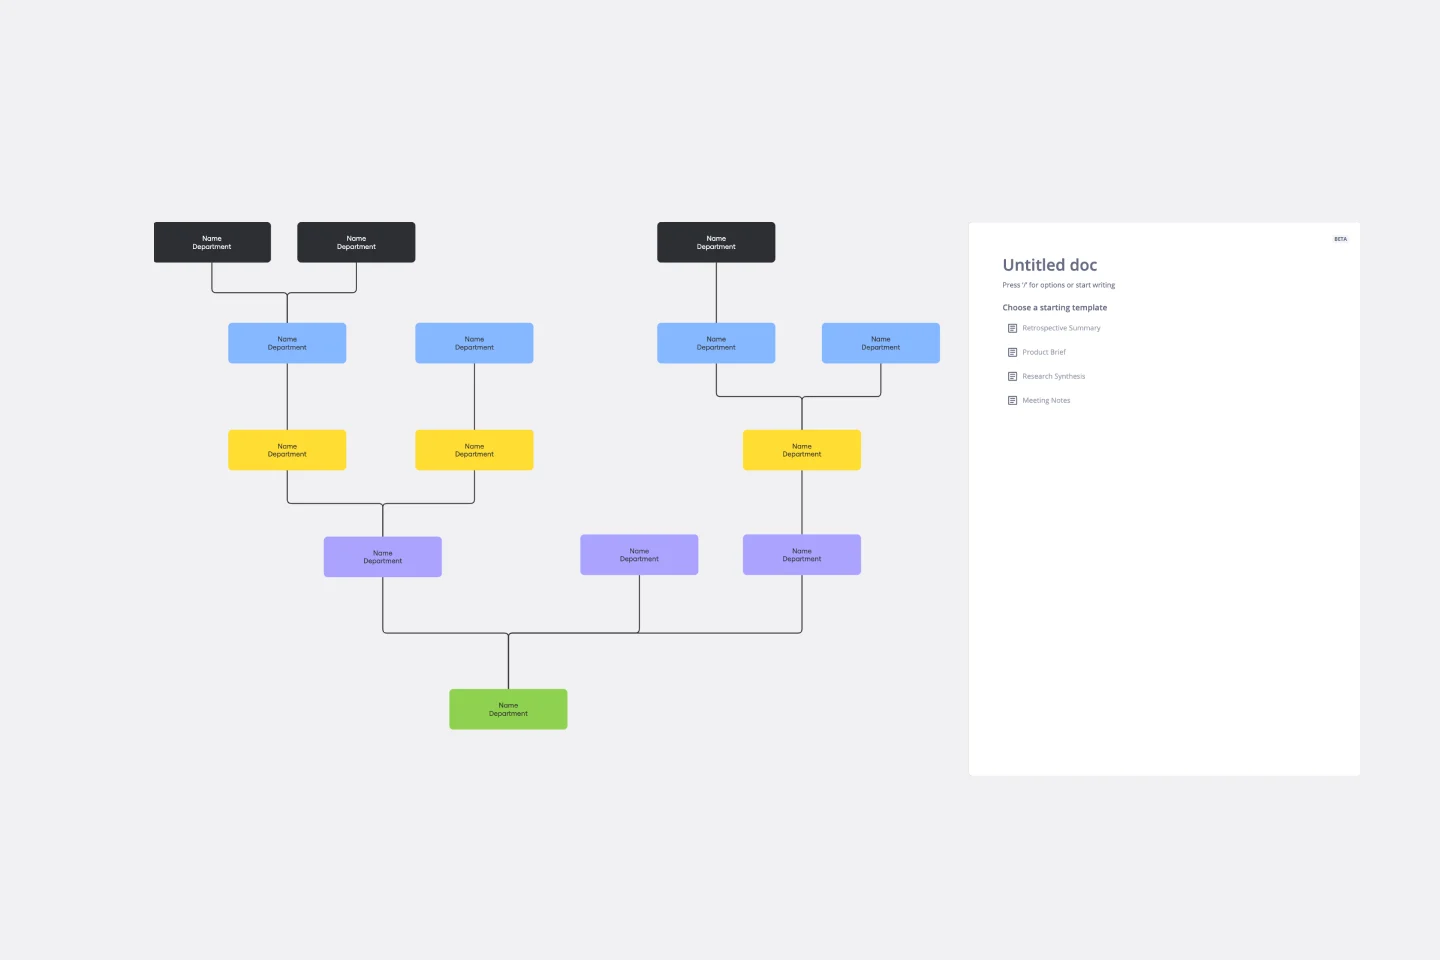
The Inverted Org Chart Template is a tool that reimagines the traditional hierarchical model by placing frontline employees at the top of the organizational structure. This innovative approach highlights the crucial role played by those who interact with customers directly, ensuring that their insights and contributions are not only recognized but also celebrated. One of the key advantages of this template is that it fosters a feedback-driven environment. Prioritizing frontline workers promotes a culture where valuable insights from the ground can quickly reach the top of the hierarchy, streamlining decision-making processes and ensuring that strategies are based on real-world experiences.
Critical Path Method Template
Works best for:
Diagramming, Project Management
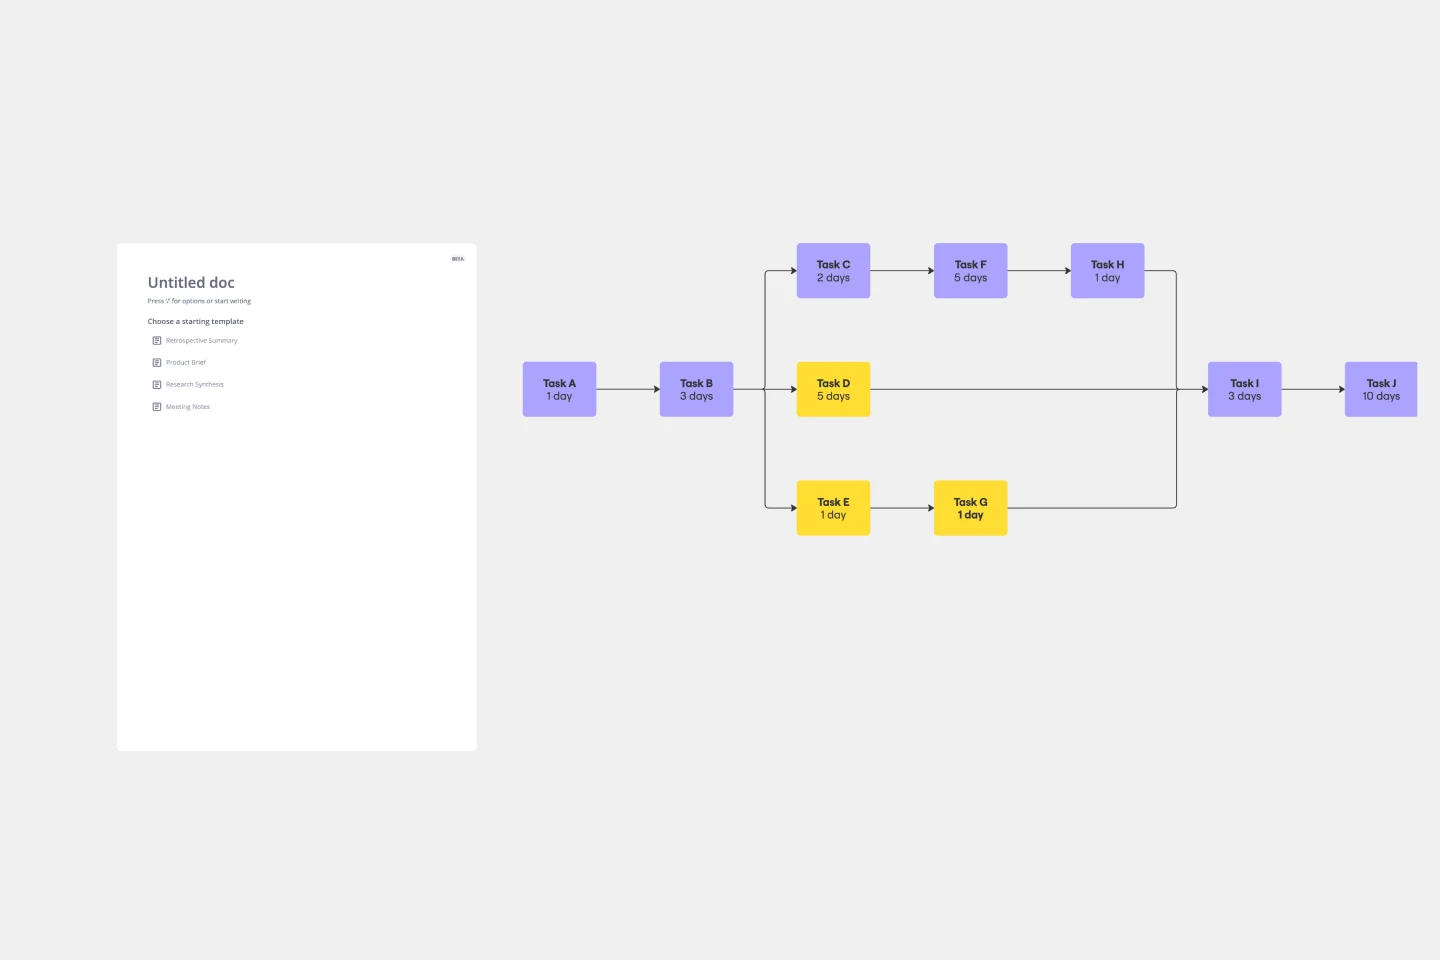
Elevate your project management game with the Critical Path Method Template—an indispensable tool that brings clarity and precision to your project timelines. The template instantaneously adjusts as you edit tasks and dependencies, ensuring that your critical path is consistently up-to-date. This capability not only simplifies the complex process of project scheduling but also empowers your team to proactively respond to evolving project dynamics, fostering adaptability and efficiency throughout the project lifecycle.