Algorithm Flowchart Template
Simplify the process of creating complex algorithms with the algorithm flowchart template.
About the Algorithm Flowchart Template
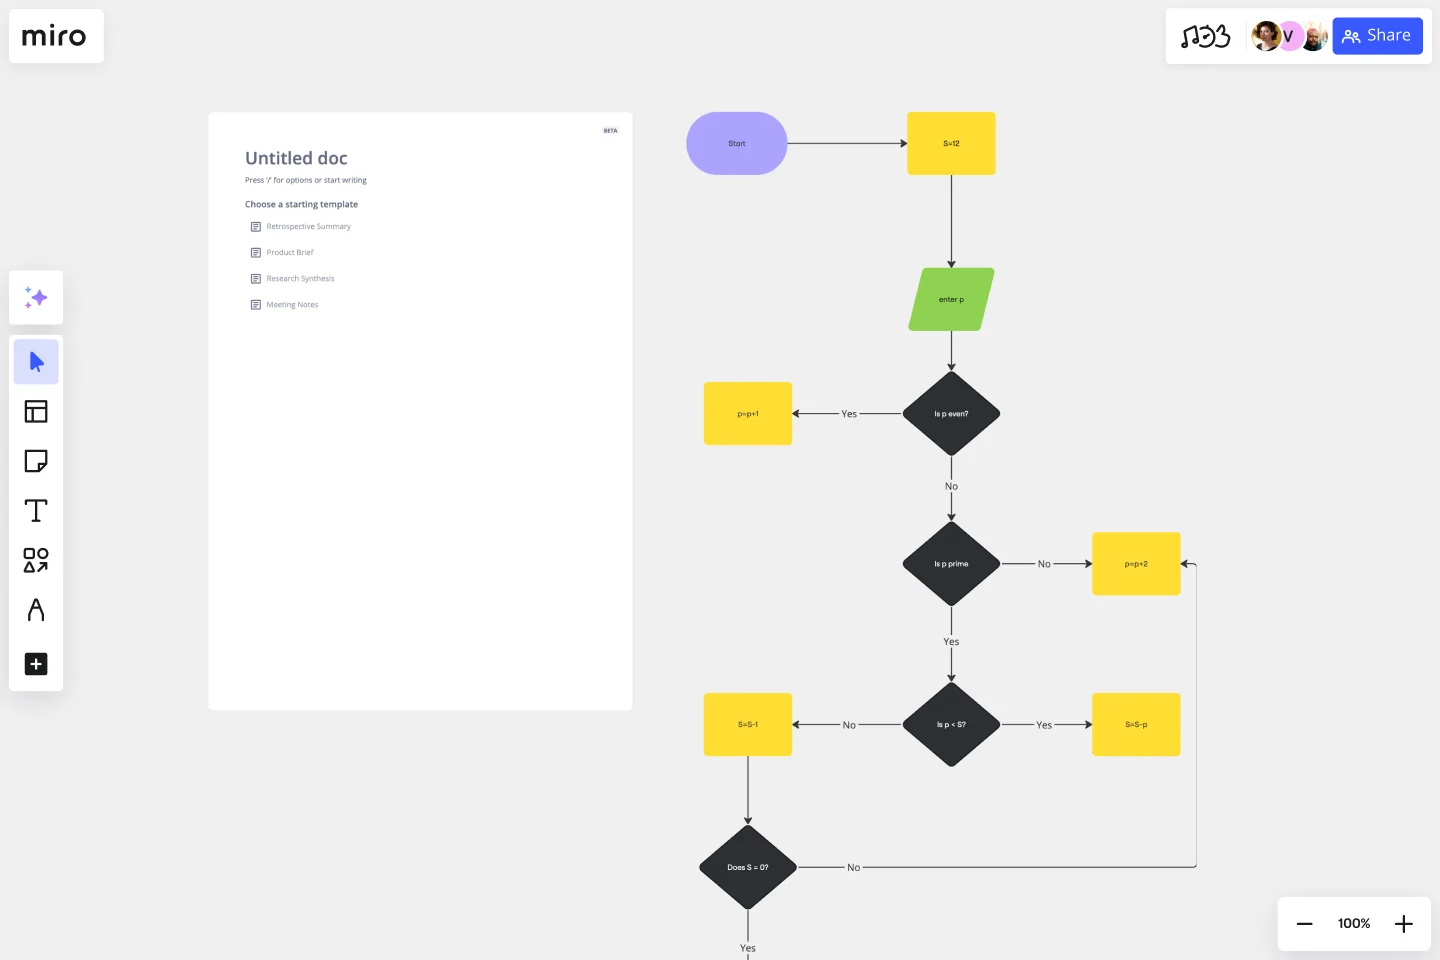
An algorithm flowchart is a graphical representation of a sequence of actions that make up an algorithm. It helps to streamline complex processes and make them easy to understand. Think of it as a blueprint that guides you through the logic of your algorithm, making it easier to go from problem to solution.
The algorithm flowchart template is a pre-designed framework that makes it easy to map out the process flow of an algorithm. It simplifies each step by breaking it down into individual components, represented by different shapes such as rectangles, diamonds, and ovals. Each shape represents a type of action or decision. By using clearly defined areas for input, operations, decisions, and outputs, users can methodically plot the course of their algorithm's logic. This tool is helpful for both beginners and experienced professionals.
How to use the algorithm flowchart template in Miro
Customize the flowchart: Double-click shapes to add your specific algorithm steps. The template is user-friendly, enabling you to edit text and shapes with just a few clicks.
Expand the diagram: Use automated diagramming features to drag and drop more shapes and connector lines, seamlessly expanding your flowchart.
Add context: Integrate any artifact on your board, such as notes, images, or links, to provide deeper insight into your algorithm.
The entire process is designed for efficiency and adaptability, ensuring your algorithm flowchart can grow and evolve as your project does.
Why use an algorithm flowchart template?
Clarity of complex processes: It transforms intricate algorithms into clear, visual steps, enhancing understanding for all stakeholders.
Efficiency in design: Saves time by providing a ready-made structure, which can be easily adjusted to fit various algorithms.
Collaboration: Fosters teamwork by allowing multiple contributors to view and edit the flowchart in real-time.
Reduce error: By laying out each step visually in a flowchart, potential issues can be identified and corrected early in the development process.
Documentation: The template acts as a dynamic document that can be referenced throughout the algorithm's lifecycle, from development to maintenance.
If you'd prefer to create an algorithm flowchart from scratch, Miro's flowchart tool is easy and intuitive to use.
Can the algorithm flowchart template handle complex algorithms with multiple conditions?
Absolutely. The template is designed to accommodate a variety of complexities, including algorithms with numerous conditions and branches.
Is it possible to export the flowchart for use in presentations or documents?
Yes, flowcharts created with the template can be exported and included in various document formats, making them suitable for presentations and reporting.
How does collaboration work with this template?
The template supports real-time collaboration. Multiple people can work on the flowchart simultaneously, making it perfect for team projects.
Are there any limits to how much I can customize the template?
There are no inherent limits. The template is fully customizable, allowing users to expand and change to meet their needs without restriction.
Get started with this template right now.
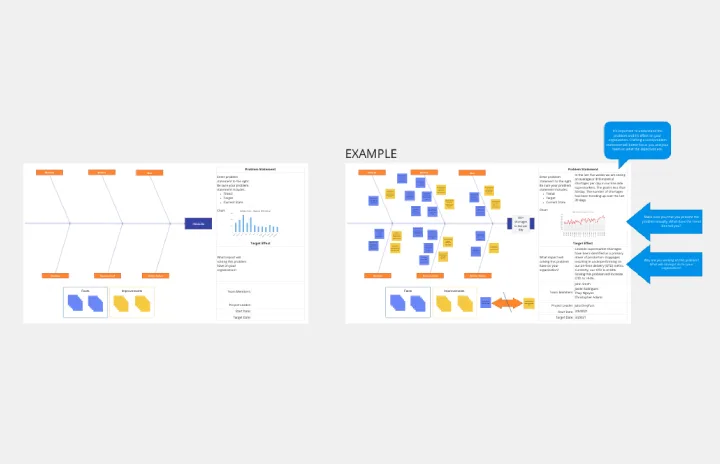
Crowd Sourced Cause and Effect
Works best for:
Fishbone Diagram, Problem solving
The Crowd Sourced Cause and Effect template leverages collective intelligence to identify root causes of problems. By involving multiple team members, you can gather diverse perspectives and uncover insights that might be overlooked. This collaborative approach ensures a comprehensive analysis and fosters team engagement.
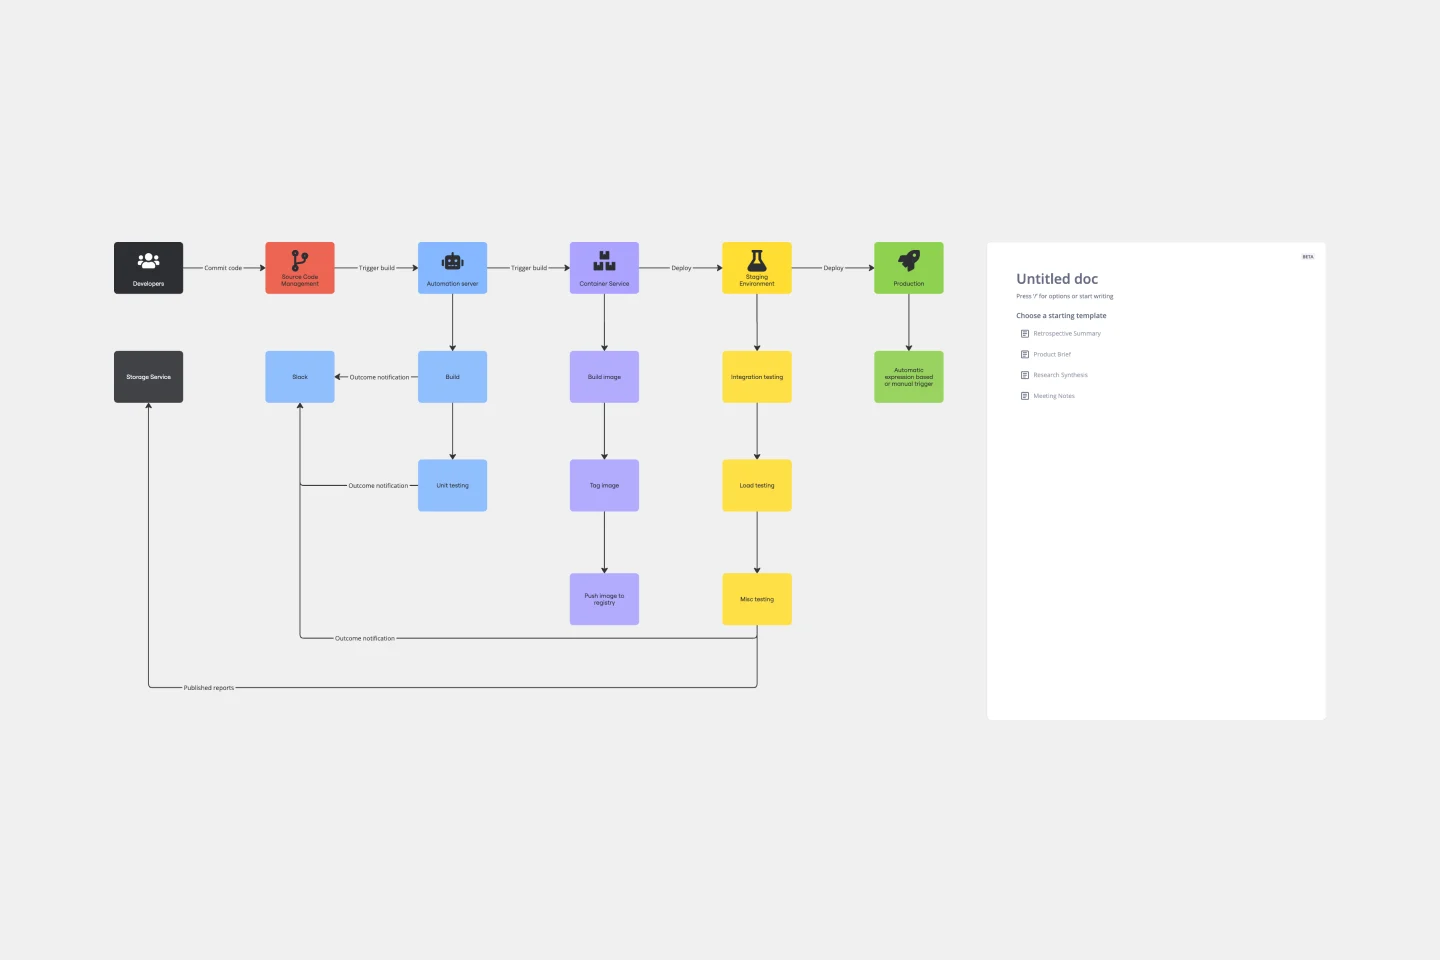
CI/CD Pipeline Diagram Template
Works best for:
Diagramming, Development
The CI/CD template is a well-designed roadmap for software deployment that enables a smooth and automated flow from development to production. This strategic layout includes critical elements such as source code management, automation servers, container orchestration, staging environments, and the final deployment to production. One of the key benefits of using such a template is that it builds a robust deployment pipeline, which significantly reduces manual intervention and human error. By visualizing each step and integrating automation throughout, teams can achieve faster deployment cycles, ensuring that new features, updates, and fixes are delivered to users promptly and reliably. This enhanced pace does not compromise quality, as the template inherently supports continuous testing and quality assurance, ensuring that each update is quick but also secure and stable before it is delivered to the end user.
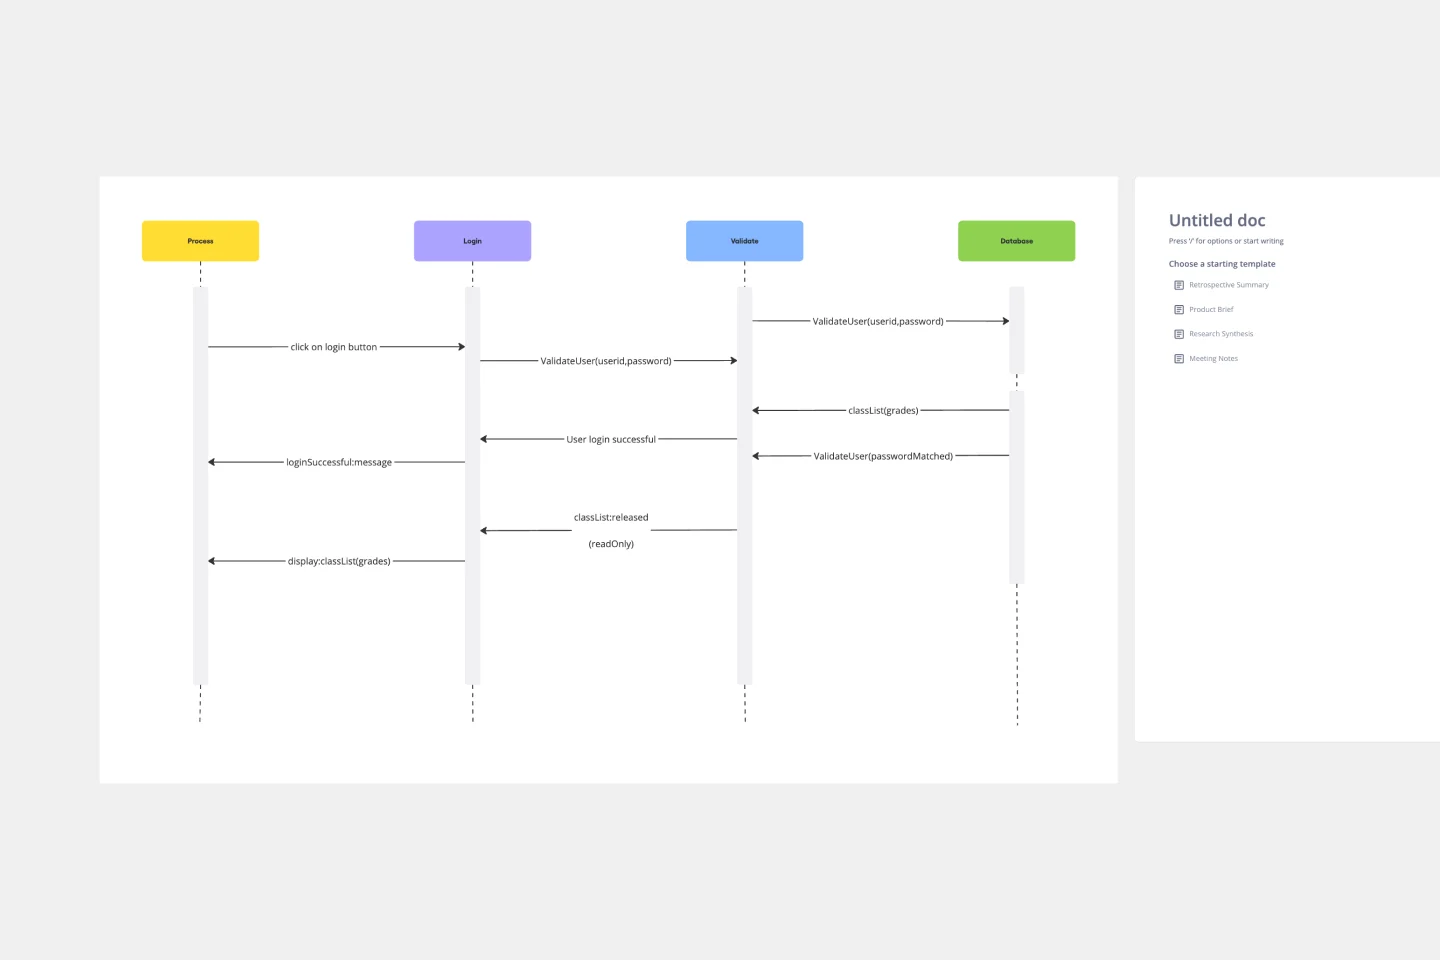
Login Sequence Diagram Template
Works best for:
Diagramming, Technical Diagramming
The UML Sequence Login Diagram Template is a valuable tool for visualizing user authentication processes. It breaks down complex login sequences into clear, visual components, facilitating collaborative understanding among team members, regardless of their technical expertise. This shared understanding is crucial for ensuring all stakeholders, from developers to project managers, are on the same page, leading to efficient decision-making and a smoother development process. The template's ability to translate technical details into an accessible format streamlines communication and significantly reduces the likelihood of misinterpretation or oversight, making it an essential asset in any software development project.
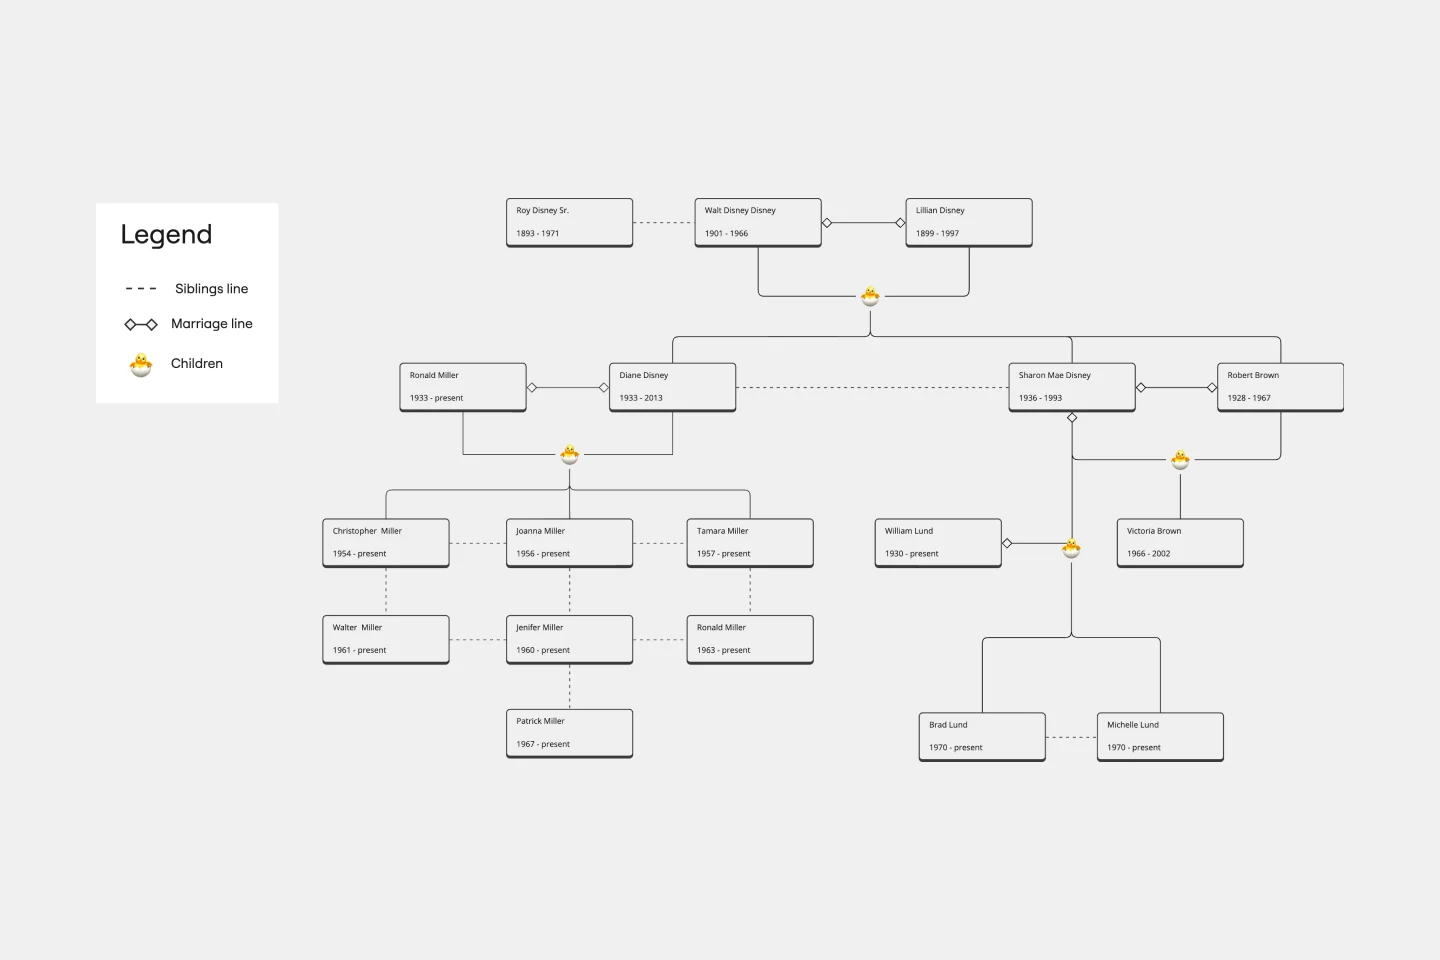
Family Tree Template
Works best for:
Education, Mapping
Family trees help you make sense of complicated family relationships, even generations back. With this Family Tree Template, you can quickly and easily add your siblings, parents, and extended family members. Plus, add extra information, notes, and even images to create a vibrant family tree.
Flow Diagrams
Works best for:
Diagramming
The Flow Diagrams template offers a versatile tool for visualizing processes, workflows, and systems. It provides a range of shapes and connectors for creating flowcharts, process maps, and data flow diagrams. This template enables teams to represent complex systems and processes in a clear and structured manner, facilitating communication and decision-making. By promoting visual clarity and understanding, Flow Diagrams empower teams to analyze and optimize processes effectively, driving efficiency and productivity.
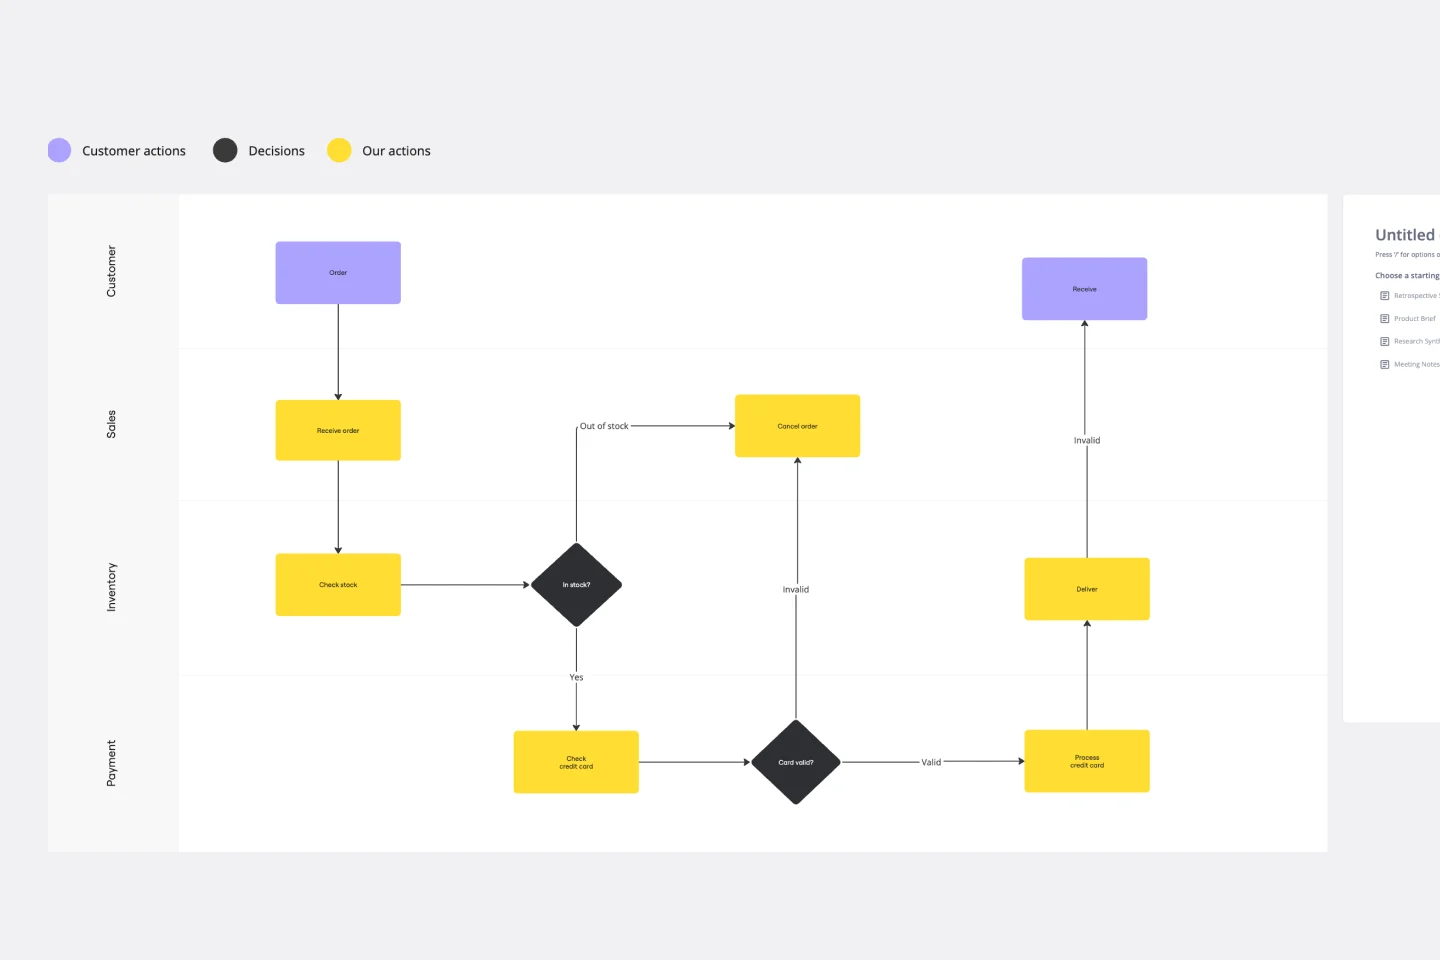
Swimlane Diagram Template
Works best for:
Flowcharts, Diagrams, Workflows
A swimlane diagram shows you which stakeholders are responsible for each area of your critical processes. You can use it to understand current processes or plan new ones.