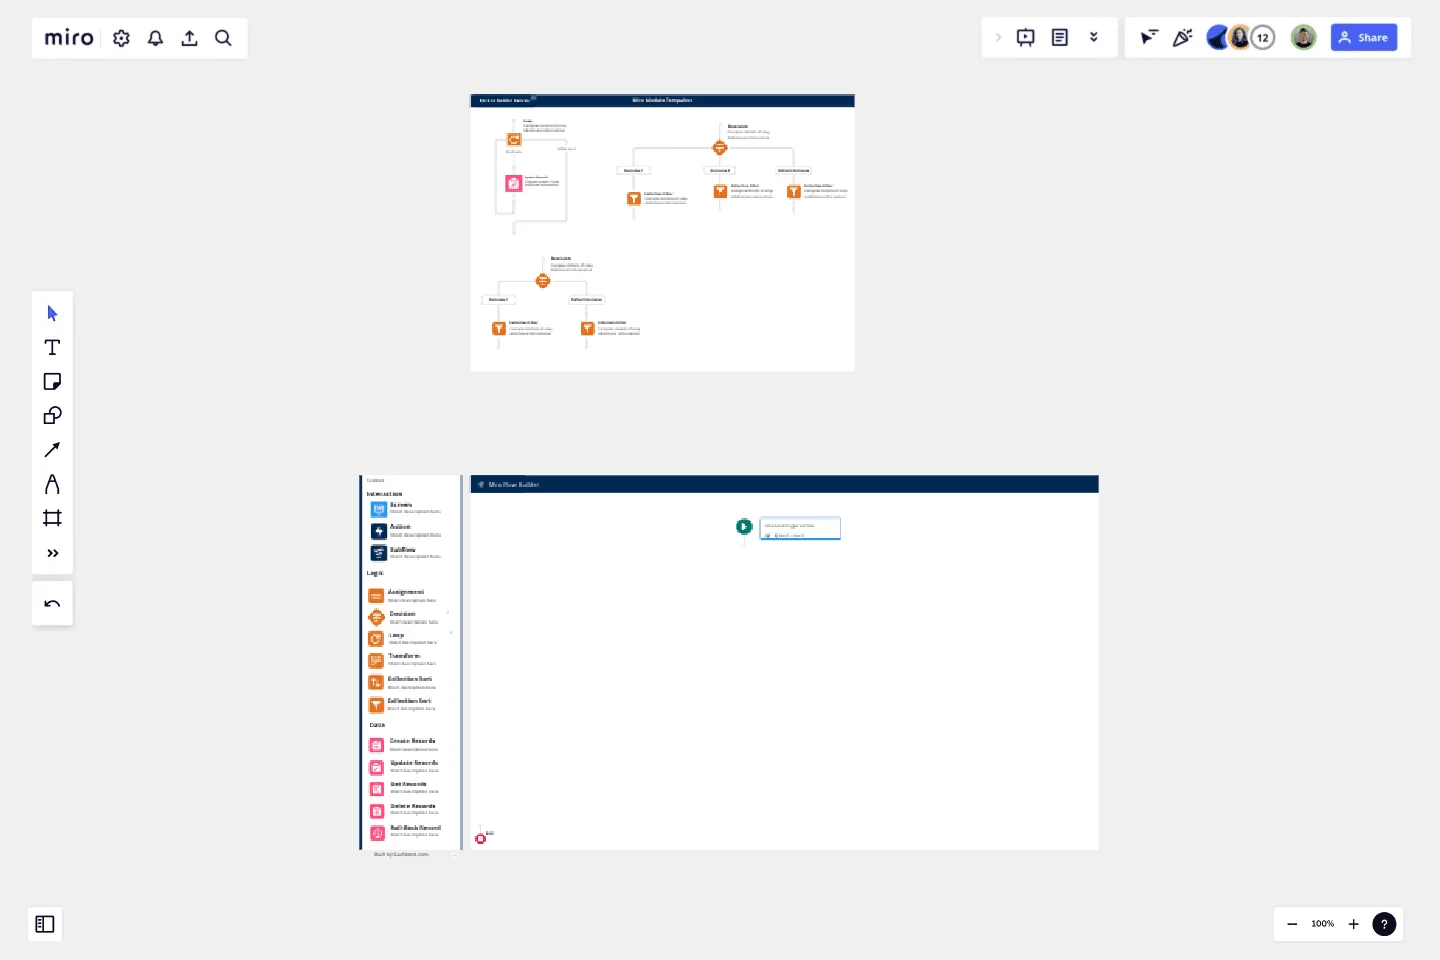
Salesforce Flow Builder
This template empowers you to create comprehensive documentation for the incredible flows you develop in Salesforce.
This template empowers you to create comprehensive documentation for the flows you develop in Salesforce, making it an essential resource for training, change management, and team collaboration.
The template excels in two main areas:
Facilitating feedback collection without requiring Salesforce access.
Tracking and annotating Salesforce workflows post-build with detailed notes and context.
Designed to address the critical challenge of documenting complex automations, this template aims to make documentation woes a thing of the past.
This template was created by Stephen Stouffer.
Get started with this template right now.
Use Case Diagram Template
Works best for:
Marketing, Market Research, Diagrams
A use case diagram is a visual tool that helps you analyze the relationships between personas and use cases. Use case diagrams typically depict the expected behavior of the system: what will happen and when. A use case diagram is helpful because it allows you to design a system from the perspective of the end user. It’s a valuable tool for communicating your desired system behavior in the language of the user, by specifying all externally visible system behavior.
Service Blueprinting Workshop
Works best for:
Agile
The Service Blueprinting Workshop template helps teams visualize and improve service processes. It includes ice breakers, context canvas, empathy maps, and action plans for service transitions. Use it to align teams, identify opportunities, and prototype service delivery from a macro to microscopic level, ensuring a comprehensive understanding of service orchestration and seamless collaboration. Ideal for remote and dispersed teams.
ICS Org Chart Template
Our carefully crafted ICS Org Chart Template is an invaluable tool designed to clearly represent the hierarchical structure of the Incident Command System (ICS). It simplifies the complex web of roles, responsibilities, and chains of command within the ICS, providing a structured blueprint for both experienced professionals and those new to the system. The template's most notable benefit is its ability to foster immediate understanding, bridging the gap between intricate organizational structures and the teams navigating them. Teams that use this template can ensure that everyone is aligned, understands their role, and collaborates efficiently, thereby reducing potential bottlenecks and misunderstandings.
Strategic Action Framework
Works best for:
Roadmap, Planning, Mapping
The Strategic Action Framework template provides a structured approach for developing and implementing strategic initiatives. By defining goals, strategies, and action plans, teams can align their efforts with organizational objectives and drive progress towards desired outcomes. This template fosters collaboration and accountability, ensuring that strategic initiatives are executed effectively and deliver measurable results.
User Flows
The User Flows template offers a visual tool for mapping out the sequence of steps that users take to accomplish a specific task or achieve a goal within a digital product or service. It provides elements for documenting user interactions, screens, and decision points along the user journey. This template enables UX designers and product teams to understand user behaviors, identify pain points, and optimize the user experience effectively. By promoting user-centric design and empathy, the User Flows template empowers teams to create intuitive and engaging digital experiences that meet user needs and drive satisfaction.
Ecomap Template
Works best for:
Strategy & Planning, Diagramming
The Ecomap Template illustrates the multifaceted relationships and environmental interactions encircling an individual or entity. Determine crucial patterns and dynamics by providing a clear and comprehensive visualization of how different systems intertwine and influence each other.
