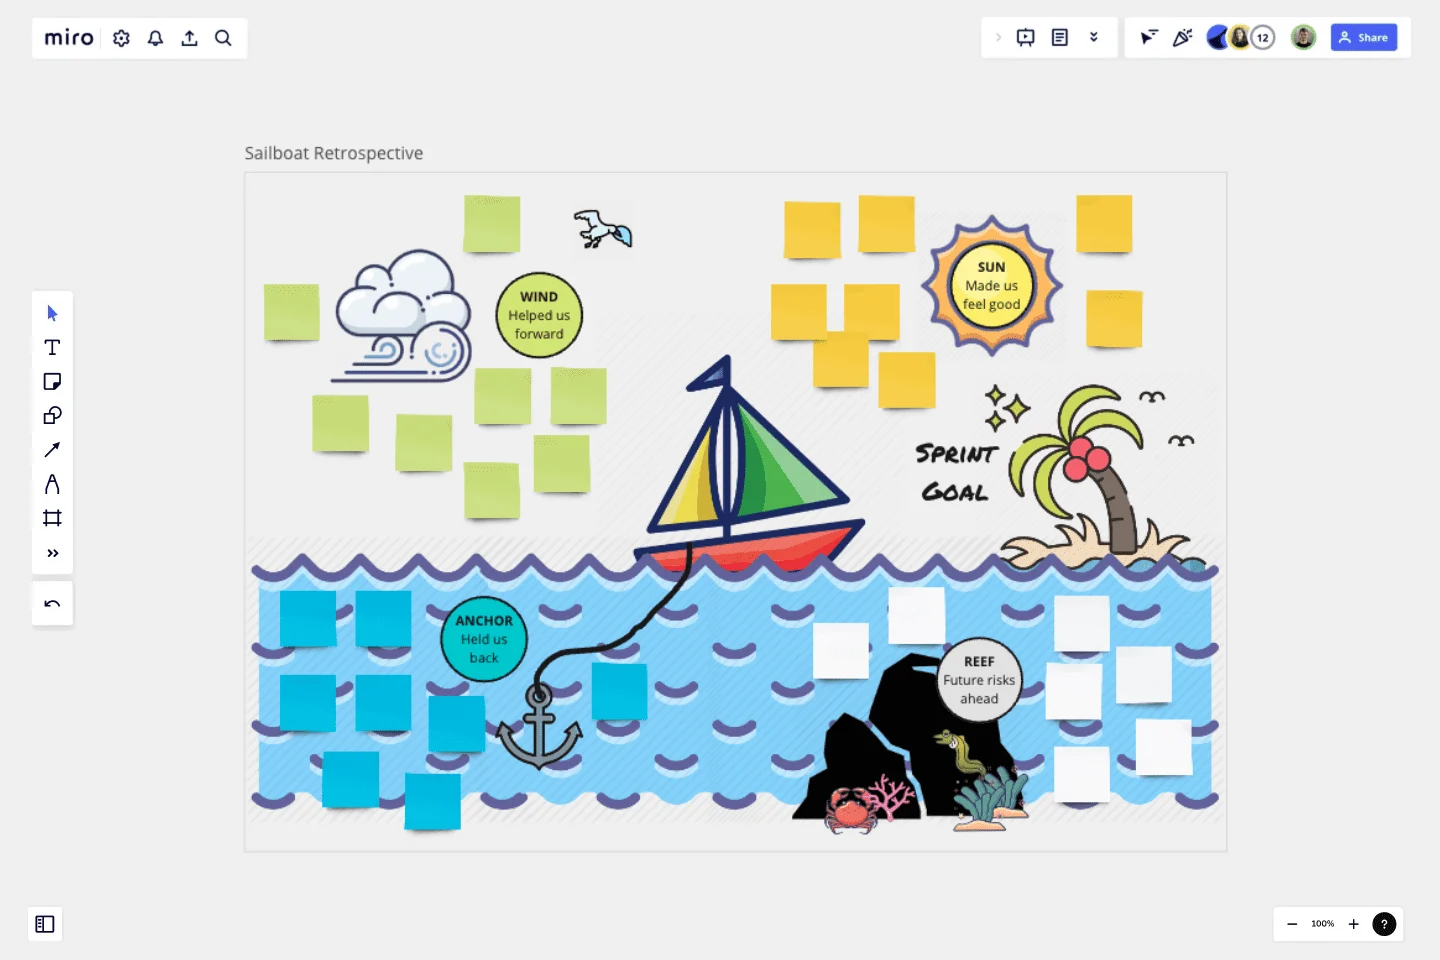
Sailboat Retro
Sailboat Retrospective is a fun and easy way to boost the communication of what went well and what slowed the team during current sprint.
Based on the topics addressed during the retrospective, the team agrees on the improvement activities needed for future sprint.
The tropical island represents the set sprint goal they have aimed to achieve in their daily work during the sprint.
The Wind represents everything helping them to achieve the sprint goal, pushing the team's sails boat to go even faster.
The Sun represents all the things making them feel good and happy during work. As a retrospective is a time for team celebration this is a highly appreciated topic to bring up and an opportunity to bring forward kudos to your team friends.
The Anchor on the Sailing boat represents everything that is slowing us down an holding us back on the journey towards the sprint goal.
The Reef represents potential risks ahead that we see will jeopardize future sprint work.
How to use the Sailboat Retrospective
Set the stage - start the Retrospective by introducing the team of the sailboat metaphor.
Reflect and write individually - Give each team member 7 min to individually write down stickies on the board in the different areas of the sailboat canvas.
Present and discuss in pairs - Have breakout sessions with 2 (or 3) persons in each breakout room where they present their stickies to each other.
Summarize - Each pair summarize the discussion during breakout so all team members can hear what has been discussed. Opportunity to ask questions if any.
Group stickies - In case of more than one sticky with the same topics the team agrees upon grouping them together.
Voting - Time for team voting on the topic(s) that needs focus going forward. It could be topics helping the team go forward so they need continue with these to keep momentum, or topics related to what is slowing them down or potential risks coming up.
Find Actions - Based on the highest voted topic(s) the teams agree on improvement action going forward in the next sprint.
This template was created by Johanna Torstensson.
Get started with this template right now.
4 L's Retrospective Template
Works best for:
Retrospectives, Decision Making
So you just completed a sprint. Teams busted their humps and emotions ran high. Now take a clear-eyed look back and grade the sprint honestly—what worked, what didn’t, and what can be improved. This approach (4Ls stand for liked, learned, lacked, and longed for) is an invaluable way to remove the emotion and look at the process critically. That’s how you can build trust, improve morale, and increase engagement—as well as make adjustments to be more productive and successful in the future.
I Like | I Wish | I Wonder
Works best for:
Agile
Feedback is a key part of any project development and crucial to the iterative process.
Quick Retrospective Template
Works best for:
Education, Retrospectives, Meetings
A retrospective template empowers you to run insightful meetings, take stock of your work, and iterate effectively. The term “retrospective” has gained popularity over the more common “debriefing” and “post-mortem,” since it’s more value-neutral than the other terms. Some teams refer to these meetings as “sprint retrospectives” or “iteration retrospectives,” “agile retrospectives” or “iteration retrospectives.” Whether you are a scrum team, using the agile methodology, or doing a specific type of retrospective (e.g. a mad, sad, glad retrospective), the goals are generally the same: discovering what went well, identifying the root cause of problems you had, and finding ways to do better in the next iteration.
Taco Tuesday Retrospective
Works best for:
Agile Methodology, Retrospectives, Meetings
The Taco Tuesday Retrospective template offers a fun and informal approach to retrospectives, perfect for fostering team camaraderie. It provides elements for reflecting on past iterations over a casual taco-themed gathering. This template enables teams to relax, share insights, and brainstorm ideas in a laid-back atmosphere. By promoting social interaction and creativity, the Taco Tuesday Retrospective empowers teams to strengthen relationships, boost morale, and drive continuous improvement effectively.
Retrospective - Summer
Works best for:
Retrospectives, Agile Methodology, Meetings
The Retrospective - Summer template offers a seasonal and themed approach to retrospectives, perfect for capturing the spirit of summer. It provides elements for reflecting on achievements, experiences, and goals amidst the summer backdrop. This template enables teams to relax, recharge, and recalibrate their efforts for the upcoming season. By promoting reflection and rejuvenation, the Retrospective - Summer empowers teams to celebrate successes, learn from setbacks, and embark on new adventures with renewed energy and enthusiasm effectively.
Service Blueprint by Hyperact
Works best for:
Research & Design
The Service Blueprint template is perfect for visualizing the orchestration of service components. It maps out frontstage and backstage elements, helping you analyze and enhance customer experiences. Use this template to align teams, identify pain points, and streamline processes, ensuring a seamless service delivery. It's ideal for creating a shared understanding of service dynamics among stakeholders and collaborators.
