RAID log templates
Miro's RAID log templates help you manage risks, actions, issues, and decisions effortlessly. Whether you're planning, tracking, or resolving, these templates provide a clear structure to stay organized, align your team, and drive project success.
RAID Log Template
Works best for:
Agile Methodology, Project Management, Agile Workflows
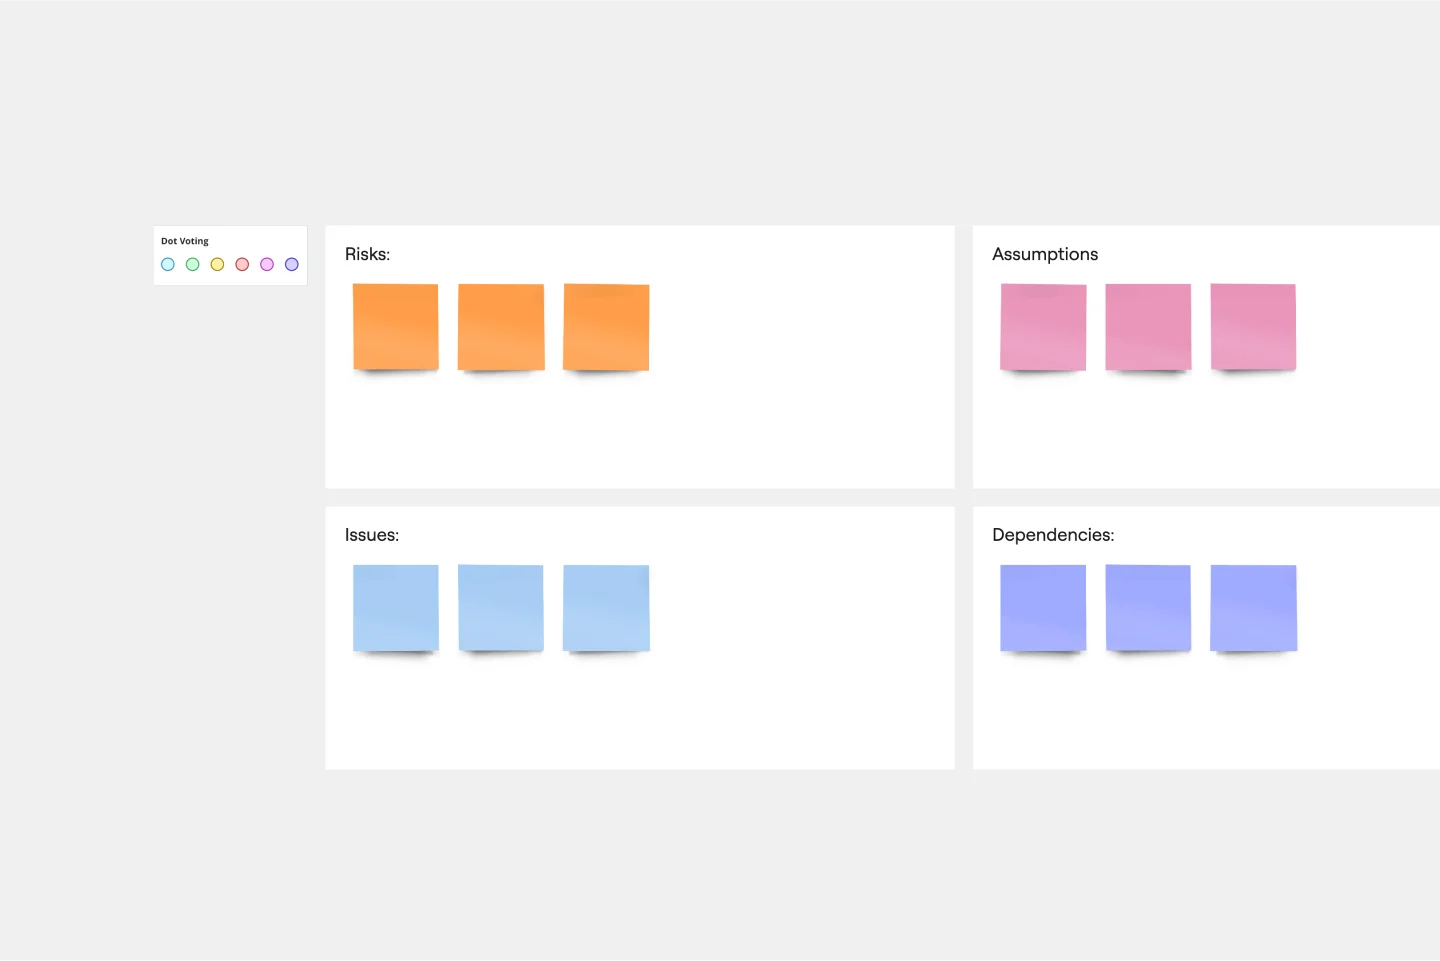
Use the RAID Log template to better understand potential risks, assumptions, issues, and dependencies relating to an upcoming project. With this information, you can make effective contingency plans and prepare your resources accordingly. You’ll know what could go wrong throughout the project and how to fix the problem.
Ansoff Matrix Template
Works best for:
Leadership, Operations, Strategic Planning
Keep growing. Keep scaling. Keep finding those new opportunities in new markets—and creative new ways to reach customers there. Sound like your approach? Then this template might be a great fit. An Ansoff Matrix (aka, a product or market expansion grid) is broken into four potential growth strategies: Market Penetration, Market Development, Product Development, and Diversification. When you go through each section with your team, you’ll get a clear view of your options going forward and the potential risks and rewards of each.
Risk Assessment Template
Works best for:
Leadership, Project Management, Decision Making
Every business faces risk. The more you factor it into your decisions early on, the better prepared you’ll be to avoid, absorb, or mitigate the risks you encounter. Use Miro’s risk assessment template to collaborate on a clear-eyed risk assessment that ensures you’ll never be caught unawares.
Risk Matrix Template
Works best for:
Leadership, Decision Making, Strategic Planning
A risk matrix--also known as a probability matrix, risk assessment matrix, or impact matrix--is a tool that allows you to evaluate overall risk by visualizing potential risks in a diagram. The tool allows you to weigh the severity of a potential risk against the probability that the risk might occur. Risk matrices are useful for risk management because they visually represent the risks involved in a decision. This empowers you to avoid worst-case scenarios by preparing contingencies or mitigation plans.
Join thousands of teams collaborating and doing their best work on Miro.
Sign up freeAbout the RAID log templates collection
RAID log templates are essential tools for project managers and agile teams to keep track of Risks, Assumptions, Issues, and Dependencies. Our RAID log templates help teams visualize and manage these critical elements effectively, ensuring that projects run smoothly and potential obstacles are addressed promptly. With Miro's visual planning capabilities, teams can collaborate in real time, making it easier to identify and mitigate risks, track assumptions, resolve issues, and manage dependencies.
Why you'll love our RAID log templates
Using Miro's RAID log templates offers many benefits that can significantly enhance your project management and agile processes:
Better visualization: Miro's visual planning capabilities allow you to see all elements of your RAID log at a glance, making it easier to understand and manage complex projects.
Real time collaboration: Teams can work together in real time, ensuring that everyone is on the same page and can contribute to identifying and resolving issues as they arise.
Improved risk management: By keeping track of risks in a structured way, you can proactively address potential problems before they impact your project.
Streamlined assumption tracking: Documenting assumptions helps ensure that all team members
are aware of the project's foundational elements, reducing misunderstandings and miscommunications.
Efficient issue resolution: Quickly identify and fix issues to keep your project on track and avoid delays.
Dependency management: Manage dependencies effectively to ensure that all project components are aligned and progressing as planned.
How to use the RAID log templates in Miro
Using Miro's RAID log templates is straightforward and can be broken down into a few simple steps:
Access the template: Start by accessing the RAID log template from Miro's template library. You can find it by searching for "RAID log template" or "agile RAID log template" in the library.
Customize the template: Tailor the template to fit your project's specific needs. Add columns or sections for Risks, Assumptions, Issues, and Dependencies, and customize the fields as necessary.
Identify and document: Begin by identifying and documenting all relevant risks, assumptions, issues, and dependencies. Use Miro's visual tools to add notes, comments, and links to relevant documents or resources.
Collaborate with your team: Invite your team members to collaborate on the RAID log. Use Miro's real-time collaboration features to discuss and update the log as needed.
Monitor and update: Regularly review and update the RAID log to ensure that it remains current and accurate. Use Miro's notification and reminder features to keep track of any changes or updates.
By following these steps, you can effectively use Miro's RAID log templates to manage your projects and help your team thrive. Miro's intuitive and collaborative platform ensures that all team members are engaged and informed, leading to more successful project outcomes.
