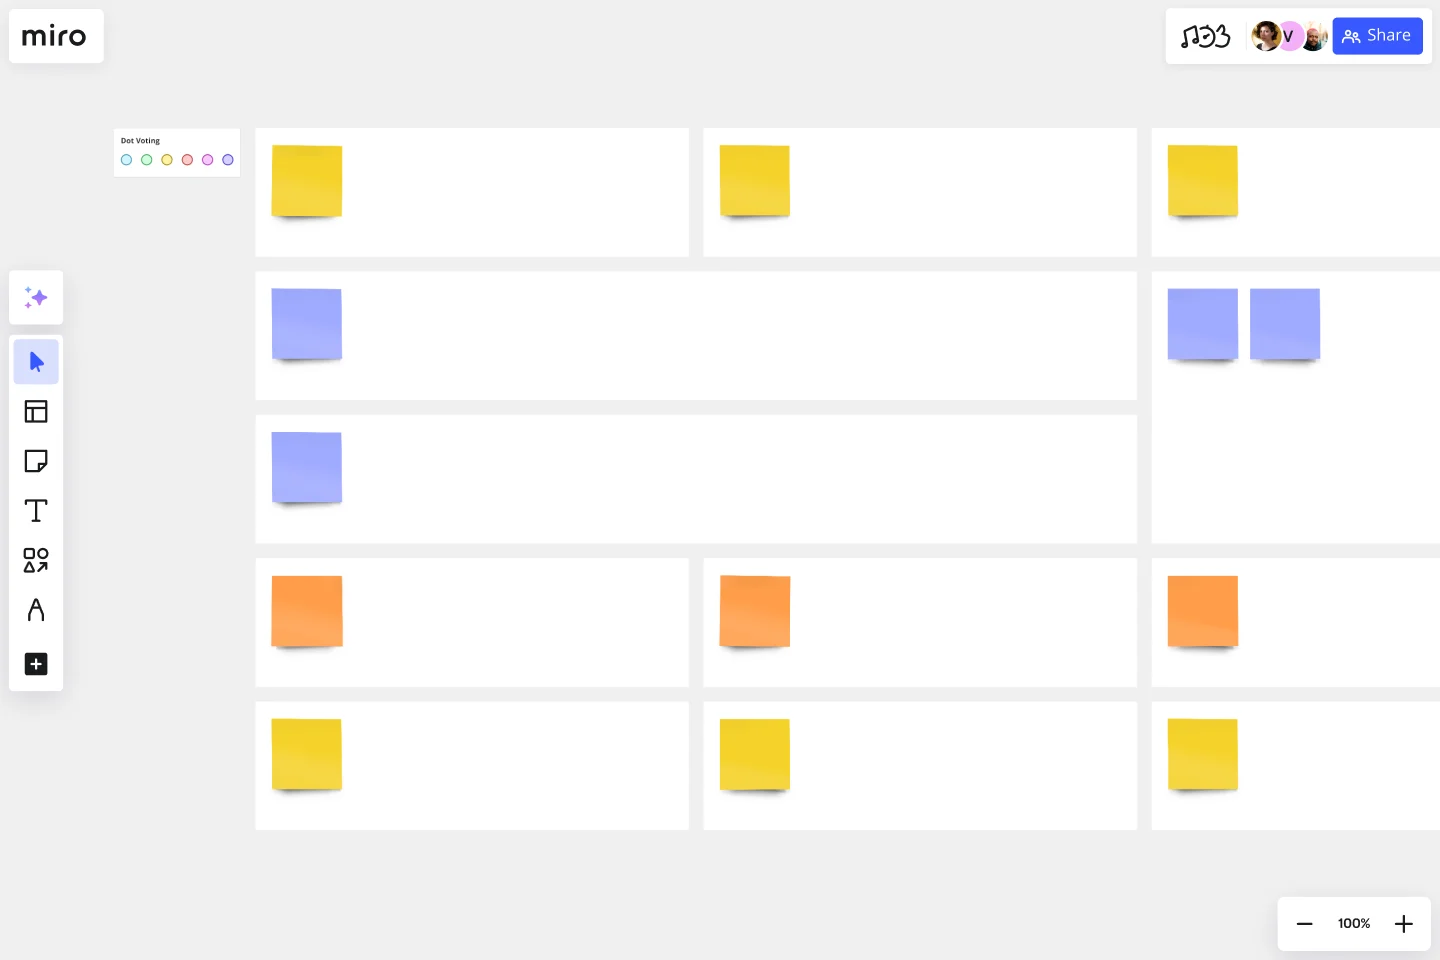
Project Canvas Template
Get everyone involved and understanding the project in a simple way
About the Project Canvas Template
Project Canvas II is a project management tool that helps you summarize, visualize, and share all necessary information about your project, allowing you to keep all stakeholders in the project development process in the loop. This tool will build a clear project overview and improve collaboration.
Project Canvas II template is one of two Project Canvas II templates represented in Miro. This one is more suitable for Project Management.
What is a Project Canvas used for?
Project Canvas can be used by all team members—from facilitators to project management professionals—at every stage of the project development. Having a platform for all project-related discussion will simplify the challenge of communication when there are so many parties and moving parts involved.
Project Planning Canvas gives all involved team members a clear, common communication framework. This visual management tool will help you avoid misunderstandings, share the common vision with a team and improve collaboration.
Getting started with the Project Canvas template
When you use Miro to create the Project Canvas, you can:
Fill out Miro’s ready-made template to visualize your project’s framework.
Share online access and include your team in brainstorming project possibilities while covering all necessary parameters.
Use Miro special features to grab some inspiration for your projects.
Try integrations with Atlassian JIRA, Google Drive, Slack, etc., to collaborate seamlessly with your team.
Discover more project charter examples and simplify your planning.
Get started with this template right now.
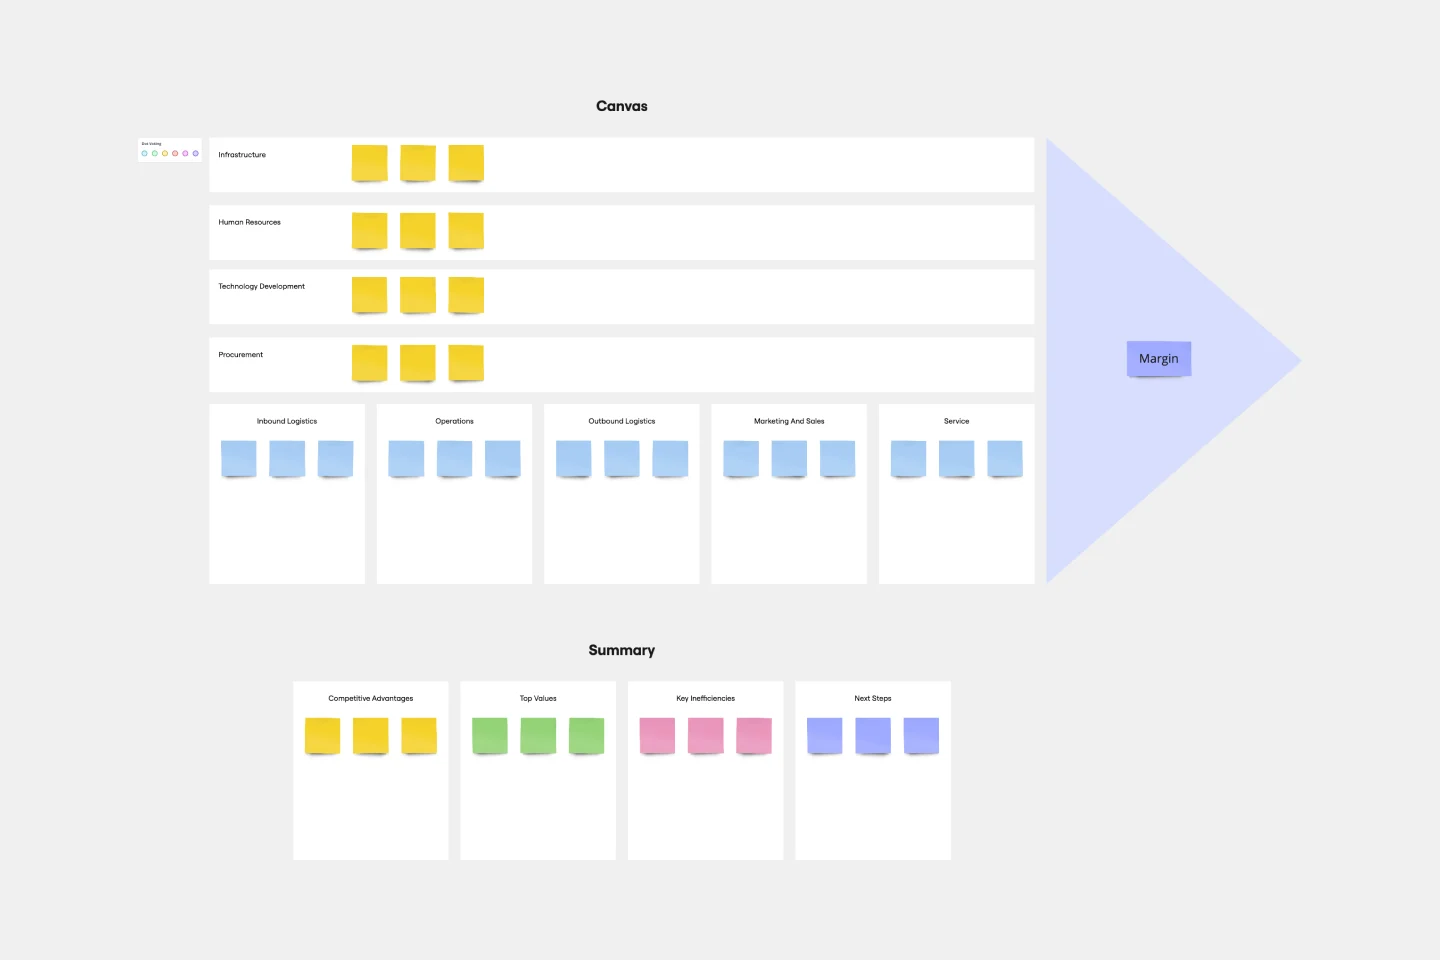
Value Chain Analysis Template
Works best for:
Leadership, Strategic Planning, Workflows
First coined by Harvard Business School professor Michael Porter, the value chain analysis helps your team evaluate your business activities so you can find ways to improve your competitive advantage. A value chain is a set of activities that a company performs in order to deliver a valuable product from start to finish. The analysis itself allows your team to visualize all the business activities involved in creating the product—and helps you identify inefficiencies, bottlenecks, and miscommunication within the process.
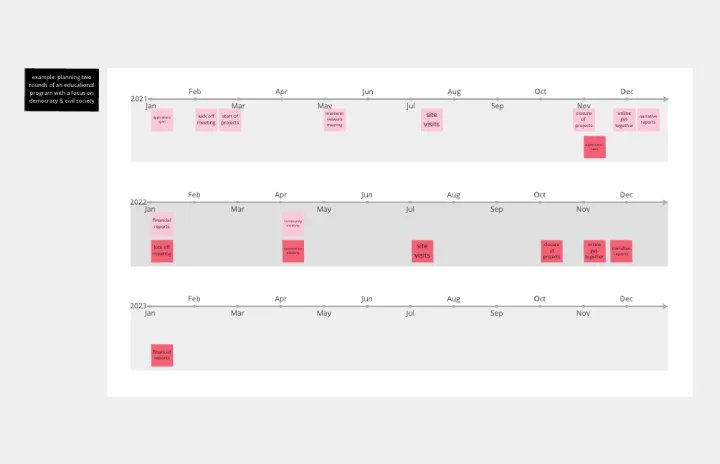
Year Timeline Template
Works best for:
Timeline, Planning
The Year Timeline template provides a comprehensive view of annual events and milestones. Perfect for planning yearly goals, tracking progress, and scheduling important dates, this template helps you stay organized and focused throughout the year.
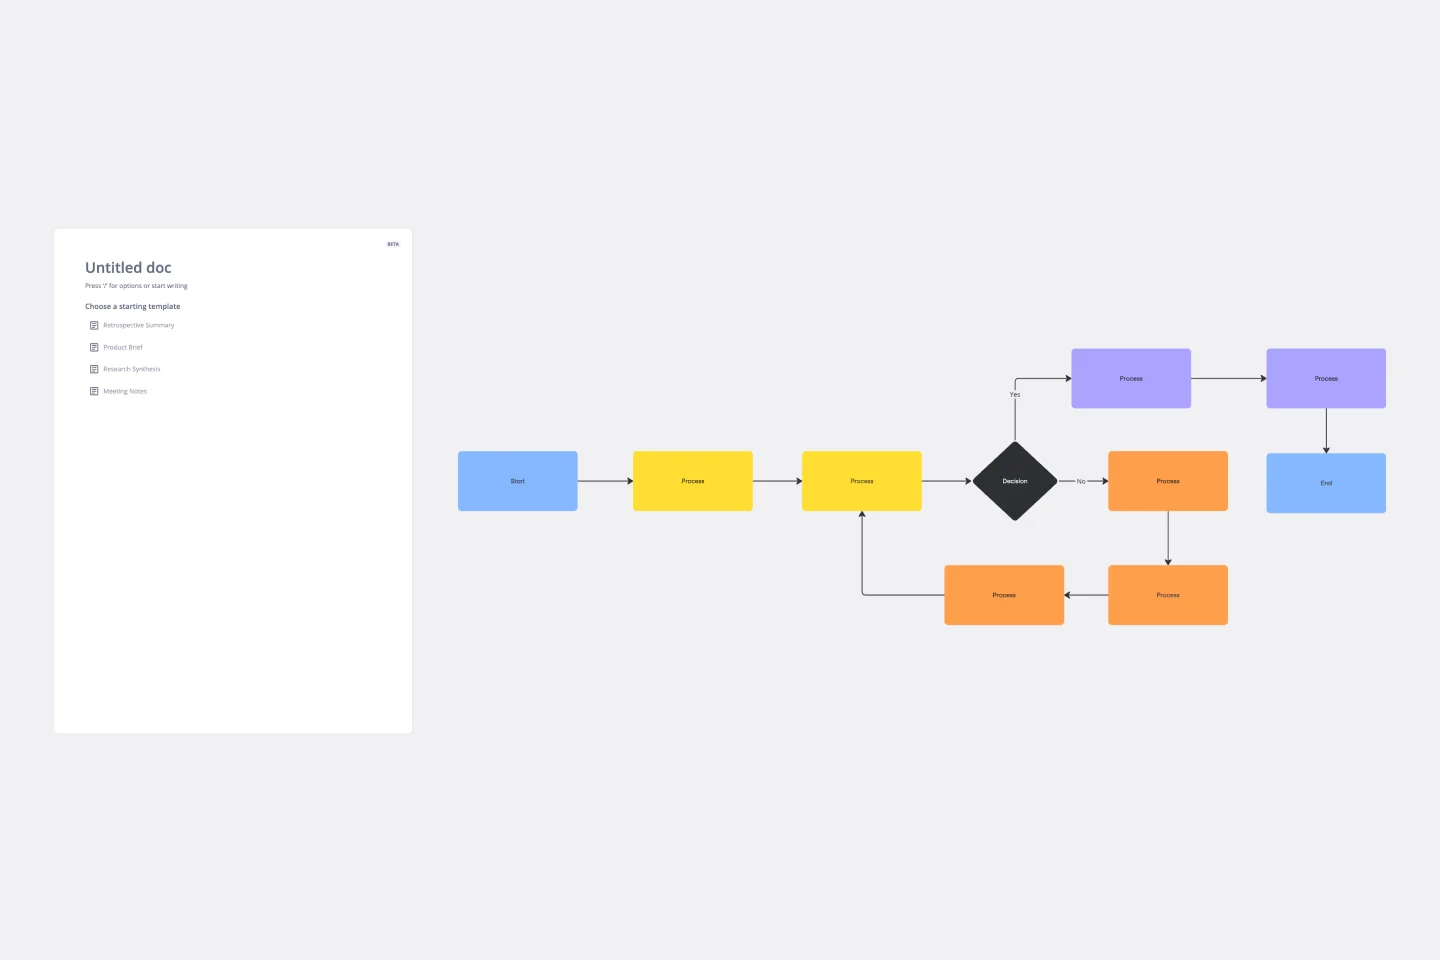
Flowchart Template
Works best for:
Flowcharts, Mapping, Diagrams
Trying to explain a process or workflow to your team — or just wrap your head around it yourself? Sometimes the best way is to see it, and that’s when you create a flowchart. Using common shapes (generally just ovals, rectangles, diamonds, and arrows), a flowchart shows you the direction a process or workflow goes and the order of steps. Beyond giving you a clear understanding, you’ll also be able to see potential flaws and bottlenecks, which helps you refine and improve your process and create a better product more efficiently.
Corrective Action Plan Template
Works best for:
Project Management, Operations, Strategic Planning
For a manager or HR leader, it’s the least fun part of the job: Documenting an employee’s performance issues and talking about them directly to that employee. A corrective action plan makes that tough task a little easier by putting issues into a professional, written framework. That way the process, next steps, and details of the conversations are all clearly documented. This template will enable you to eliminate murky communication, align on expectations, and provide step-by-step instructions for your employee.
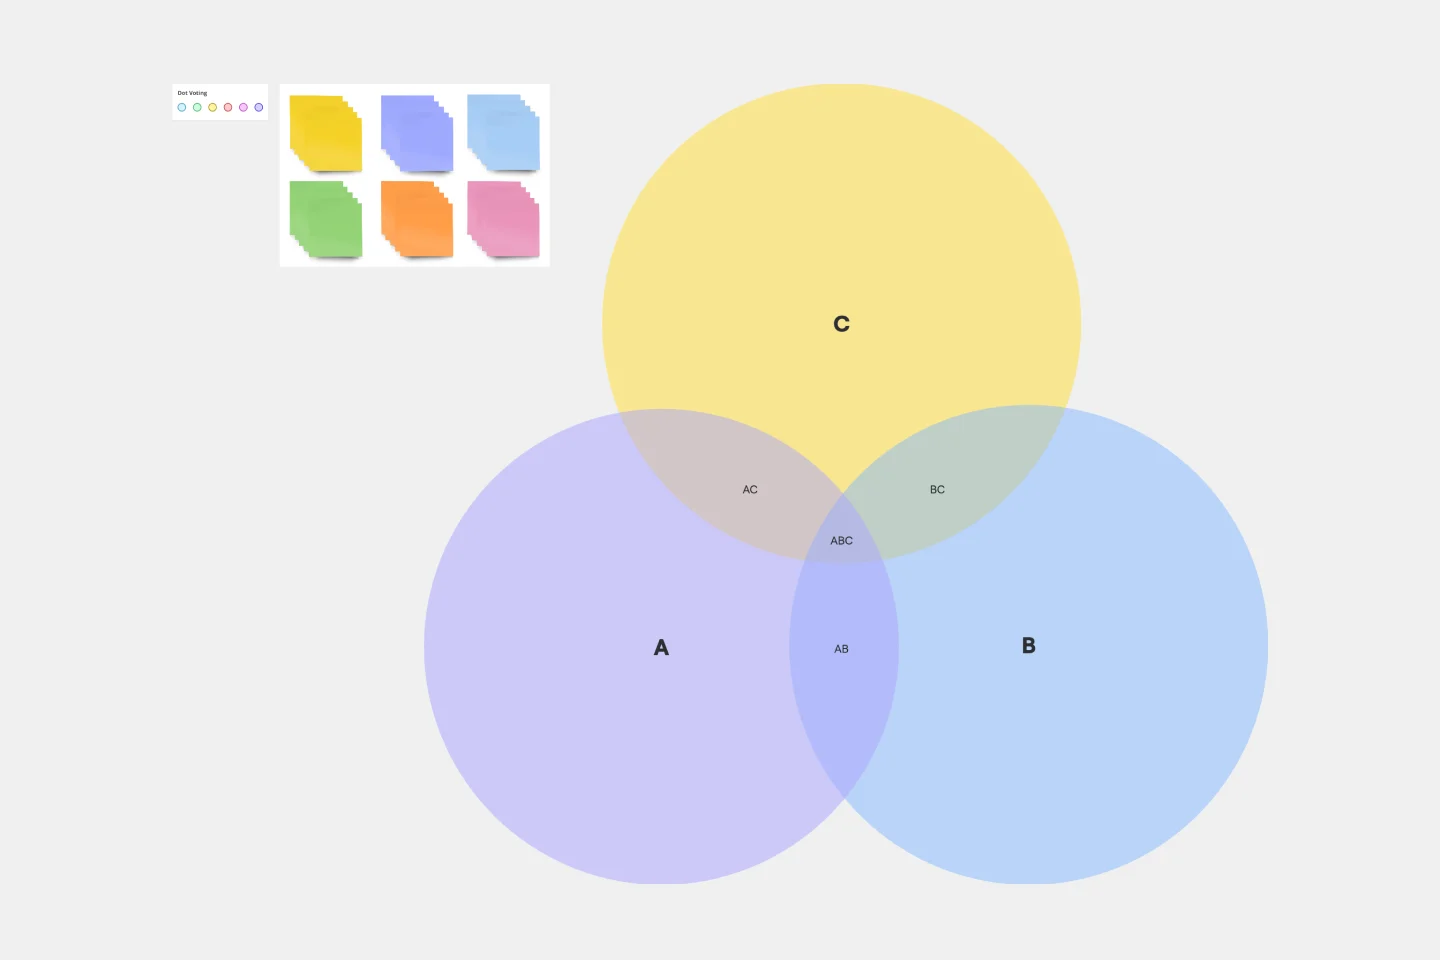
3-Circle Venn Diagram
Works best for:
Education, Diagrams, Brainstorming
Venn diagrams have been a staple of business meetings and presentations since the 1800s, and there’s a good reason why. Venn diagrams provide a clear, effective way to visually showcase relationships between datasets. They serve as a helpful visual aid in brainstorming sessions, meetings, and presentations. You start by drawing a circle containing one concept, and then draw an overlapping circle containing another concept. In the space where the circles overlap, you can make note of the concepts’ similarities. In the space where they do not, you can make note of their differences.
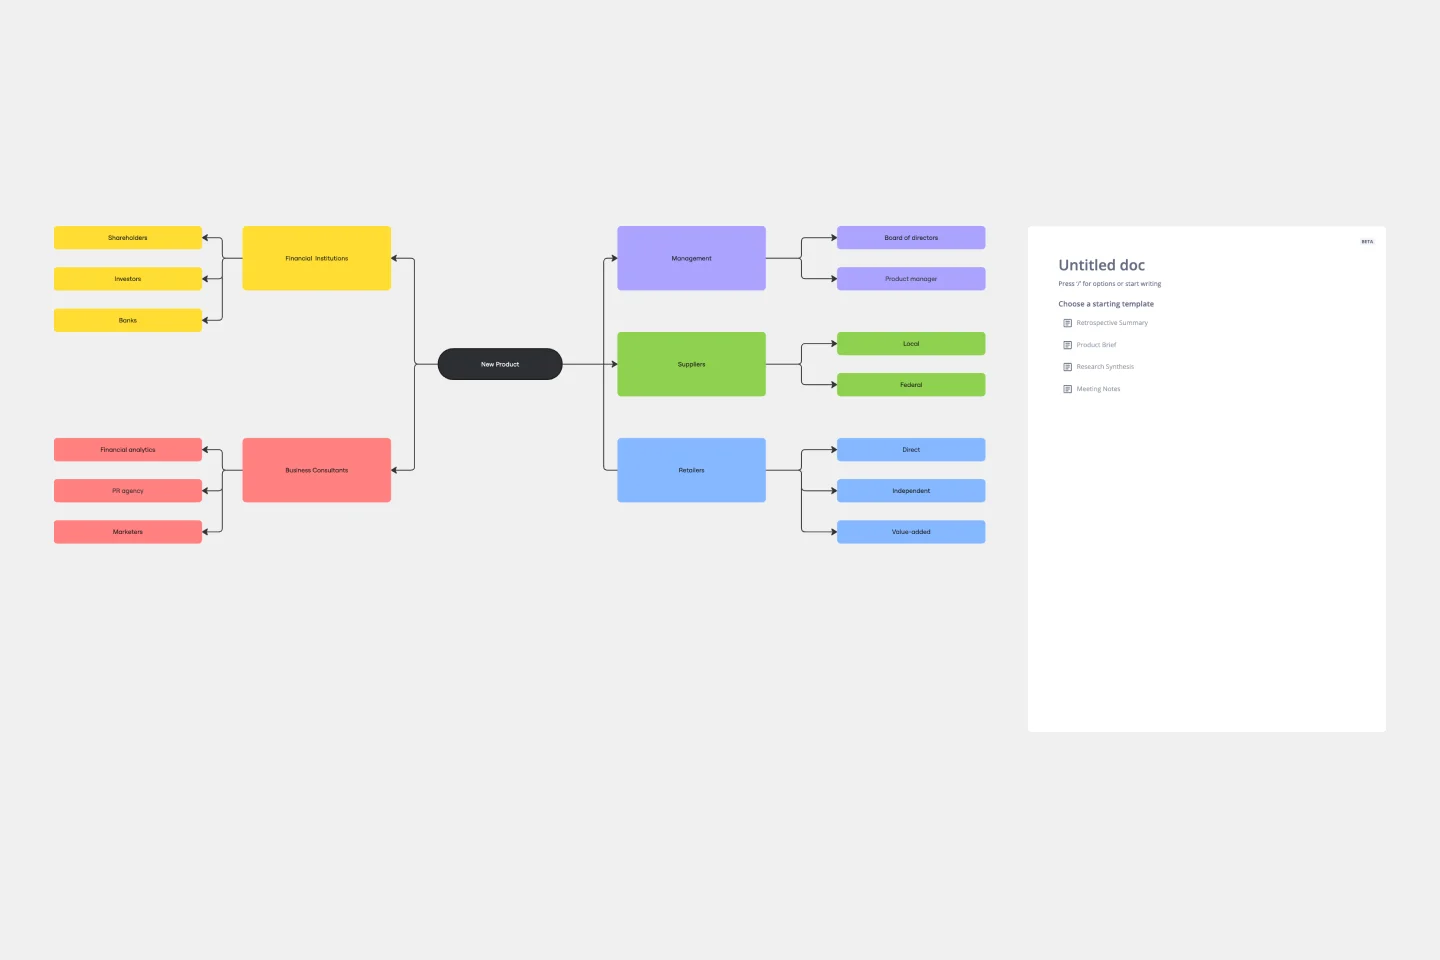
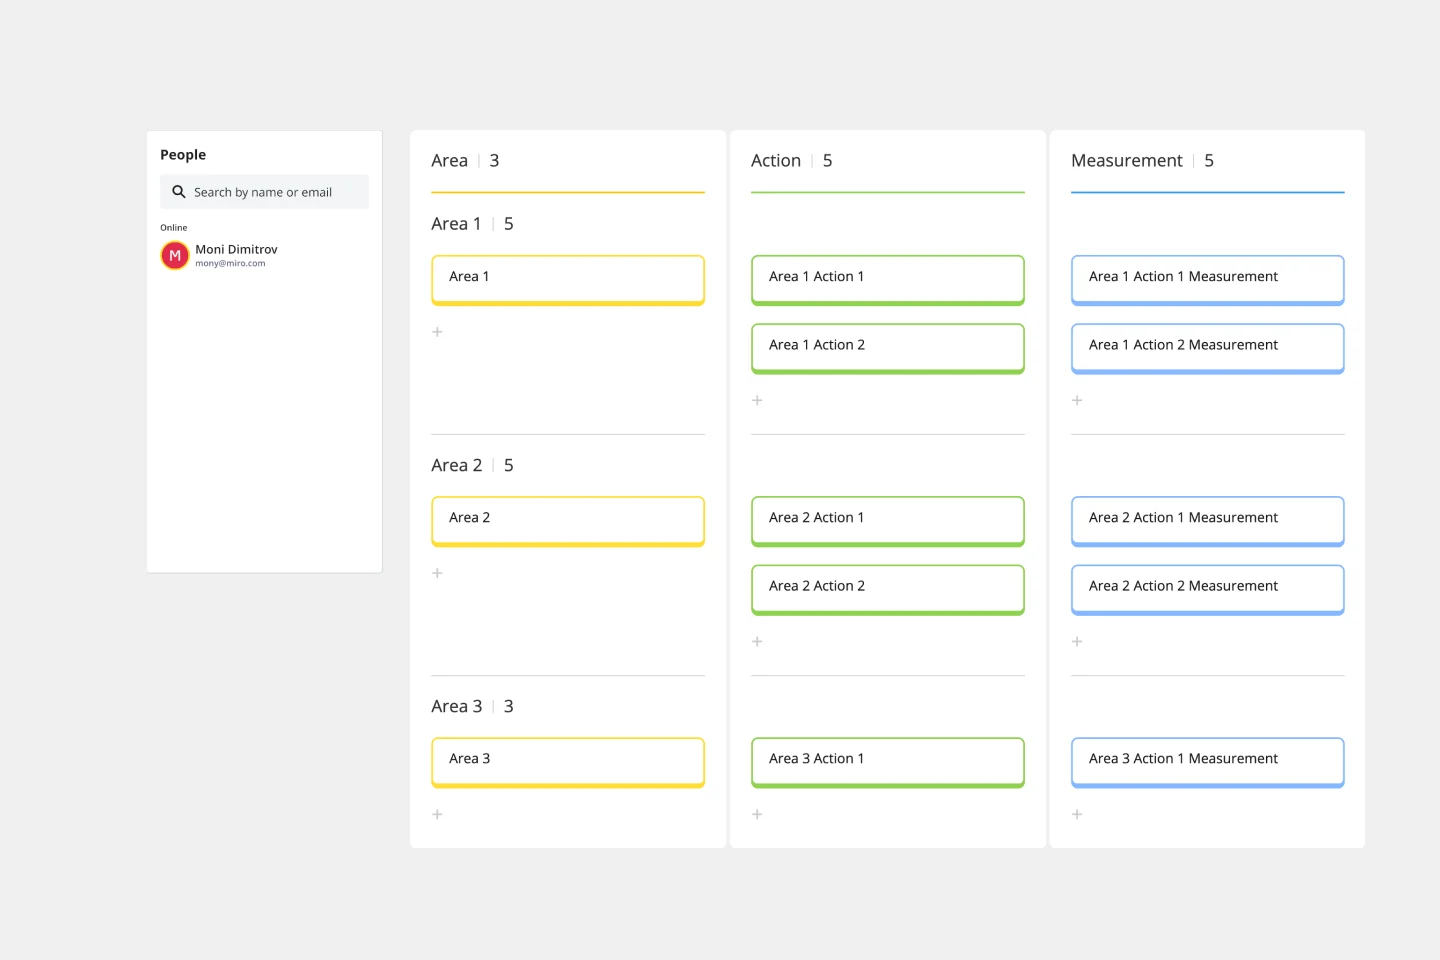
Stakeholder Mapping Template
Works best for:
Business Management, Mapping, Workflows
A stakeholder map is a type of analysis that allows you to group people by their power and interest. Use this template to organize all of the people who have an interest in your product, project, or idea in a single visual space. This allows you to easily see who can influence your project, and how each person is related to the other. Widely used in project management, stakeholder mapping is typically performed at the beginning of a project. Doing stakeholder mapping early on will help prevent miscommunication, ensure all groups are aligned on the objectives and set expectations about outcomes and results.