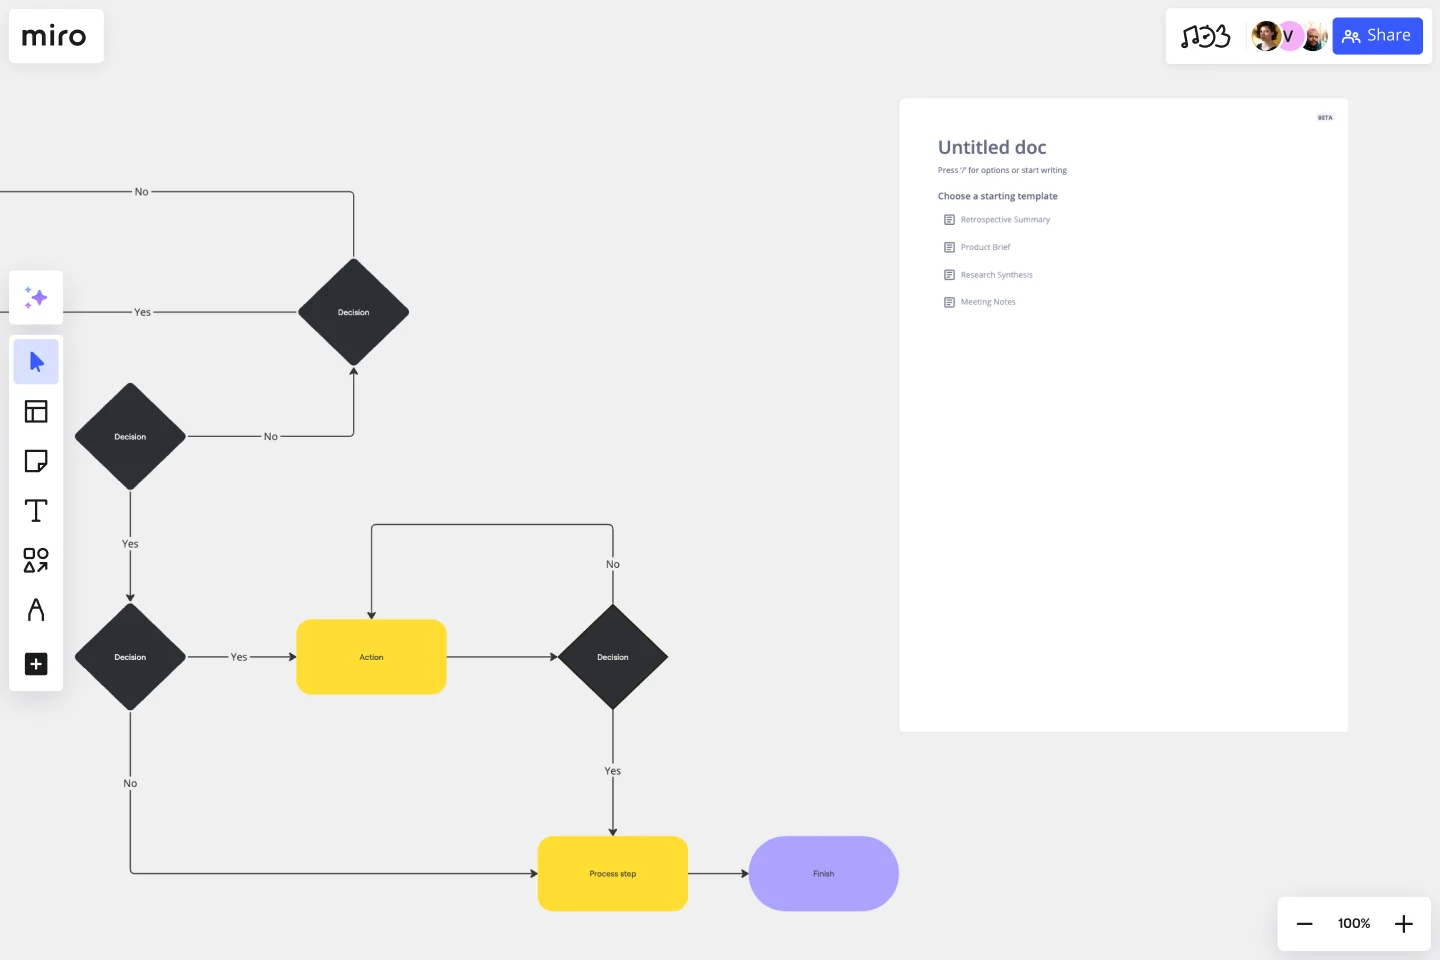
Production Flowchart Template
Map processes from start to finish and reduce complexity with the production flowchart template.
About the Production Flowchart Template
Do you want to simplify your production processes? Use the production flowchart template to break down each step, visualizing the production flow and spot areas for optimization.
The template consists of a pre-designed diagram that showcases the systematic breakdown of the production process. Each area of the template signifies a distinct phase or step in the process, making it easier to understand the progression of tasks.
The production flowchart template contains the following attributes:
Shapes: These represent different steps or processes. They can be customized to differentiate tasks, departments, or stages.
Connector Lines: These link the shapes together, indicating the sequence or flow between tasks.
Annotations: Useful for adding extra information or context about a particular process or step.
Colors: Can be applied to shapes or lines to categorize or prioritize processes.
This template can be customized to meet the unique requirements of any production, making it the perfect solution for your needs.
How to use the production flowchart template in Miro
Add your production flow: Open the template and edit the shapes, colors, and texts to represent your production process.
Expand the flowchart: Use Miro’s automated diagramming features to add more shapes and connector lines until your production process is accurately represented.
Add any extra context: Integrate other artifacts or elements on the board to provide any additional context that helps visualize or understand your production process.
Why should you use a production flowchart template?
Breaking down a production process from start to finish makes it easy to visualize complex operations. In addition to serving as a useful guide, this template has many benefits:
Provides clarity: A detailed flowchart provides a clear visualization of the production process, making it easier for all involved to understand.
Efficiency: Identifying and rectifying bottlenecks becomes straightforward when each step of the process is mapped out.
Collaboration: Team members can collaborate in real time, offering suggestions and improvements.
Optimization: With a comprehensive overview, teams can streamline operations, reducing costs and improving output.
Documentation: The template acts as a reference point, ensuring everyone follows the established procedures. The template is easy to update as the production process changes, ensuring the most up-to-date version is always shared.
If you'd prefer to start from scratch, Miro's easy flowchart tool will help you build an online flowchart in no time. With Miro's collaboration features, you can workshop it with your team and easily share it with others for feedback with tagging, comments and sticky notes.
Can I customize the shapes and colors of the template?
Absolutely! The template is designed for full customization, allowing you to adjust shapes, colors, and text to represent your process best.
Is it suitable for all types of production processes?
Yes, the template is versatile and can be used for different types of productions. Whether you're mapping a simple or complex process, the template can be adapted to fit your needs.
How can I collaborate with team members using this template?
Miro allows for real-time collaboration. Team members can simultaneously view, edit, and comment, making collective input seamless.
Are there any limitations to how much I can expand the template?
With Miro’s infinite canvas, you can expand the template as much as you need — and if things get too expansive, simply zoom out or rearrange for clarity.
Get started with this template right now.
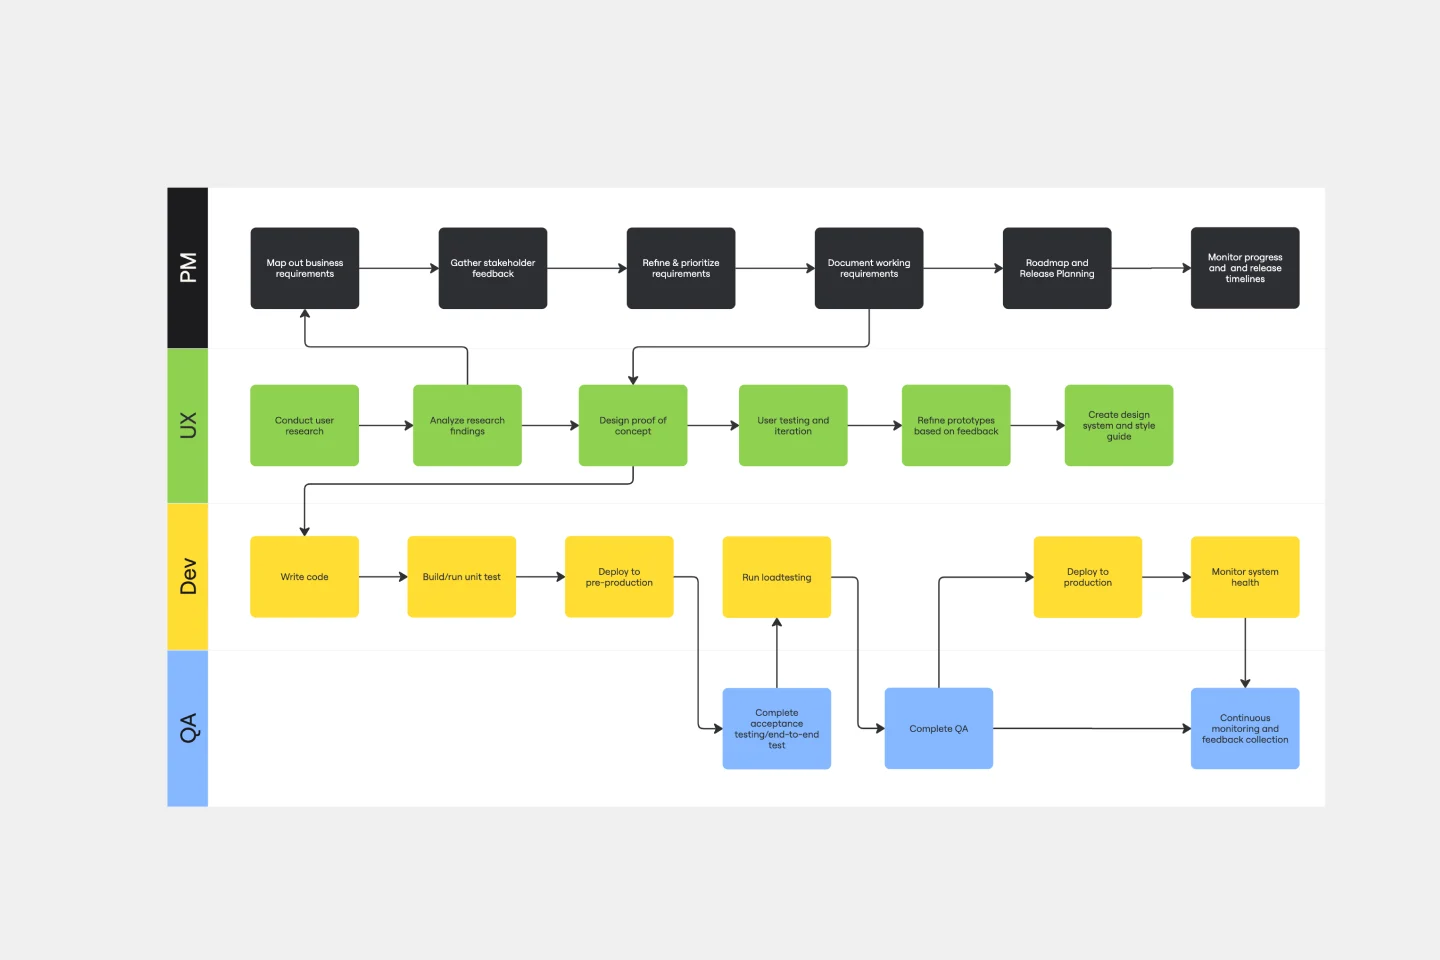
SDLC Template
Works best for:
Diagramming
The Software Development Life Cycle (SDLC) template is a well-designed visual tool that helps software development teams follow a structured approach from the initial concept to the final deployment of the software. One of the most significant benefits of using this template is that it promotes clear, streamlined communication among team members. By breaking the development cycle into distinct phases, all stakeholders can stay informed about the progress of the project and understand their responsibilities within the larger context. This enhanced communication reduces the chances of misunderstandings and ensures that everyone works together towards the common goal of delivering high-quality software. The template acts not only as a roadmap but also as a shared language for the team, improving collaboration and the efficient progression of the project through each critical stage.
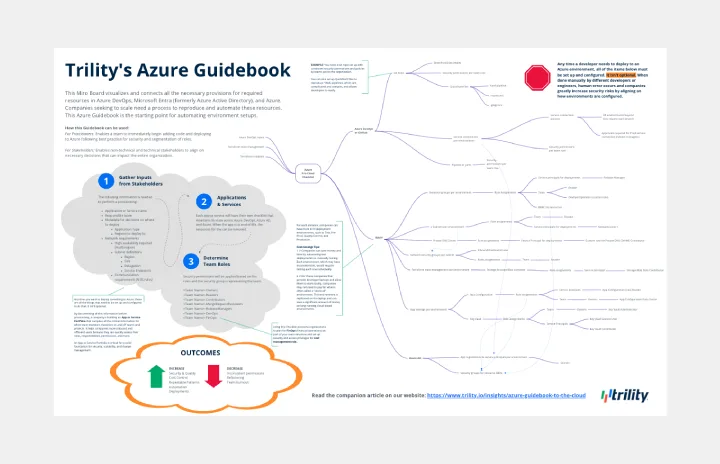
Azure Guidebook
Works best for:
Cloud Infrastructure
This Miro Board visualizes and connects all the necessary provisions for required resources in Azure DevOps, Microsoft Entra (formerly Azure Active Directory), and Azure.
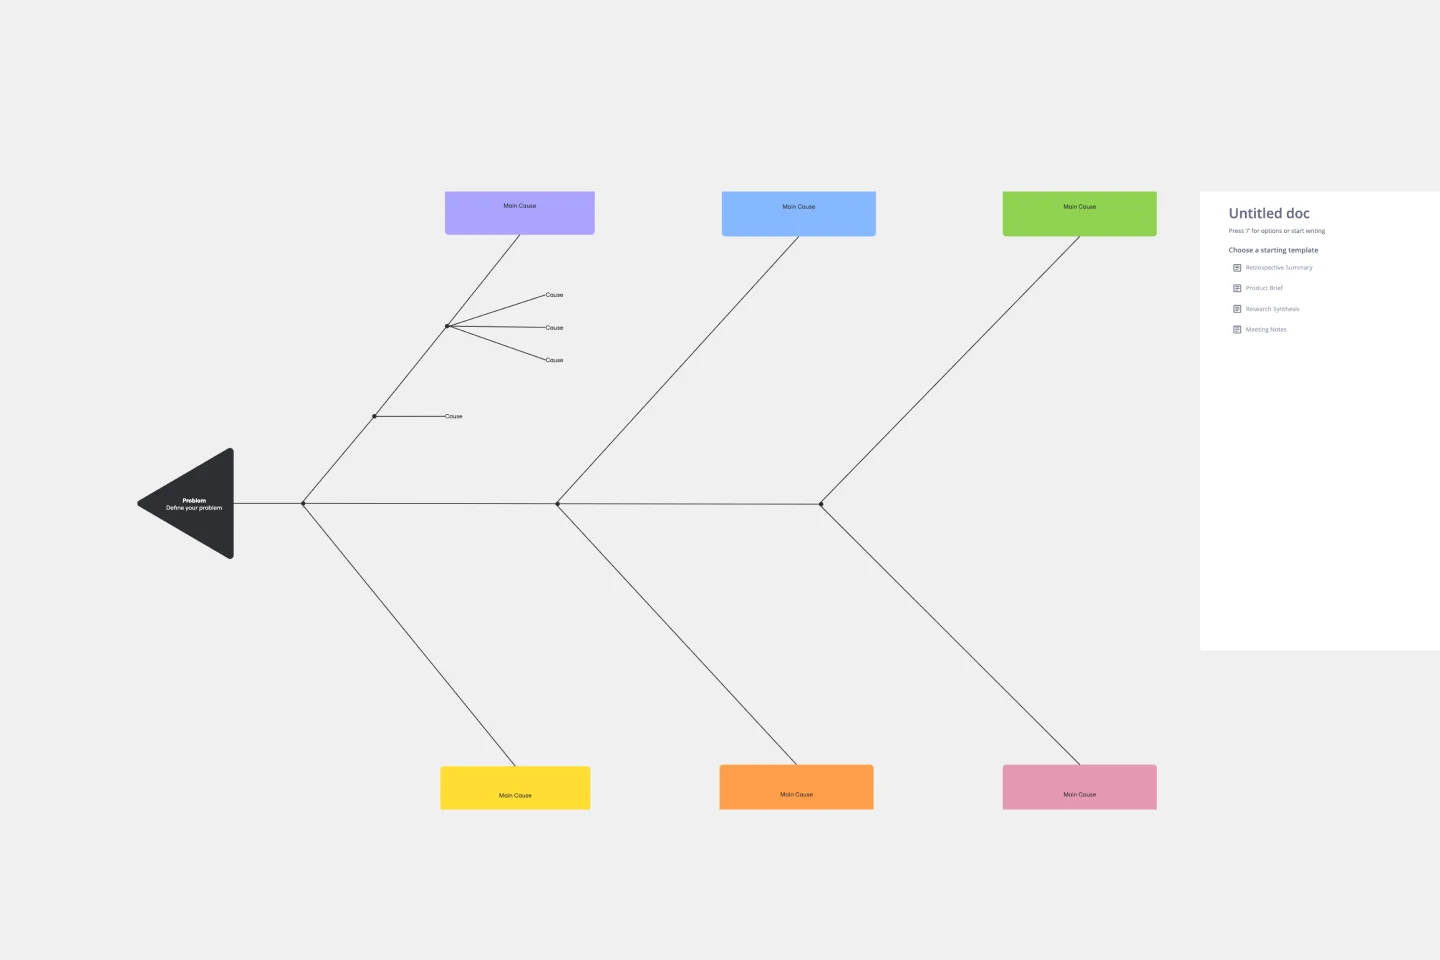
Cause and Effect Diagram Template
Works best for:
Diagramming
The Cause and Effect Diagram Template is a useful tool for analyzing complex relationships, identifying root causes of problems, and improving organizational processes. It can be customized to fit user's unique needs and provides a structured framework for analysis. Teams can use real-time collaborative analysis on the Miro platform to drive continuous improvement initiatives.
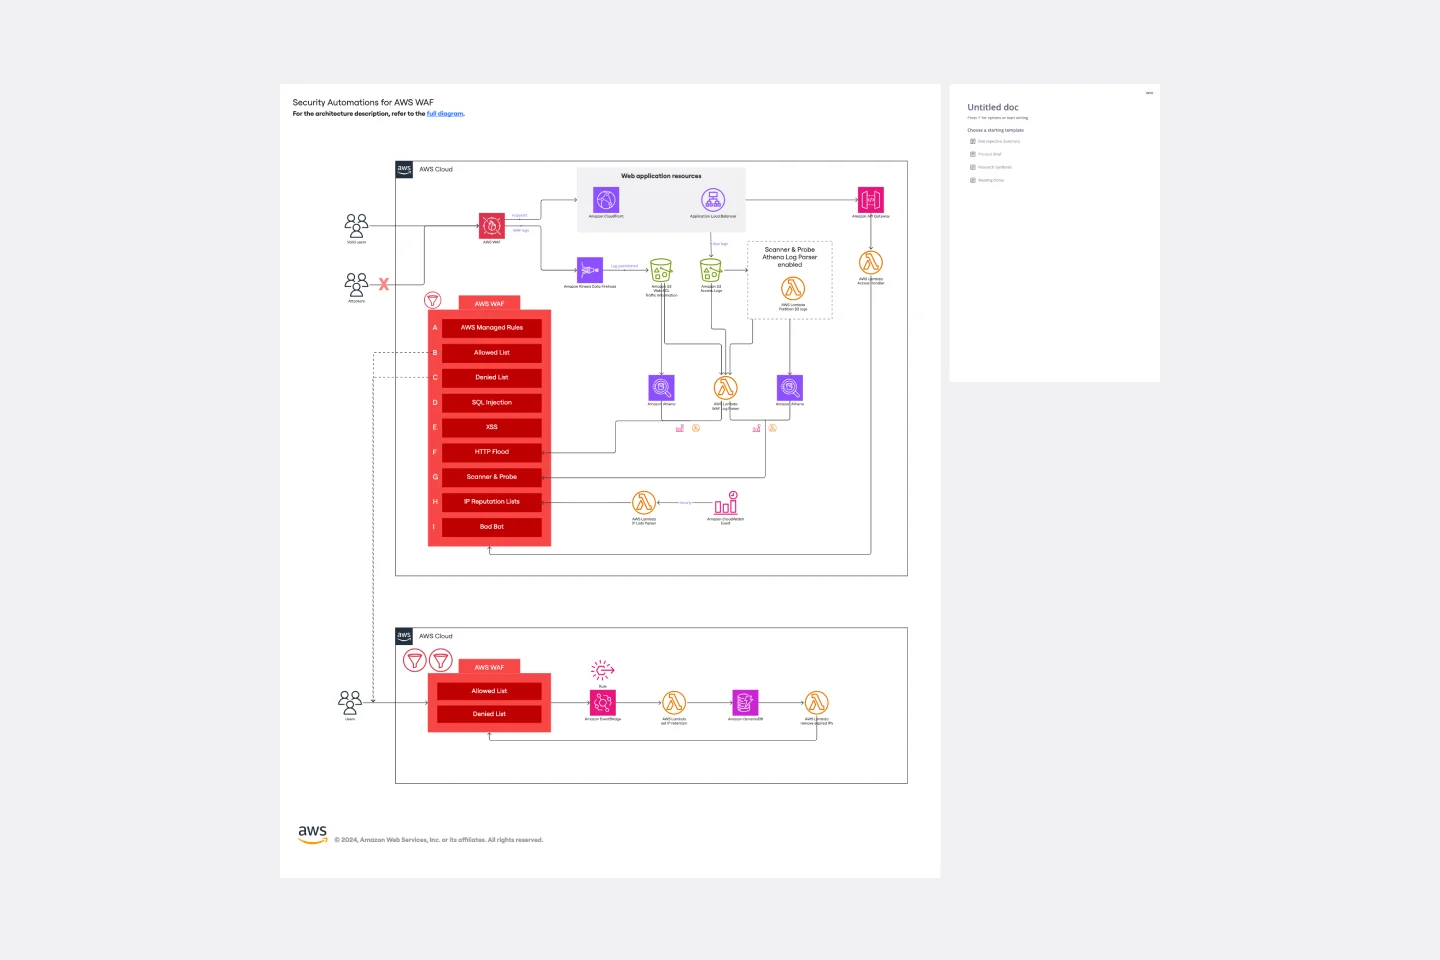
Security Automations for AWS WAF Template
The Security Automations for AWS WAF template is designed to streamline the process of enhancing the security of your AWS applications. It allows teams to collaboratively design, visualize, and refine AWS WAF configurations to protect against common web exploits effectively. This template includes various components such as automated deployment pipelines, instance schedulers, and serverless image handlers, providing a robust framework for managing AWS WAF security automations. By using this template, teams can improve collaboration, achieve a clear visual representation of their AWS WAF configurations, enhance efficiency in managing AWS WAF rules, and customize the template to meet specific application security needs.
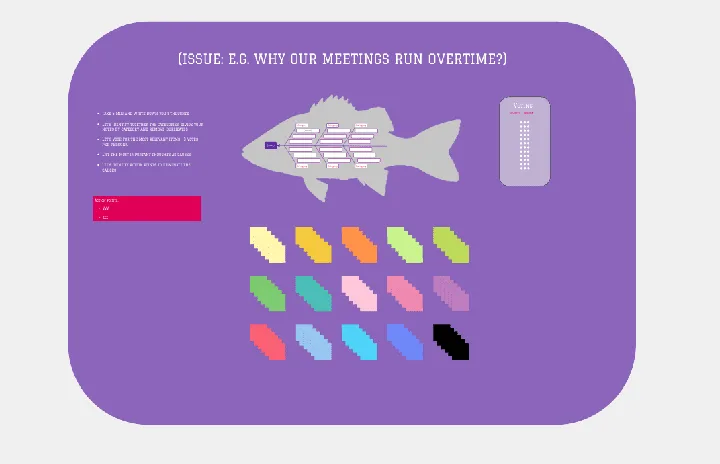
Fishbone Diagram by Hanna Havulinna
Works best for:
Diagramming
The Fishbone Diagram template, also known as the Ishikawa or Cause-and-Effect diagram, offers a visual tool for identifying and analyzing root causes of problems or issues. It provides a structured framework for categorizing potential causes into major categories such as people, process, environment, and equipment. This template enables teams to conduct root cause analysis systematically, facilitating problem-solving and decision-making. By promoting a structured approach to problem analysis, the Fishbone Diagram empowers teams to address issues effectively and implement corrective actions efficiently.
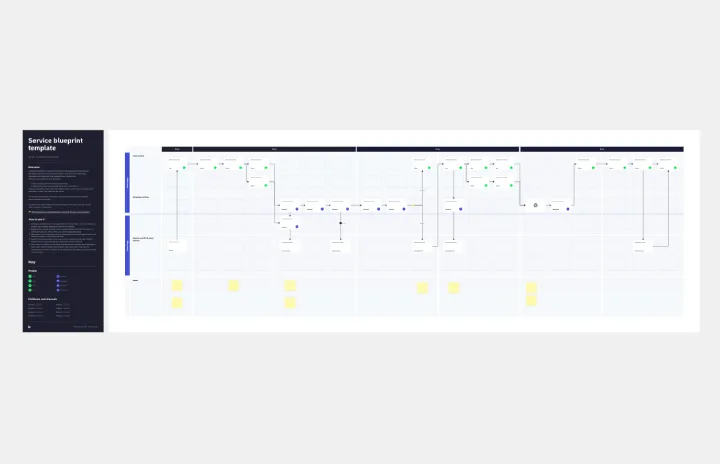
Service Blueprint by Hyperact
Works best for:
Research & Design
The Service Blueprint template is perfect for visualizing the orchestration of service components. It maps out frontstage and backstage elements, helping you analyze and enhance customer experiences. Use this template to align teams, identify pain points, and streamline processes, ensuring a seamless service delivery. It's ideal for creating a shared understanding of service dynamics among stakeholders and collaborators.