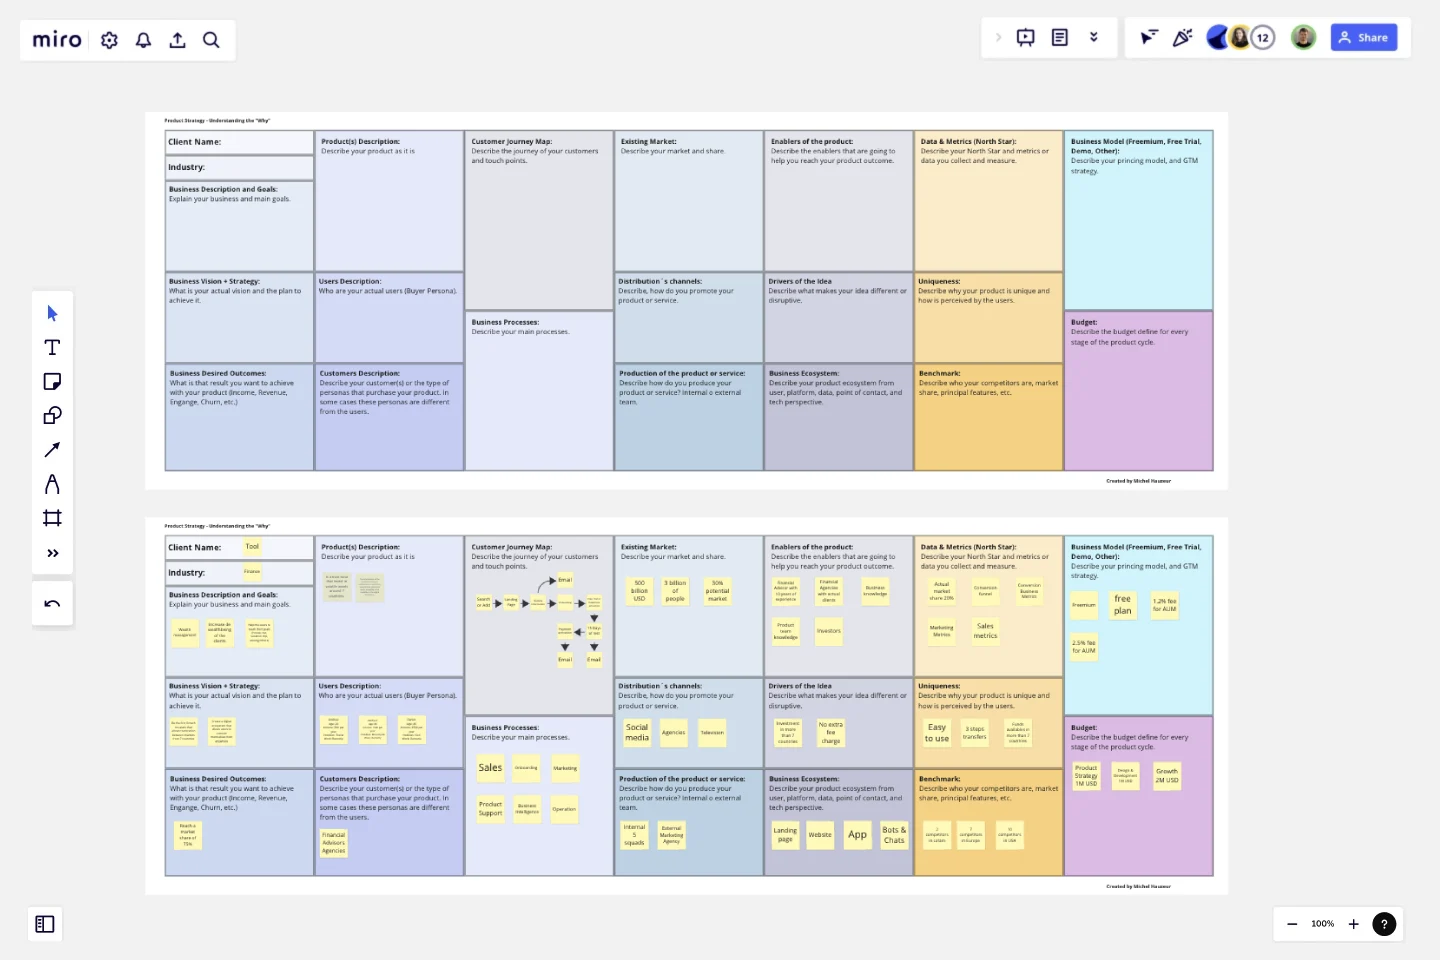
Product Strategy - Understand the "Why"
This template will help you to understand the product in a 360 0verview.
The focus of this tool is to recollect information about the business (goals, desires, and needs), users (customer journey, and user vs customer), data (north star and key metrics), technology (ecosystem, and production), and the product itself (enablers, uniqueness, and drivers).Once the information is collected, you can create a hypothesis to validate your product.
Instructions:
Start to fill the template from left to right and up-down.
The first column is about the business, so get a deeper understanding of how the business works, what are their goal, vision, strategy, and desired outcome.
The second column is about the product and its users. Remember that you can have Customers (who buy the tool) and Users (who are the people that are going to use the tool)
The third column is about the customer journey and process. Be very explicit about the touch points and processes that you are going to affect with your product.
The fourth column is about the Market, channels, and Production. Try to understand how the product is perceived in the market, how you are going to distribute it, and how you are going to produce it.
The fifth column is about Enablers, drivers, and Ecosystems. Think about the difference between your product against others and how your ecosystem is going to support this product,
The sixth column is about Data, uniqueness, and benchmark. What are the metrics you are measuring, what is the differentiator, and who are your competitors?
The seventh column is about your business model and budget. Understand what is the pricing model, structure, and GTM strategy. In addition, understand what is the budget available, in order to forecast your plan.
This templates was created by Michel Hauzeur.
Get started with this template right now.
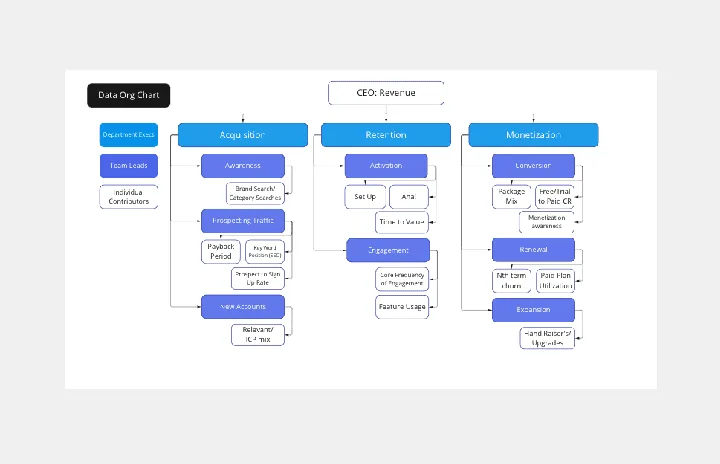
Data Org Chart
Works best for:
Org Charts, Operations, Mapping
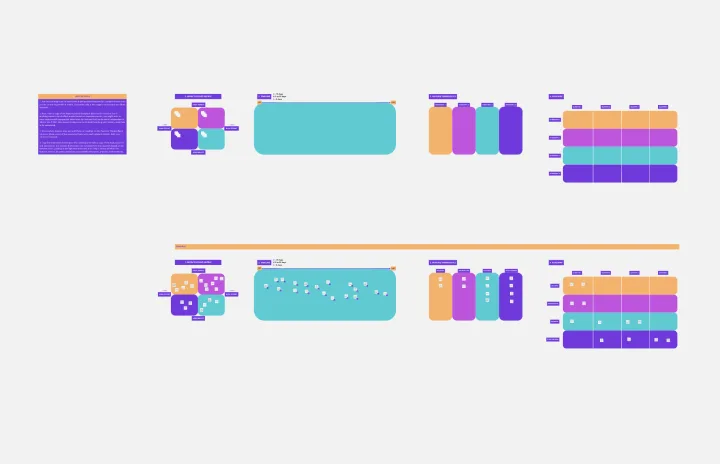
The Data Org Chart template provides a visual representation of data-related roles and relationships within an organization. By mapping out data management responsibilities and dependencies, teams can enhance data governance and improve collaboration. With features for customizing data roles and connections, this template empowers teams to optimize data processes and ensure data integrity and compliance.
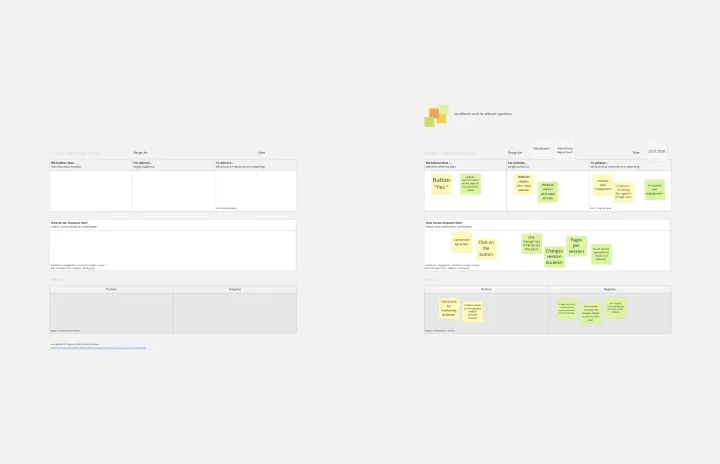
Product Hypothesis Canvas
Works best for:
Product Management, Planning
The Product Hypothesis Canvas template assists product teams in formulating and testing hypotheses effectively. By defining assumptions, success metrics, and validation experiments, this template guides teams through the hypothesis validation process. With sections for articulating problem statements, proposed solutions, and expected outcomes, it ensures that hypotheses are clear, testable, and aligned with strategic objectives. This template serves as a framework for hypothesis-driven product development, enabling teams to validate ideas and make data-informed decisions.
Research Topic Brainstorm Template
Works best for:
Desk Research, Brainstorming, Ideation
Coming up with a topic for a research project can be a daunting task. Use the Research Topic Brainstorm template to take a general idea and transform it into something concrete. With the Research Topic Brainstorm template, you can compile a list of general ideas that interest you and then break them into component parts. You can then turn those parts into questions that might be the focus for a research project.
Epic & Feature Roadmap Planning
Epic & Feature Roadmap Planning template facilitates the breakdown of large-scale initiatives into manageable features and tasks. It helps teams prioritize development efforts based on business impact and strategic objectives. By visualizing the relationship between epics and features, teams can effectively plan releases and ensure alignment with overall project goals and timelines.
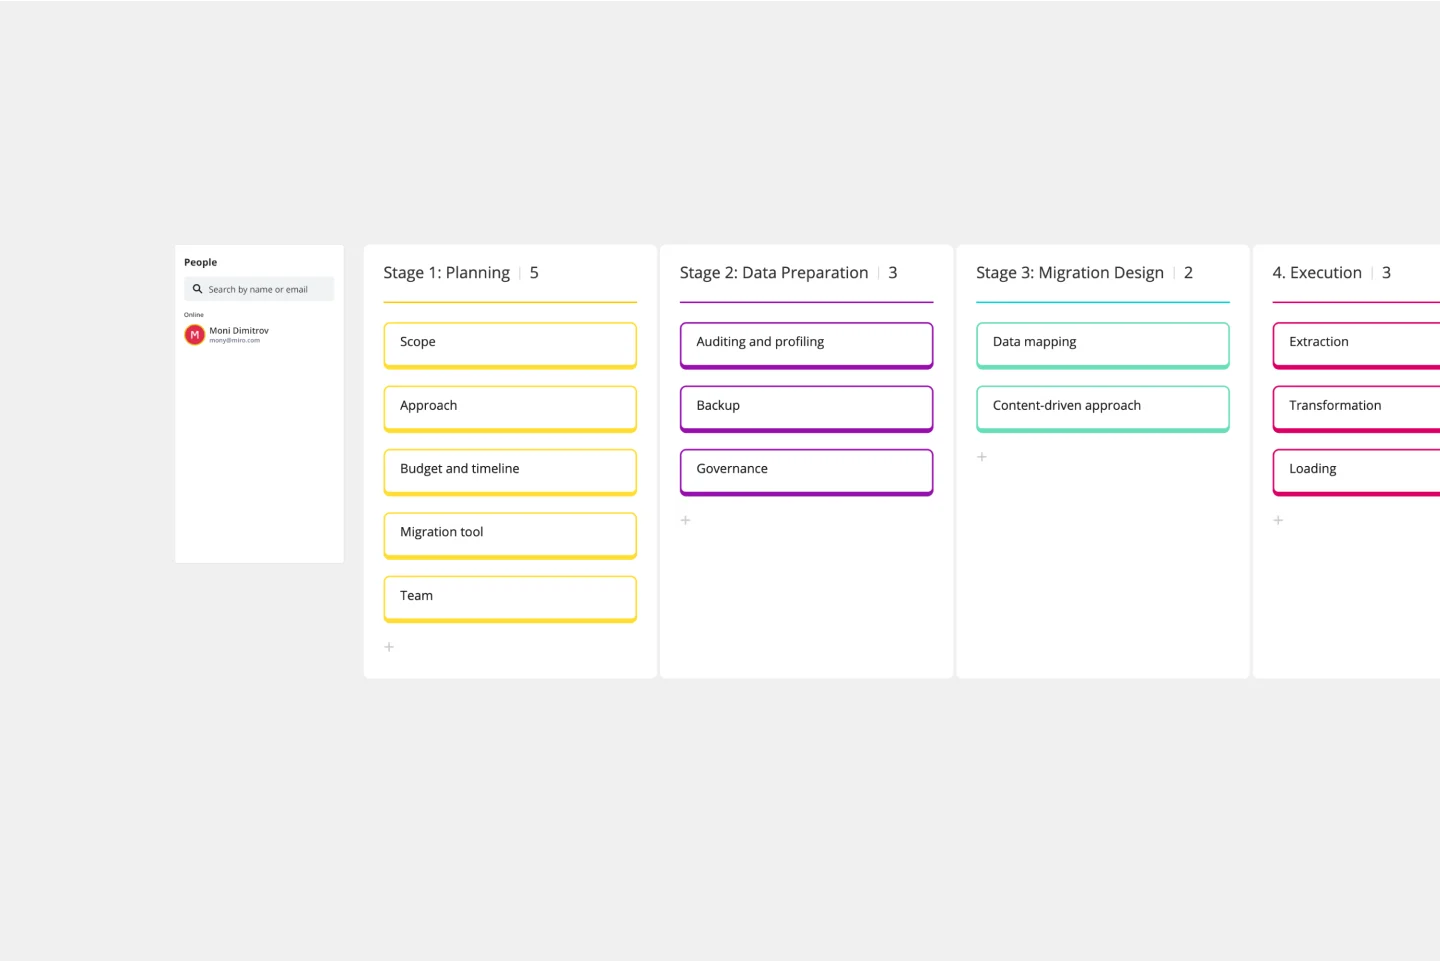
Data Migration Plan Template
Works best for:
Data Migration, Planning
The Data Migration Plan Template is a useful tool for any data migration project, providing a simple and flexible structure. The template outlines the various stages of data migration and can be customized to meet the specific needs of your project. This ensures that the plan remains relevant and effective regardless of the scale or complexity of the migration.
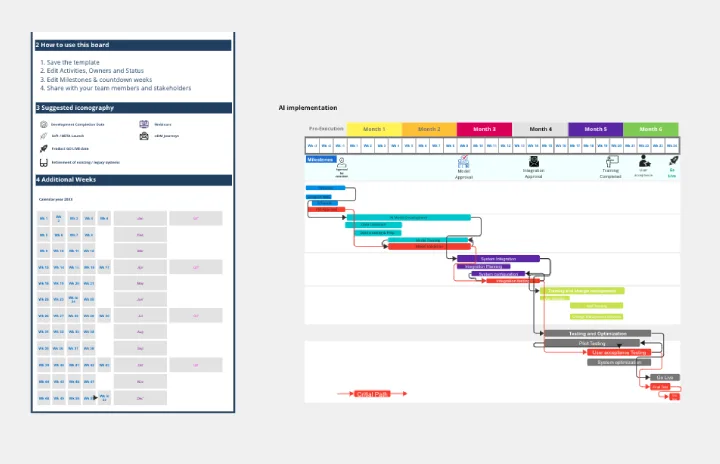
Gantt Chart for Project Scheduling
Works best for:
Planning, Strategy
Gantt Chart for Project Scheduling helps you plan and visualize project timelines. It enables you to manage tasks, deadlines, and dependencies, ensuring efficient project execution. Ideal for project managers looking to streamline their scheduling process.