Phylogenetic Tree Template
Organize complex data and make it more understandable to everyone with the phylogenetic tree template.
About the Phylogenetic Tree Template
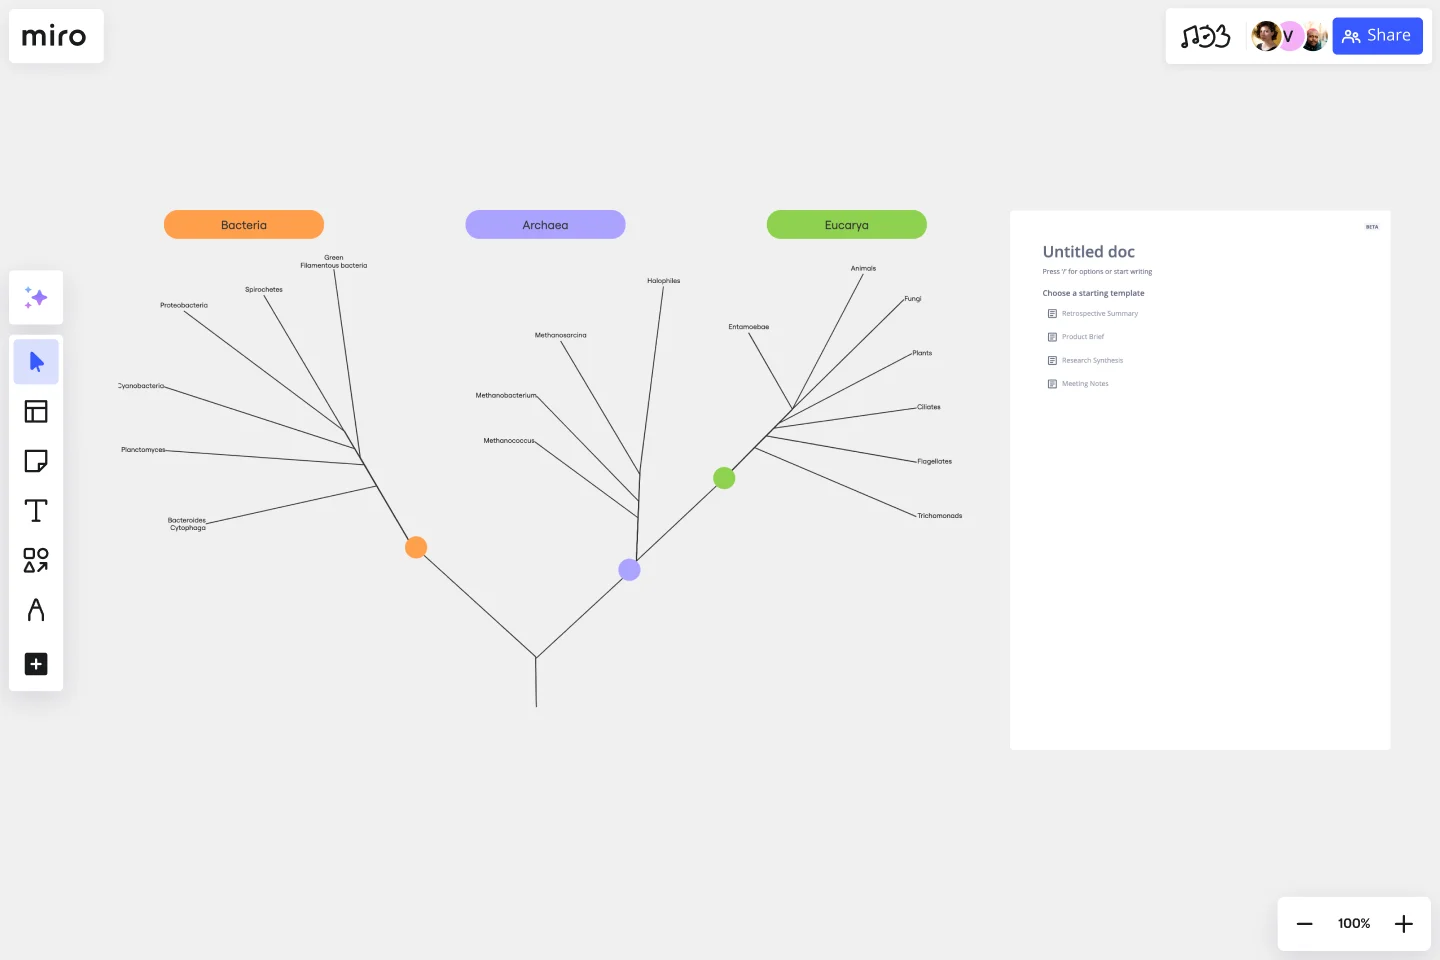
The phylogenetic tree template is an innovative tool for visualizing the evolutionary relationships between species. It is a visual representation of the history of the evolution of life on Earth, and it helps scientists and researchers to identify the relationships between different organisms and their ancestors. This template is a great way to organize complex data and make it more understandable to everyone.
In Miro, the phylogenetic tree template is designed to be simple and easy to use, consisting of different areas representing various aspects of organisms' evolutionary history. These areas include different branches, connector lines, and nodes.
How to use the phylogenetic tree template in Miro
Using the phylogenetic tree template in Miro is very easy. Here are the steps:
Start by adding your data to the template, anything from taxonomic names to DNA sequences.
Use the automated diagramming features to expand the template with more branches and connector lines.
Add any artifact to the Miro board to give more context to your data.
Why should you use the phylogenetic tree?
The phylogenetic tree template offers many benefits to researchers and scientists in biology. Here are some of its key advantages:
Visualizes complex data clearly and concisely, making it easier to comprehend.
It provides an efficient way to organize data and information, enabling easy access and analysis.
It helps identify the relationships between different organisms and their ancestors, leading to important discoveries and insights.
Useful for teaching and learning, providing a visual representation of complex topics and concepts.
Allows for collaboration between researchers and scientists, facilitating the sharing and analysis of data and leading to breakthroughs in the field of biology.
Overall, the phylogenetic tree template is a highly effective tool that has proven invaluable in studying evolutionary biology. Explore all features of Miro's phylogenetic tree maker and start diagramming right now.
Can I personalize the template according to my requirements?
Yes, the template is fully customizable, and you can easily change it with just a few clicks.
Can I expand the template with more branches and connector lines to accommodate my data?
Yes, you can increase the template size with automated diagramming features that allow you to add more branches and connector lines.
Can I add artifacts to the Miro board to provide more context?
Yes, you can add any artifacts to the Miro board to give more context to your data. Simply drag and drop files onto your board.
Get started with this template right now.
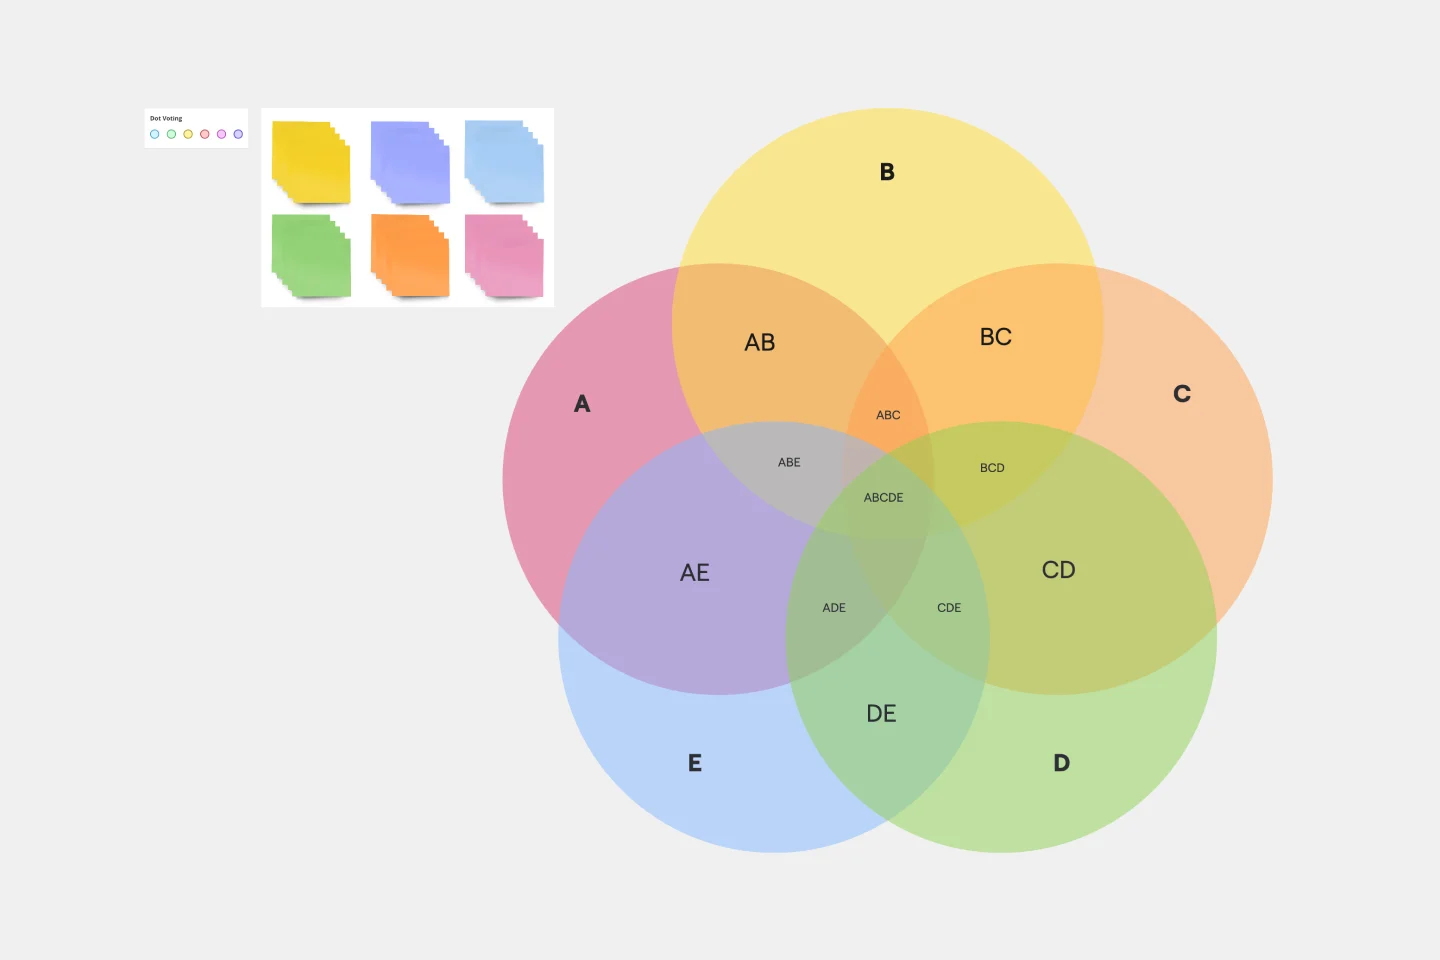
5-Circle Venn Diagram Template
Works best for:
Diagramming, Mapping, Brainstorming
Discover how Miro's 5 Circle Venn Diagram Template can simplify complex decision-making processes. Learn how to create, customize, and share your diagrams for effective visual collaboration. Transform brainstorming sessions with real time, remote teamwork.
Venn Diagrams by Dave Westgarth
Works best for:
Venn Diagram
Visualize relationships and intersections clearly with the Collection Venn Diagram template. This tool is perfect for comparing multiple sets of data, identifying commonalities, and showcasing unique elements. Use it in presentations, research, and data analysis to make complex information more digestible. Ideal for educators, researchers, and analysts seeking to present data insights effectively.
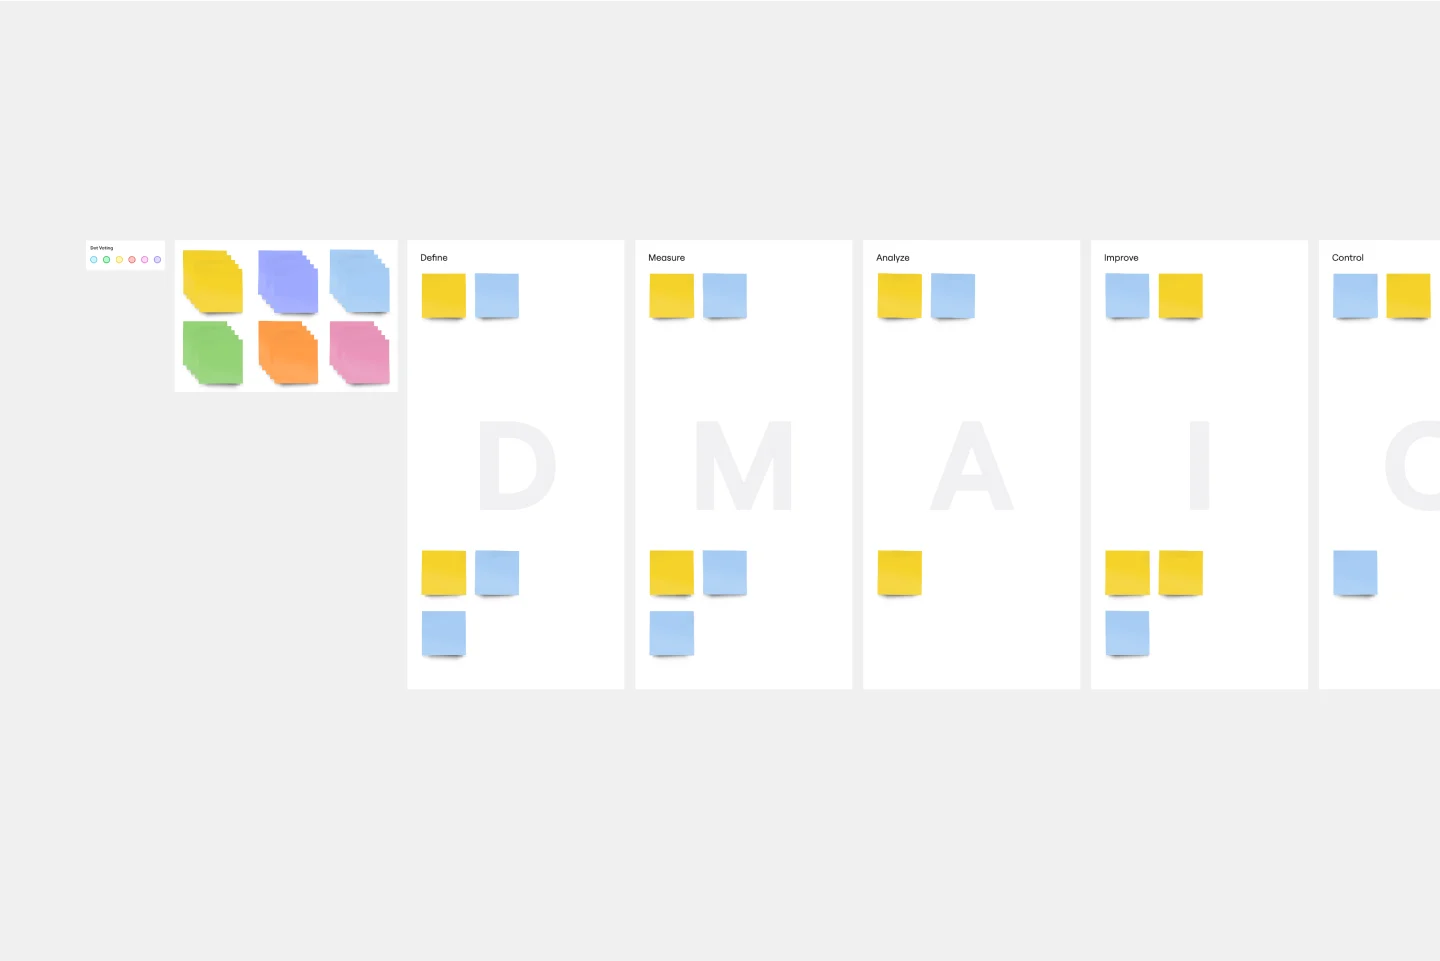
DMAIC Analysis Template
Works best for:
Agile Methodology, Design Thinking, Operations
Processes might not seem like the funnest thing to dive into and examine, but wow can it pay off—a more efficient process can lead to serious cost savings and a better product. That’s what DMAIC analysis does. Developed as part of the Six Sigma initiative, DMAIC is a data-driven quality strategy for streamlining processes and resolving issues. The technique is broken into five fundamental steps that are followed in order: Define, Measure, Analyze, Improve, and Control.
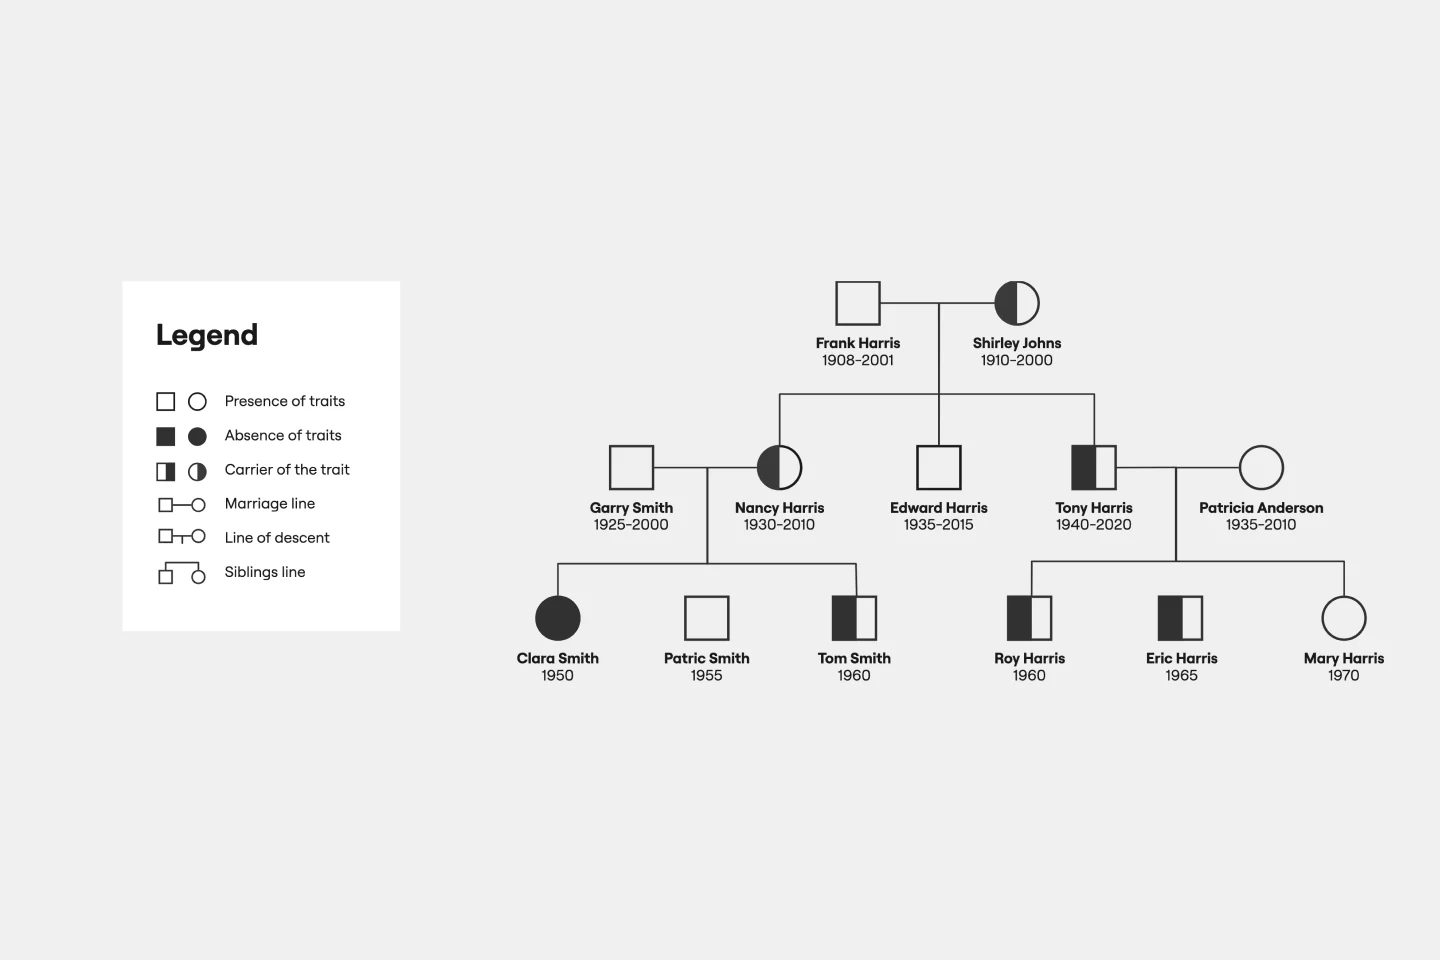
Pedigree Diagram Template
Works best for:
Education
Use our Pedigree Diagram Template to show how traits and diseases are passed from one generation to the next. Whether you’re a doctor, farmer, or just someone interested in genetics, a Pedigree Diagram can help you identify hereditary traits.
AWS Cloud Infrastructure Optimization Template
Works best for:
AWS , Diagramming
The AWS Cloud Infrastructure Optimization Template is part of Miro's Intelligent Templates collection, designed to streamline and enhance the management of your AWS cloud resources. This template leverages Miro's advanced diagramming tools and integrates seamlessly with AWS to provide real-time data visualization, cost analysis, and performance optimization. One key benefit of using this template is its ability to auto-generate detailed diagrams of your current AWS setup, providing a clear visual representation of your architecture. This feature saves time and reduces the manual effort required to visualize and optimize your AWS infrastructure, making it easier to manage and scale your cloud resources effectively.