PERT Chart Template
Track project timelines, tasks, and dependencies at a single glance using a PERT chart template.
About the PERT Chart Template
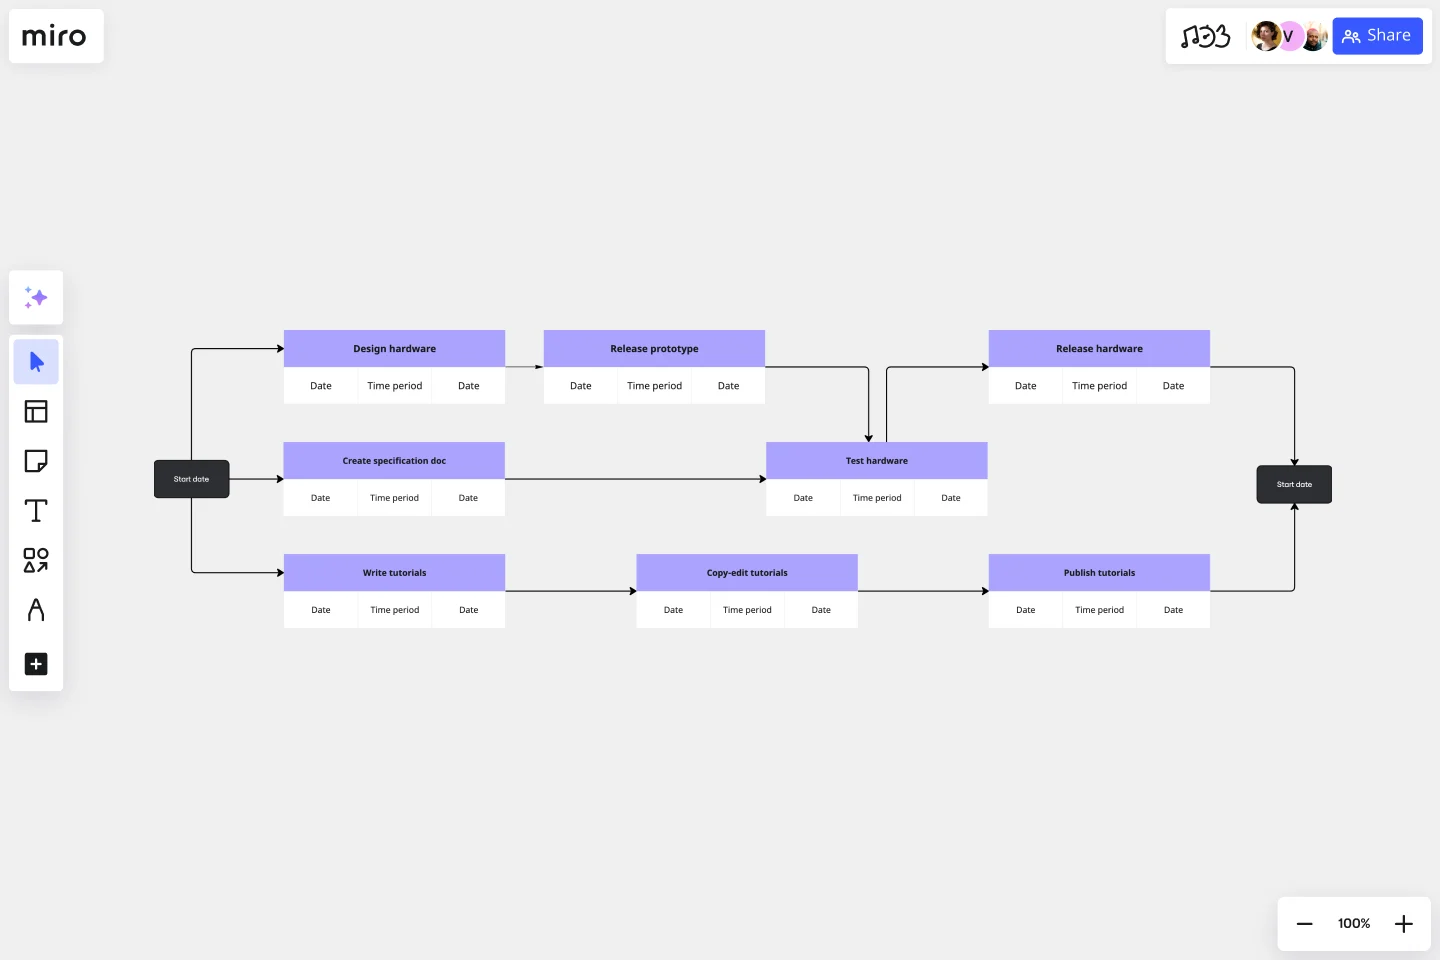
Miro’s PERT chart template is a project management tool that allows you to create a visual roadmap for your project. Designed to let you see interdependencies and to help you identify possible bottlenecks, this template consists of nodes and vectors that are easy to fill out and customize.
We’ll walk you through how to make the most of the PERT chart template.
How to use the PERT chart template
To get started, click on the blue “use template” button to open the PERT chart template in Miro. Once you’re in, follow the steps below to start filling it out.
1. Identify project tasks
Break your project down into tasks. Then, label the blue headers along the nodes with the task names. Double-click on the pre-written text to replace it with your own. Below the blue headers, add each task's expected start and end dates and the estimated durations by double-clicking on the text boxes.
2. List task dependencies
Are there any tasks you can’t start until another one’s been completed first? That means you have dependencies. Use the arrows in the PERT chart template to connect dependent tasks, and make sure the direction represents the order you need to complete them.
4. Label dependencies
Add more detail to clarify the nature of each dependency by labeling the arrows with one of the following:
Finish-to-Start (FS): You can’t start a task until you’ve completed the preceding task.
Start-to-Start (SS): You can start a task as soon as you’ve started its preceding task.
Finish-to-Finish (FF): You can’t finish a task until you’ve completed the preceding task.
Start-to-Finish (SF): You can’t finish a task until you’ve started the preceding task.
Grab text boxes from the toolbar and place them along the arrows to add your labels.
6. Identify a critical path
Use the estimated durations to calculate the critical path. Then, use colors to outline nodes or arrows to visualize it.
7. Share your diagram
Once you’ve filled in the PERT chart template, you can share it with your team and key stakeholders for feedback and easily make changes to your Miro board anytime.
Benefits of using Miro’s PERT chart template
Miro’s PERT chart template makes it especially easy to manage projects that involve multiple team members and stakeholders. With advanced collaboration features at your fingertips, you can easily build a PERT chart together online in real-time or invite others to view and comment on your Miro board when you’re ready — making it an ideal solution for remote and hybrid teams.
The PERT chart template is also fully customizable, allowing you to take advantage of Miro’s extensive editing features — from resizing nodes and text to changing up colors and line thickness.
Is Miro’s PERT chart template free?
Yes, all our templates are free and ready to use. Simply click on the blue “Use template” button to get started.
Can I share the PERT chart template with others outside my team?
Yes, there are several ways to share the PERT chart template. Export your Miro board as a PDF or image to attach it as a file to a message. Alternatively, you can embed your Miro board on other sites or generate a shareable link to send to others.
What is the critical path in a PERT chart?
A critical path shows the longest path of essential tasks you must complete to finish a project. For example, you can't move on to do the upholstery and interior if you haven't finished putting up the walls and roof. When one of these tasks is late, it impacts the entire project. To make up for missed deadlines on critical tasks, reallocate resources and staff from the low-impact tasks.
Get started with this template right now.
Go-to-Market GTM Template | Miro
Works best for:
Marketing, Desk Research, Strategic Planning
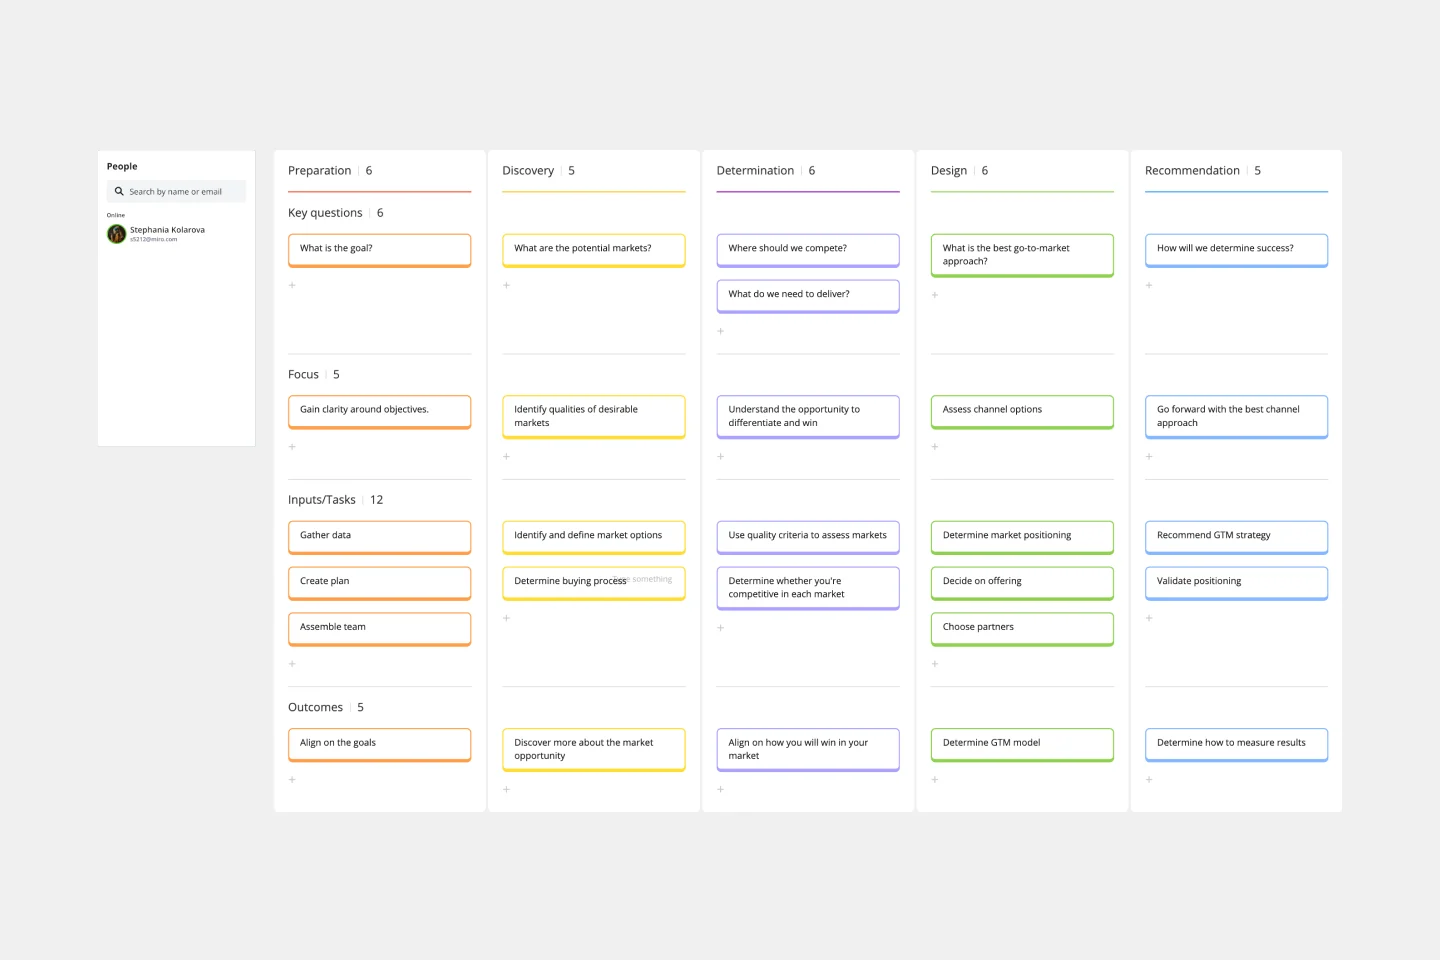
It doesn’t matter how innovative or effective a new product is — if it doesn’t get noticed and adopted by the right audience, the product won’t get off the ground. That’s where your Go-to-Market Strategy comes in. It’s a single resource that houses all of your research, insights, and data, and includes your business plan, target audience, marketing approach, and sales strategy. A GTM is especially important for any startups who grow fast, have to make split-second decisions, and have to be fully in sync.

Causal Loop Diagrams (1.0)
Works best for:
Diagramming
The Causal Loop Diagrams (1.0) template offers a visual tool for modeling complex systems and understanding the feedback loops that drive behavior. It provides a structured framework for identifying causal relationships, reinforcing loops, and balancing feedback within a system. This template enables teams to analyze system dynamics, anticipate unintended consequences, and formulate effective strategies for intervention. By promoting systems thinking and understanding of interdependencies, Causal Loop Diagrams empower organizations to navigate complexity and drive sustainable change.
UML Sequence Rental Booking System Template
Works best for:
UML
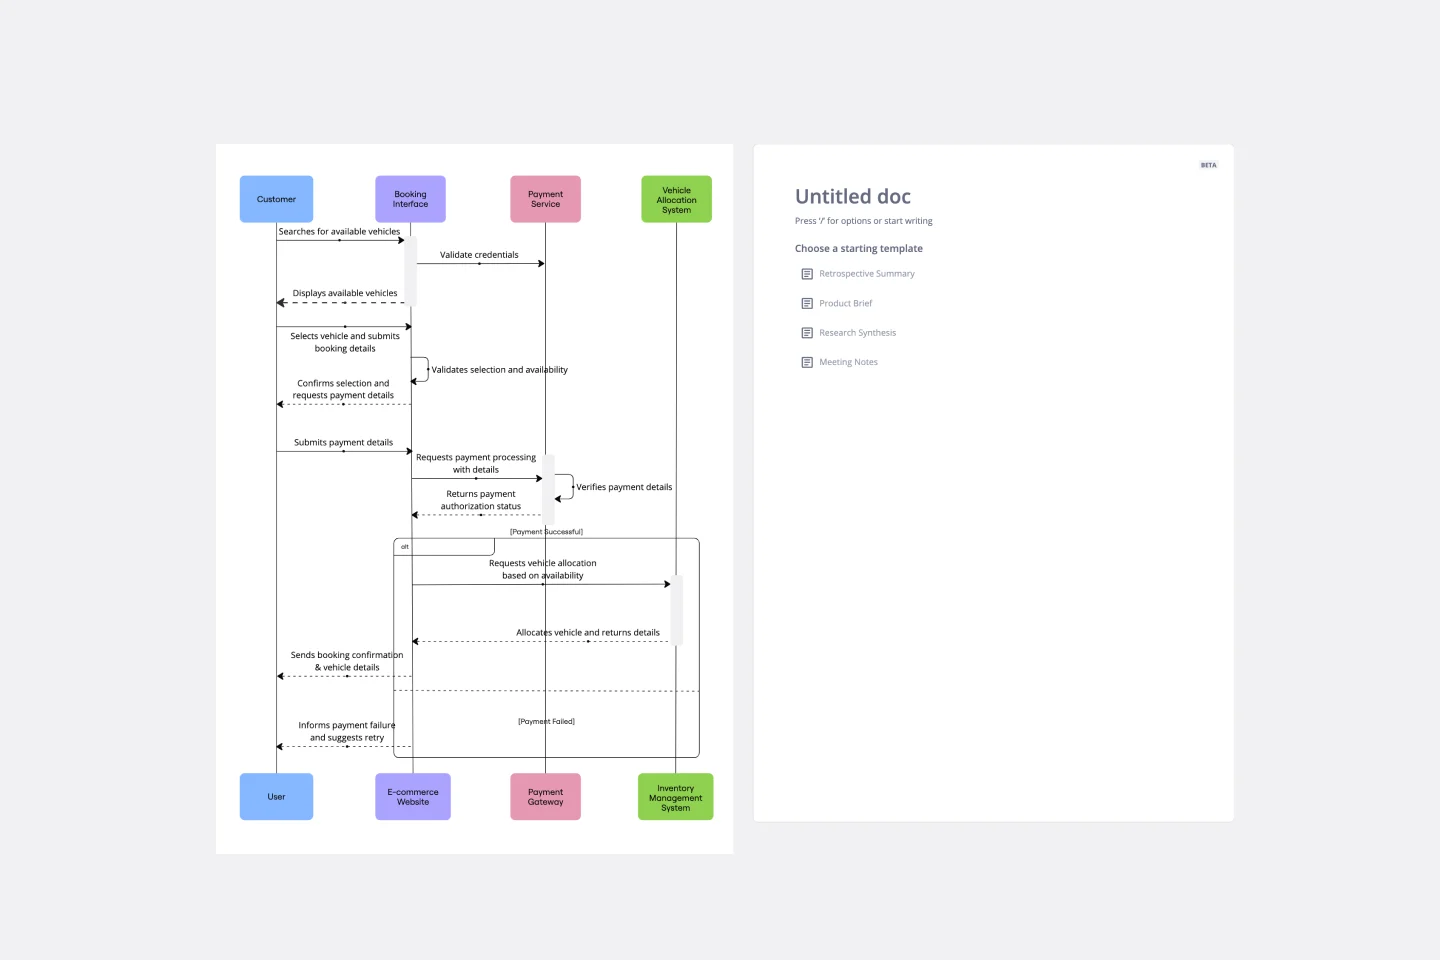
The UML Sequence Rental Booking System Template streamlines the process of documenting and visualizing the interactions within a car rental booking system. This template maps out the communication flow between the customer, user interface, payment service, and vehicle allocation system, ensuring a smooth and efficient workflow. By providing a clear visual representation of these interactions, the template helps in improving understanding among team members and stakeholders, promoting efficient design and collaboration.
RAID Log Template
Works best for:
Agile Methodology, Project Management, Agile Workflows
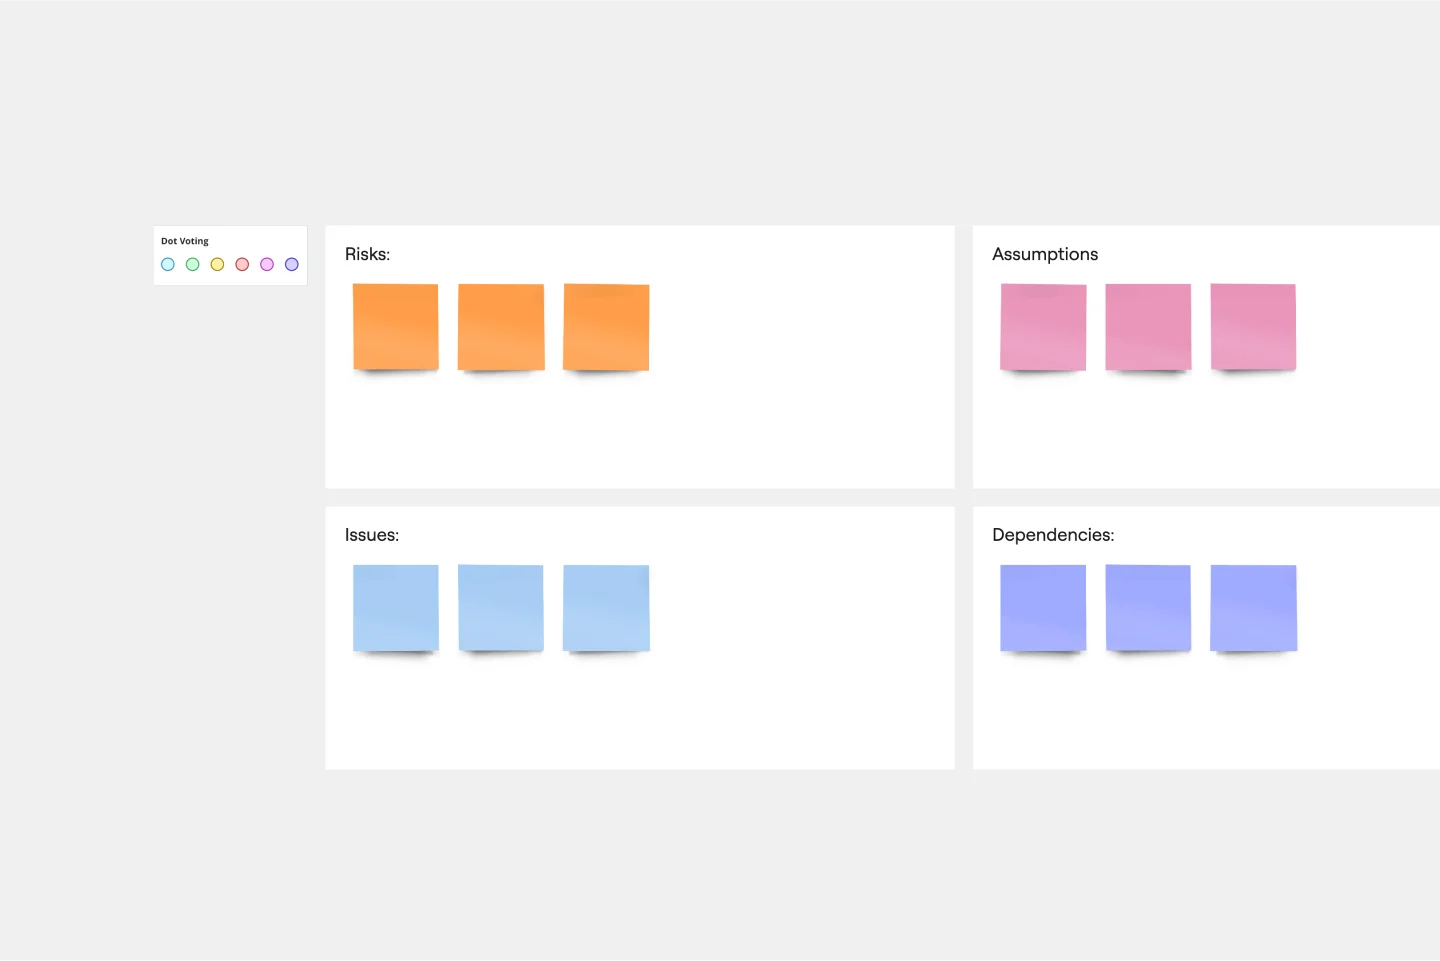
Use the RAID Log template to better understand potential risks, assumptions, issues, and dependencies relating to an upcoming project. With this information, you can make effective contingency plans and prepare your resources accordingly. You’ll know what could go wrong throughout the project and how to fix the problem.
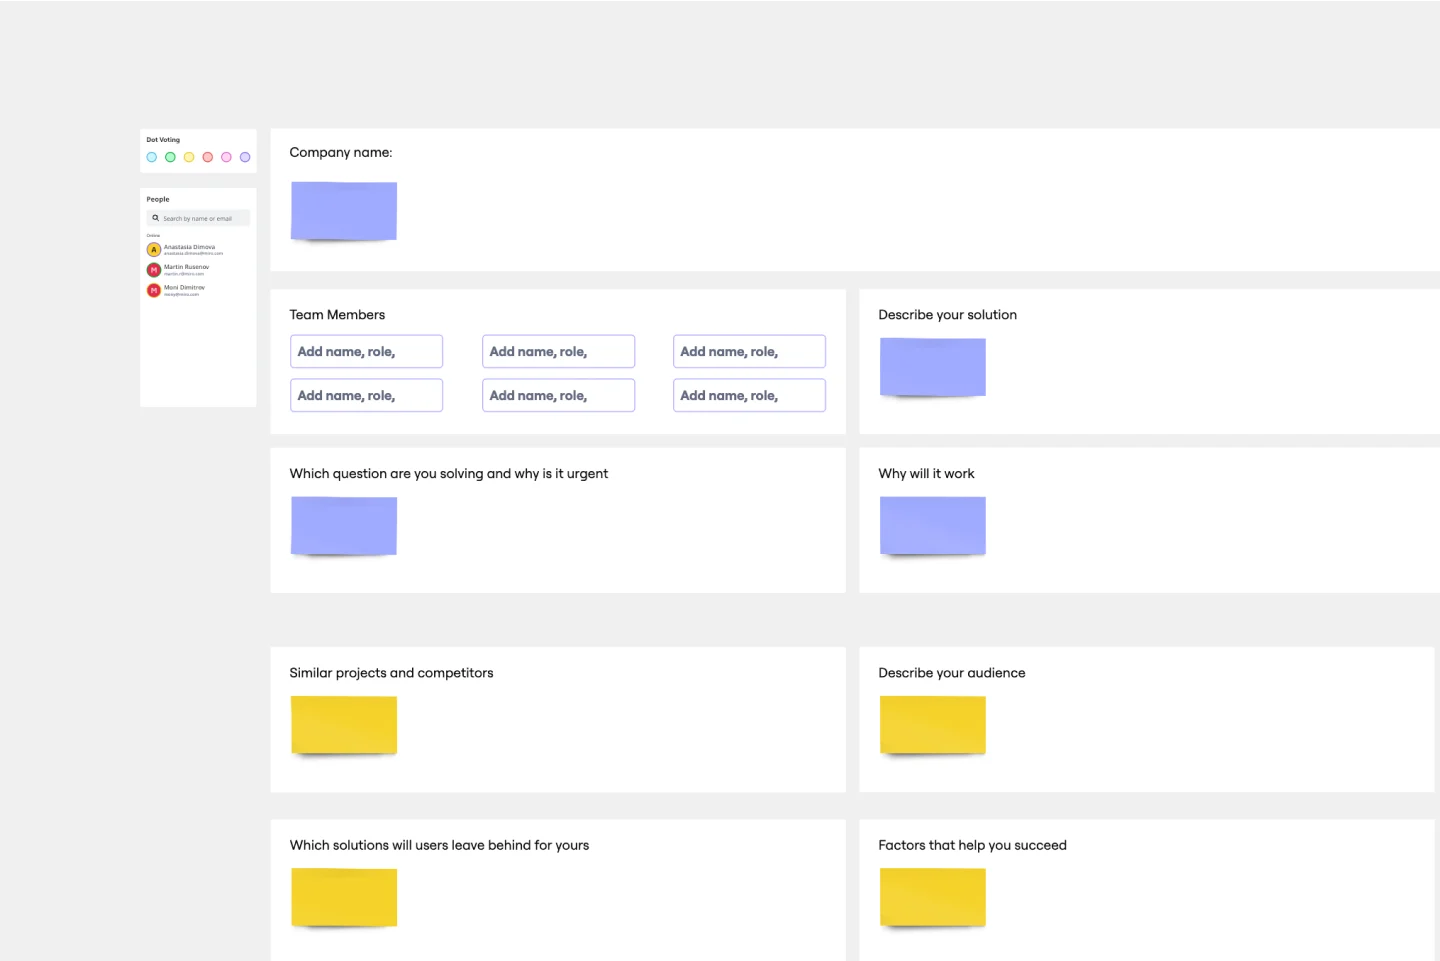
Startup Canvas Template
Works best for:
Leadership, Documentation, Strategic Planning
A Startup Canvas helps founders express and map out a new business idea in a less formal format than a traditional business plan. Startup Canvases are a useful visual map for founders who want to judge their new business idea’s strengths and weaknesses. This Canvas can be used as a framework to quickly articulate your business idea’s value proposition, problem, solution, market, team, marketing channels, customer segment, external risks, and Key Performance Indicators. By articulating factors like success, viability, vision, and value to the customer, founders can make a concise case for why a new product or service should exist and get funded.
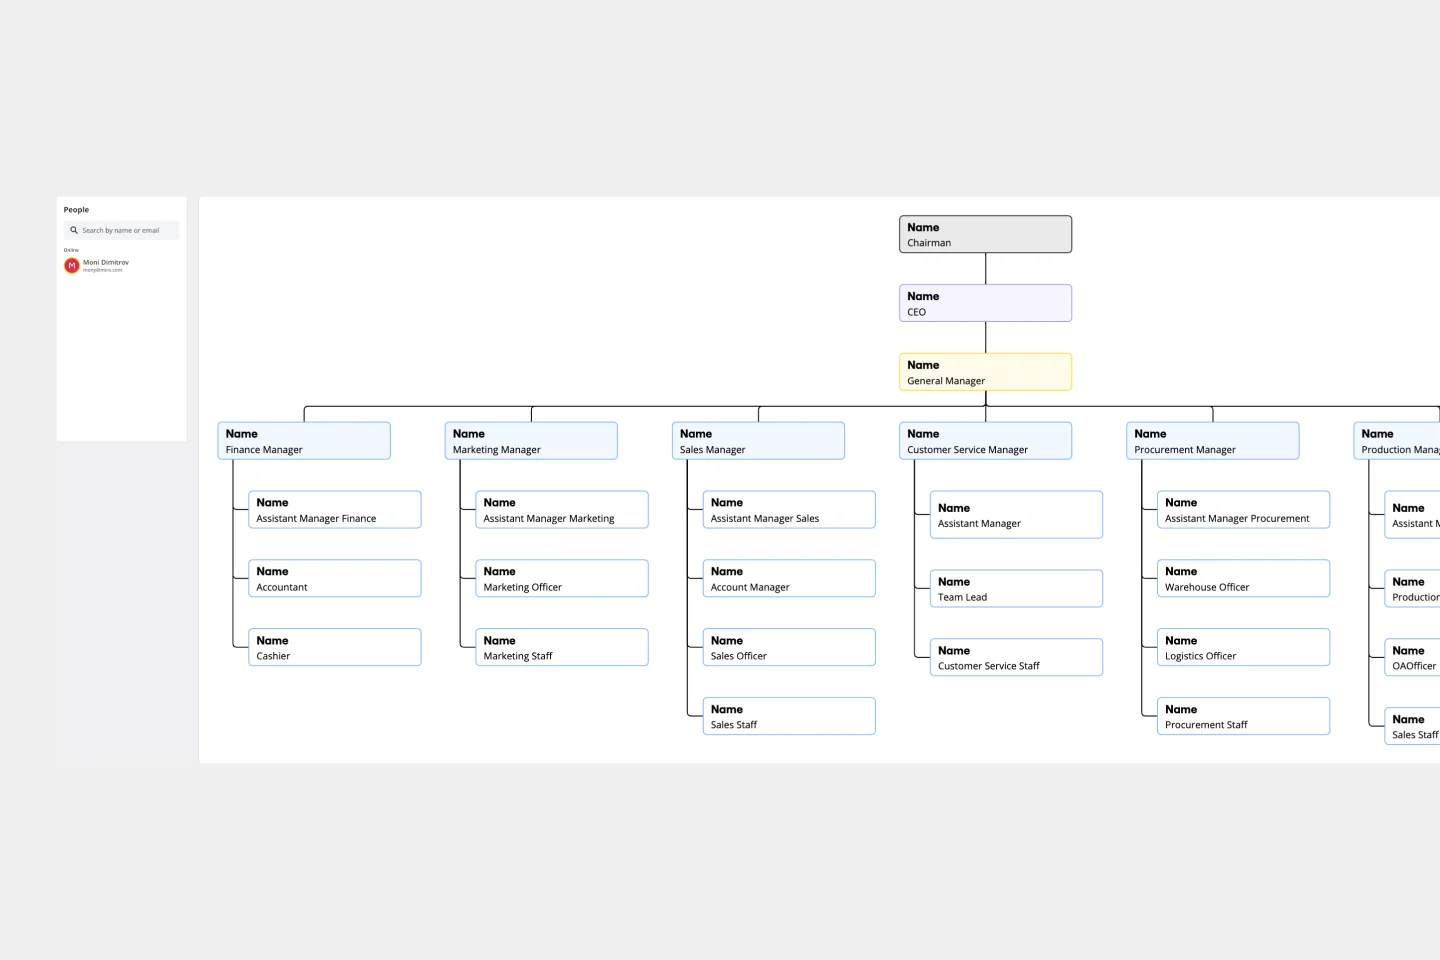
Vertical Organizational Chart
Works best for:
Organizational Charts, Organizational Design
The Vertical Organizational Chart Template is an efficient way to illustrate the hierarchy of an entity in a top-down format. This tool helps represent roles and relationships in a clear manner, starting from the topmost authority and branching downwards. It allows for a better understanding of the flow of responsibilities and communication channels within the organization. One of its most significant advantages is promoting clear communication. Depicting the organization's structure helps avoid misunderstandings and ensures everyone is on the same page regarding the chain of command.