OODA Loop Template
Break down decisions systematically with the OODA Loop template.
About the OODA Loop Template
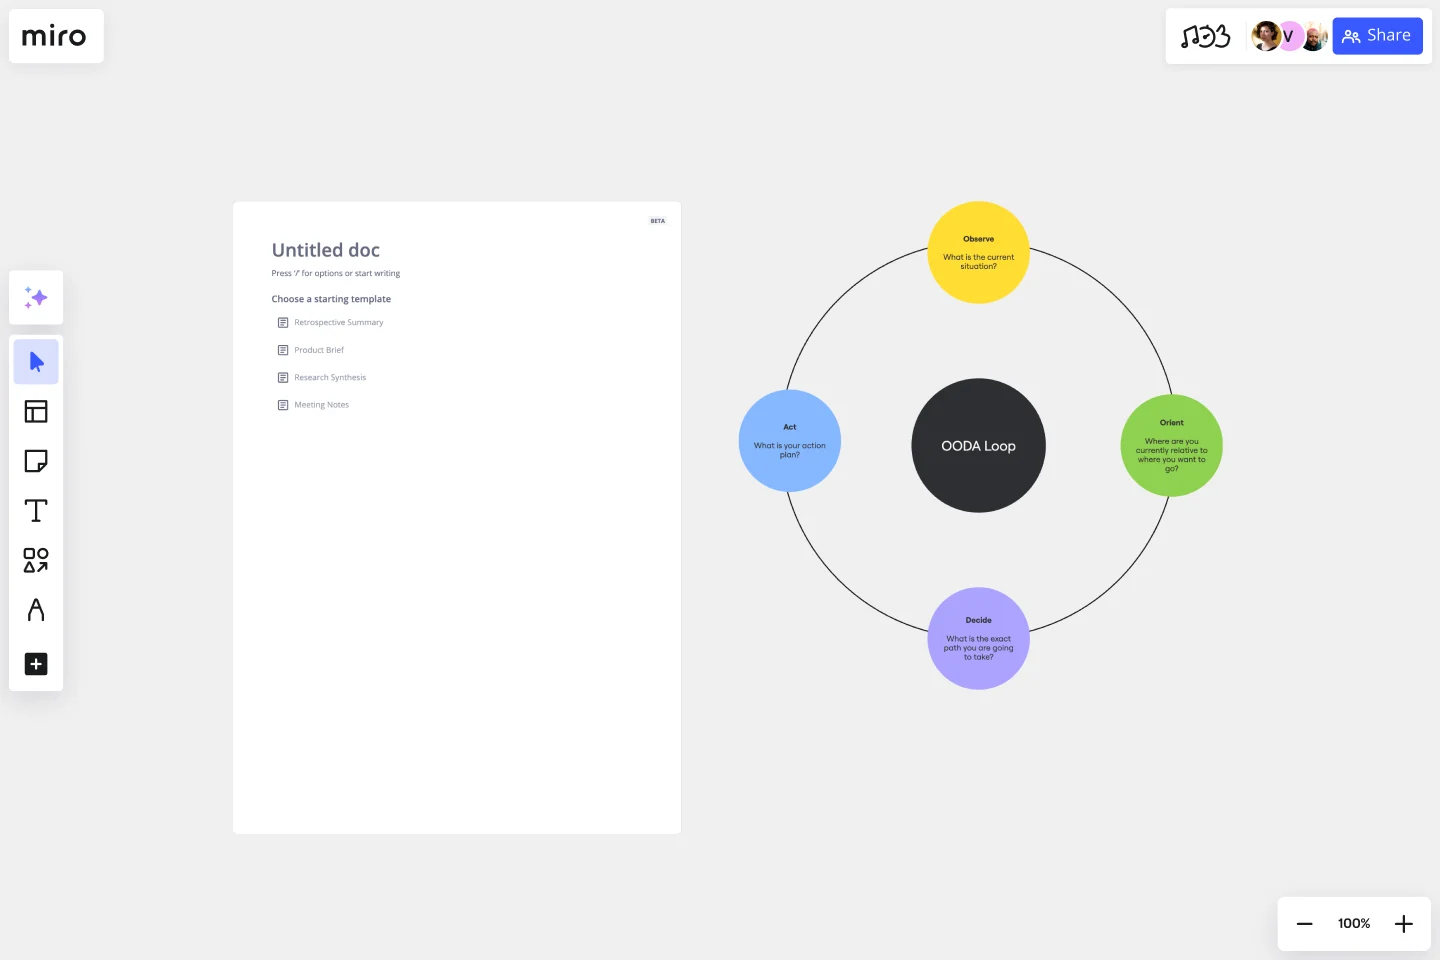
The OODA Loop template is a powerful tool to improve decision-making processes. It is inspired by the OODA Loop, a concept developed by military strategist Colonel John Boyd. The OODA Loop involves four steps that form a continuous cycle essential for quick and effective decision-making: Observe, Orient, Decide, and Act.
Let's take a closer look at each area:
Observe: Begin by gathering information and staying aware of your surroundings. This template section allows you to list key observations or data points.
Orient: Understand the context and analyze the information. In this area, you can outline the factors influencing your decision, including challenges, opportunities, and potential risks.
Decide: Make a well-informed decision based on your observations and orientation. The template provides space to document your chosen course of action and the rationale behind it.
Act: Execute your decision and implement the plan. This section helps you outline the steps to take and track progress.
How to use the OODA Loop template in Miro?
Edit with ease: Customize the template by clicking on any element to add text, shapes, or images that provide additional context.
Collaborate effortlessly: Invite team members to your board and collaborate in real time, ensuring everyone is on the same page throughout the decision-making process.
Why should you use an OODA Loop template?
Enhanced clarity: Visualizing the OODA Loop brings clarity to complex decision-making processes, making it easier to understand and communicate.
Faster decision-making: The structured approach of the OODA Loop template facilitates quicker decision-making by breaking down the process into manageable steps.
Improved collaboration: Collaborate seamlessly with team members using a shared visual representation of the decision-making cycle.
Strategic planning: The template aids in strategic planning by helping teams analyze and respond rapidly to changing situations.
Continuous improvement: Regularly revisiting and updating the OODA Loop Diagram fosters a culture of continuous improvement, ensuring your decision-making processes evolve with your team's needs.
Can I use the OODA Loop template for personal decision-making?
Absolutely! The template is versatile and can be adapted for personal decision-making, strategic planning, or any scenario where a systematic approach is beneficial.
How detailed should my observations be in the "Observe" section?
Provide enough detail to capture relevant information but focus on key observations to keep the process efficient. Adjust the level of detail based on the complexity of the decision.
Is the OODA Loop template suitable for small and large teams?
Yes, the template is scalable and can be effectively used by teams of any size. It promotes collaboration and aligns teams towards a shared decision-making process.
Can I export the OODA Loop Diagram to other formats for presentations or documentation?
Miro allows you to export your boards in various formats, making incorporating your OODA Loop into presentations, reports, or documentation easy.
Get started with this template right now.
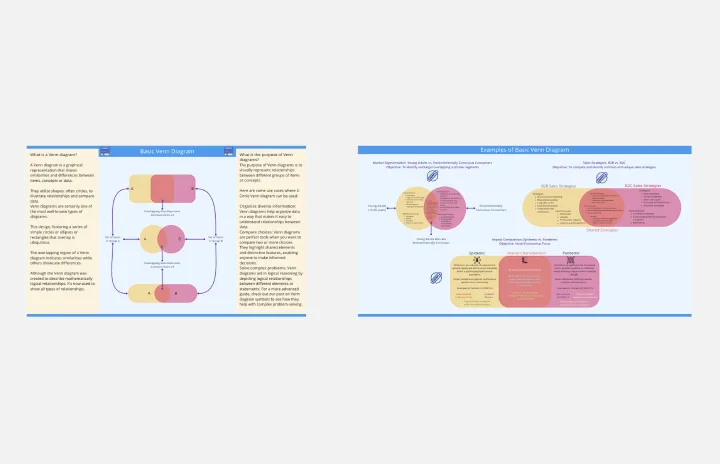
Basic Venn Diagram
Works best for:
Venn Diagram
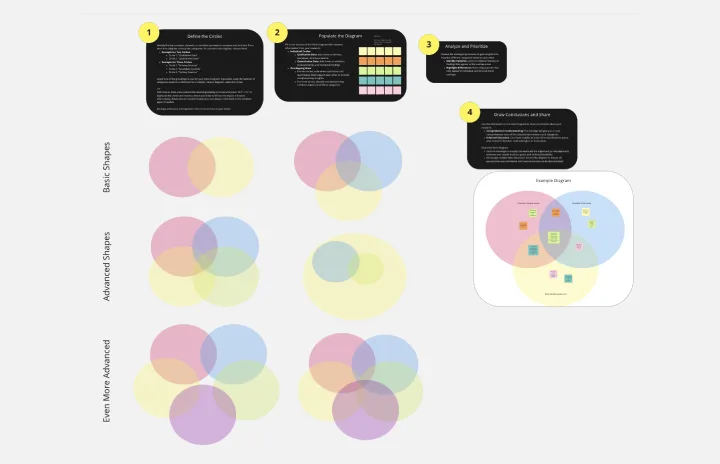
The Basic Venn Diagram template is a simple yet powerful tool for visualizing relationships between different sets. Use it to compare and contrast concepts, identify commonalities and differences, and organize information logically. This template is perfect for brainstorming, teaching, and presentations, making complex information more accessible and understandable. Ideal for educators, students, and professionals in various fields.
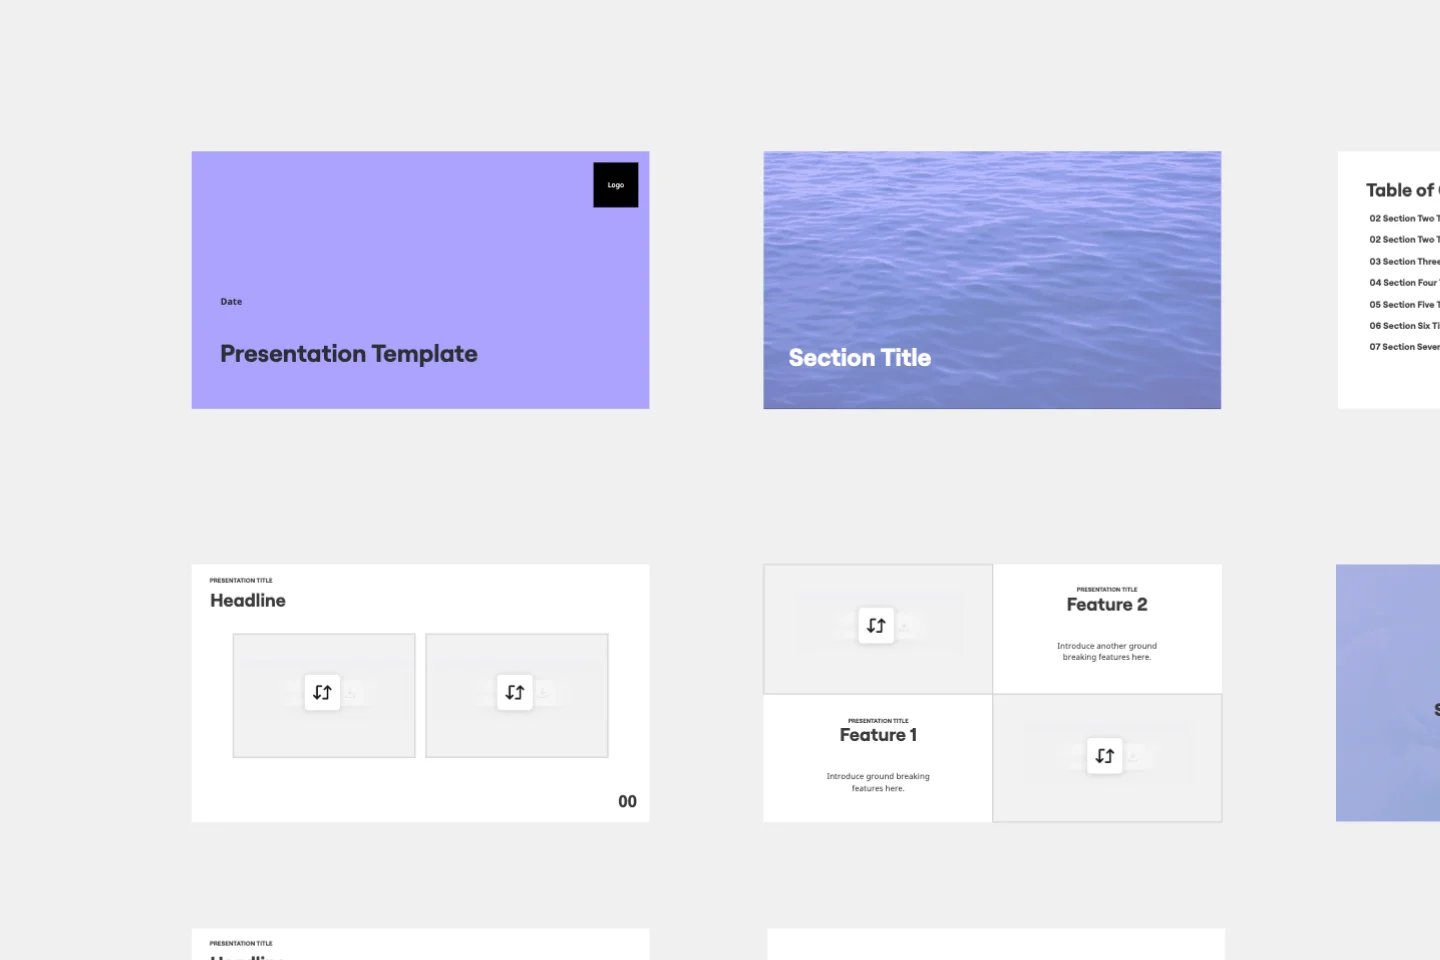
Presentation Template
Works best for:
Presentations, Education
At some point during your career, you’ll probably have to give a presentation. Presentations typically involve speaking alongside an accompanying slide deck that contains visuals, texts, and graphics to illustrate your topic. Take the stress out of presentation planning by using this presentation template to easily create effective, visually appealing slides. The presentation template can take the pressure off by helping your audience stay focused and engaged. Using simple tools, customize a slide deck, share slides with your team, get feedback, and collaborate.
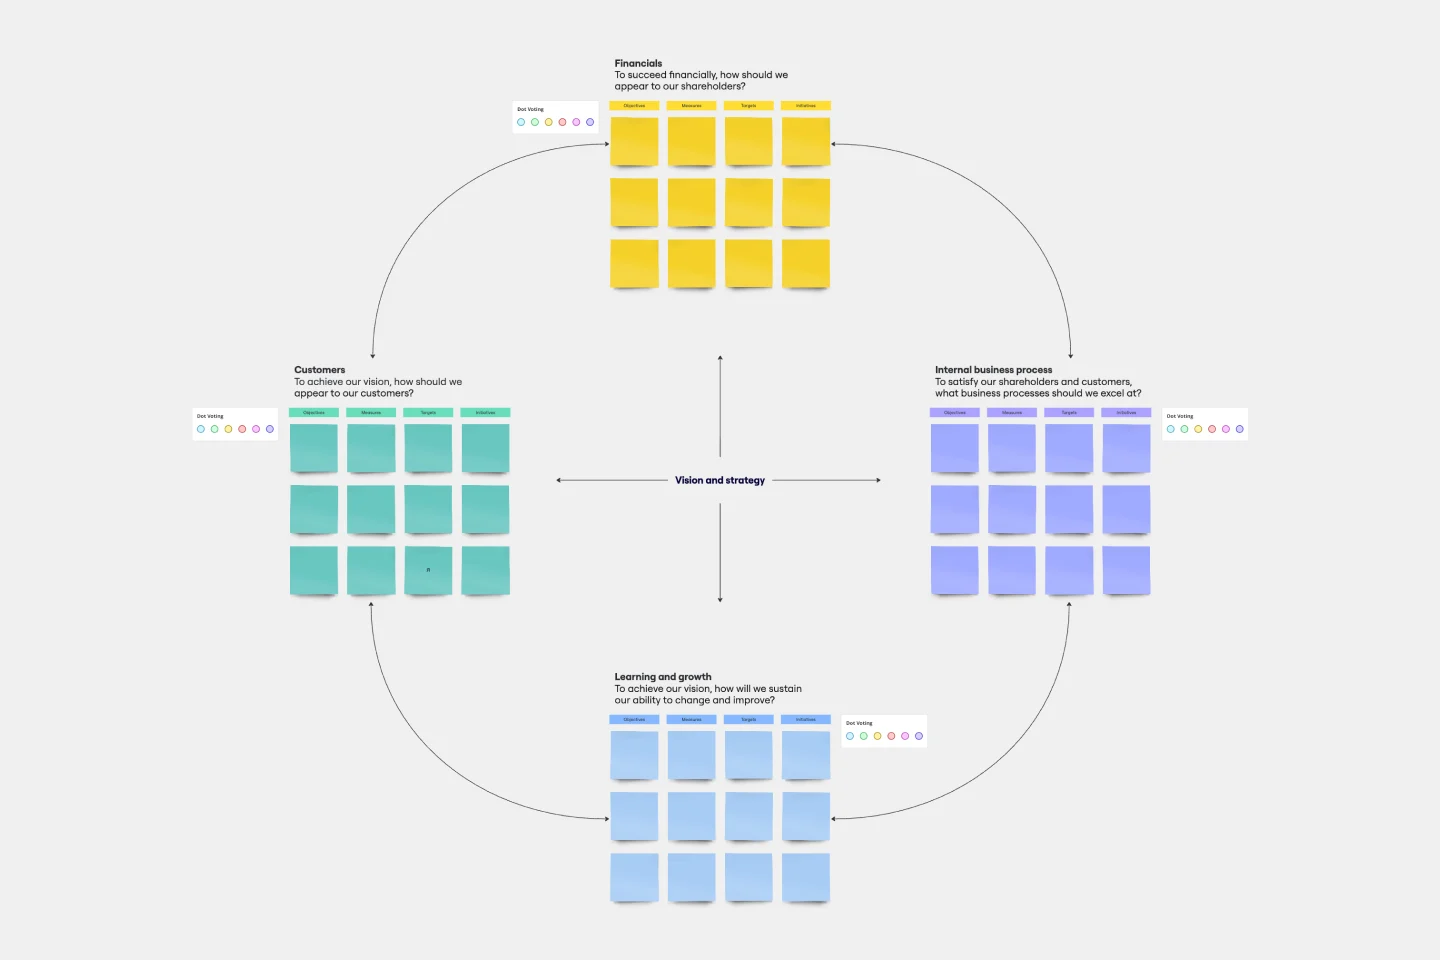
Balanced Scorecard Template
Works best for:
Operations, Strategic Planning, Project Planning
Balanced scorecards are useful tools for understanding business performance at a glance with regard to customers, employees, business processes, and financial progress. Learn more about BSCs and create your own using Miro’s Balanced Scorecard template.
Venn Diagram for Research
Works best for:
Venn Diagram
The Venn Diagram for Research template is a powerful tool for analyzing relationships and intersections in research data. Use it to compare different variables, identify overlaps, and draw insights from complex datasets. This template is ideal for researchers, analysts, and academics looking to visualize their findings and communicate results effectively. It's perfect for scientific studies, market research, and any field that requires detailed data comparison.
Timeline Design
Works best for:
Timeline, Planning
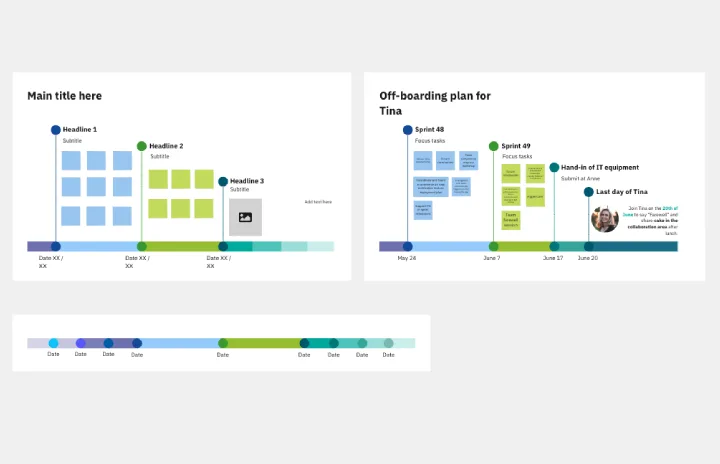
The Timeline Design template is perfect for creating visually engaging timelines. It helps you showcase project milestones, deadlines, and important events in a clear and attractive format. Ideal for presentations and reports, this template ensures your timeline is both informative and visually appealing.
All-in-one PI Planning
Works best for:
Agile
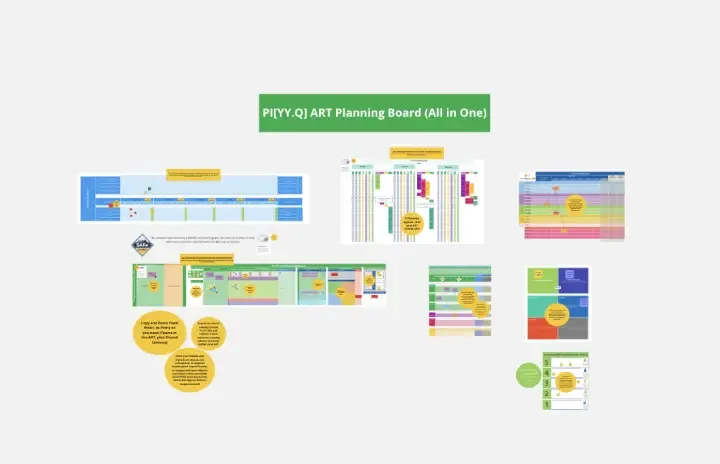
The All-in-one PI Planning template streamlines the SAFe Program Increment (PI) Planning process by providing a comprehensive framework for teams to collaboratively plan and align on objectives and dependencies. It integrates essential elements such as PI Objectives, Team Breakouts, and Program Board, enabling teams to visualize, prioritize, and coordinate work effectively. This template empowers Agile Release Trains to deliver value predictably and efficiently, driving alignment and synchronization across the organization.