Milestone Chart Template
Track each project using this milestone template, both on a visual timeline and on a static chart. Use this milestone diagram to plan out significant events scheduled to happen at specific times within the project.
About the Milestone Chart Template
A milestone chart is a visual representation of important events, known as milestones, planned in a project’s timeline. Milestone charts show one milestone per vertical line, with a description on the left-hand side of the milestone, and a horizontal timescale for the whole project.
When to use a milestone chart
Anytime your team collaborates on a large project with multiple tasks and deadlines, you can use a milestone chart. You may also find it useful to share the milestone chart with your managers or customers to update them on your progress and the likelihood of meeting your overall deadline.
Benefits of using a milestone chart
Unless your team tracks your milestones, you have no way of knowing whether you’re getting closer to your destination. By deciding on and tracking key milestones for your project, you can stay on schedule and reach your goals on time.
How to create a milestone chart
If your project has been planned or is in the process of being planned, here’s how to create a simple but effective milestone chart.
Step 1: Determine major milestones
For project managers and stakeholders, it can be difficult to parse out milestones from tasks. Milestones are distinct because they signify shifts in a project’s development. Think of them as road signs that help you stay on the right path as you work to complete a project.
To decide on a milestone, you might find it helpful to ask the following questions:
Does this task impact our deadline?
Is this a task or a deliverable?
Will this point in the project signify significant forward progress?
Does this task need to be reviewed by stakeholders?
If this task doesn’t get done, can we still complete the project?
Step 2: Create a milestone chart from a template
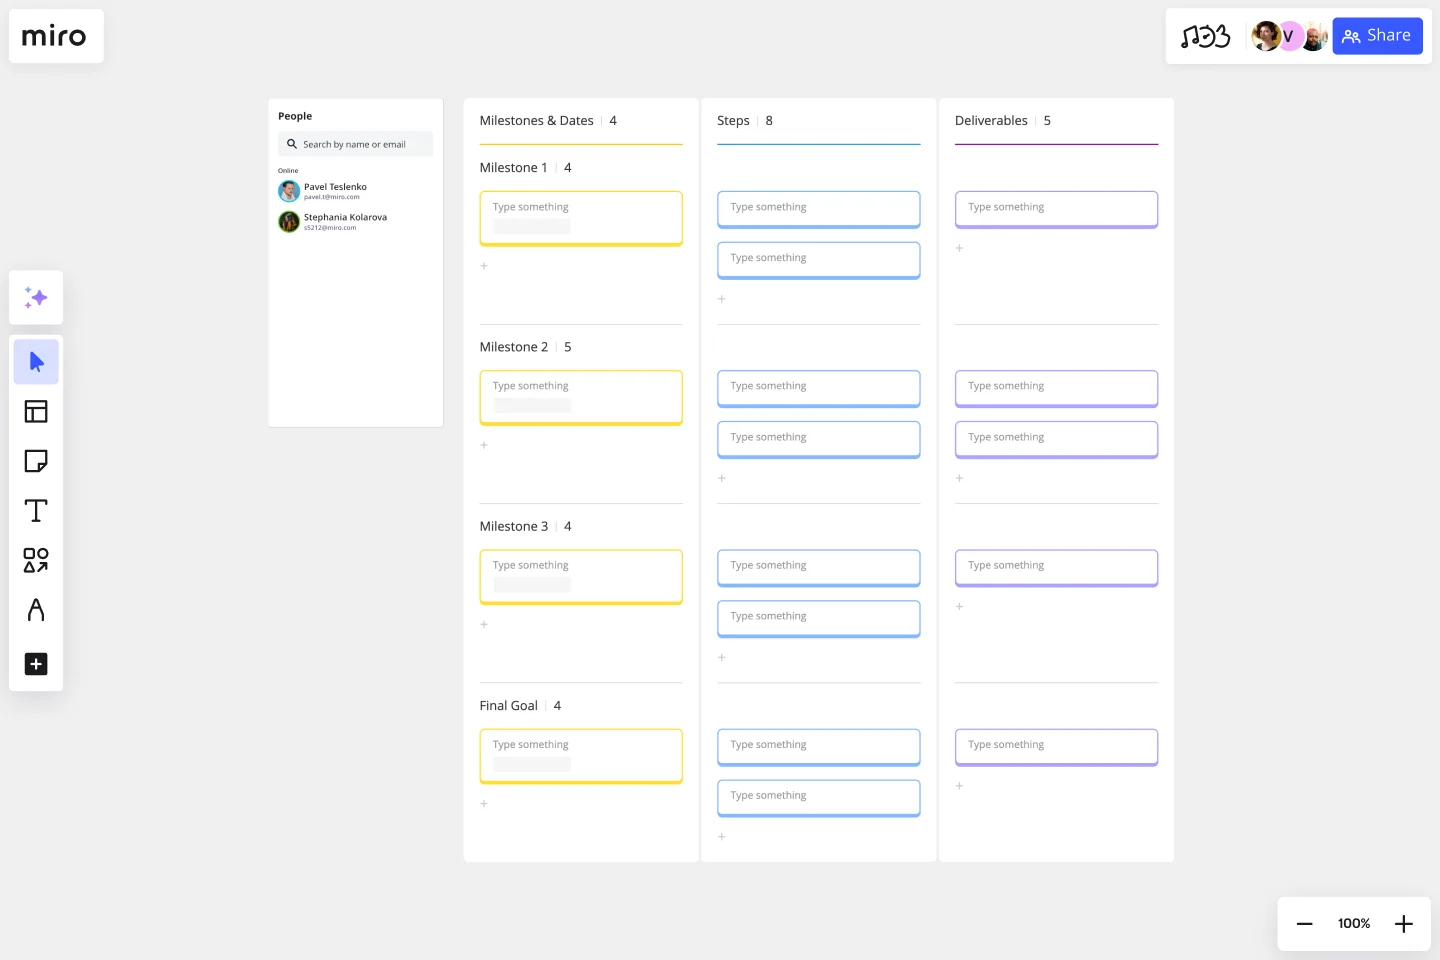
Miro is the perfect tool to create and share your milestone chart. Get started by selecting this milestone chart template. Use our simple template to visually track the smaller steps within a large project. For each milestone, we’ve pre-populated the template with several columns; as well as rows to track deadlines, steps, and deliverables. Then, customize the template to fit the needs of your particular project.
Step 3: Track each major milestone as a column
In our milestone chart template, each column is for a unique milestone. Once created, you can customize the milestone chart by adding as many columns for unique milestones as you need to. Remember, be careful to distinguish between major milestones and minor tasks. The number of milestones you chose to track will vary by project type and size, but it’s generally helpful to isolate only the most important milestones.
Step 4: Define dates, steps, and deliverables
The first row of a milestone chart is dedicated to displaying the date or dates that the particular milestone is expected to be completed. These can be specific dates, or time ranges depending on your need.
The second row of the milestone chart is for the high-level steps that need to be completed in order for the milestone to be reached. These don’t need to be very granular to avoid cluttering the chart.
The third row of the milestone chart is for specific deliverables. Ideally, these deliverables will be used to measure whether or not the milestone has been reached. Take the time to make sure these deliverables account for all major indicators of your milestone completion.
Step 5: Customize and track
Milestone charts are by design customizable for the specific project's needs. As a project progresses, you may find the need to make changes to accommodate for unforeseen problems. Keep track of each milestone’s progress, and make sure to collaborate regularly with your team on new developments.
What is the typical format of a Milestone Chart?
Track each project milestone, both on a visual timeline and on a static chart, with this detailed project milestone template. Identify who is assigned to each task, the status of each task, and any comments that accompany those tasks. Use the status key to see which tasks have yet to be started, which are on hold, and which are in progress.
How do you use a milestone chart?
Map out your project and each individual task across a predetermined timeline with this project timeline with milestones template. Show each task across a certain timeline, such as by month, quarter, or year, so you can get an accurate portrayal of the work left to be completed. Point out specific milestones that your team needs to hit in order to maintain the project timeline.
Get started with this template right now.
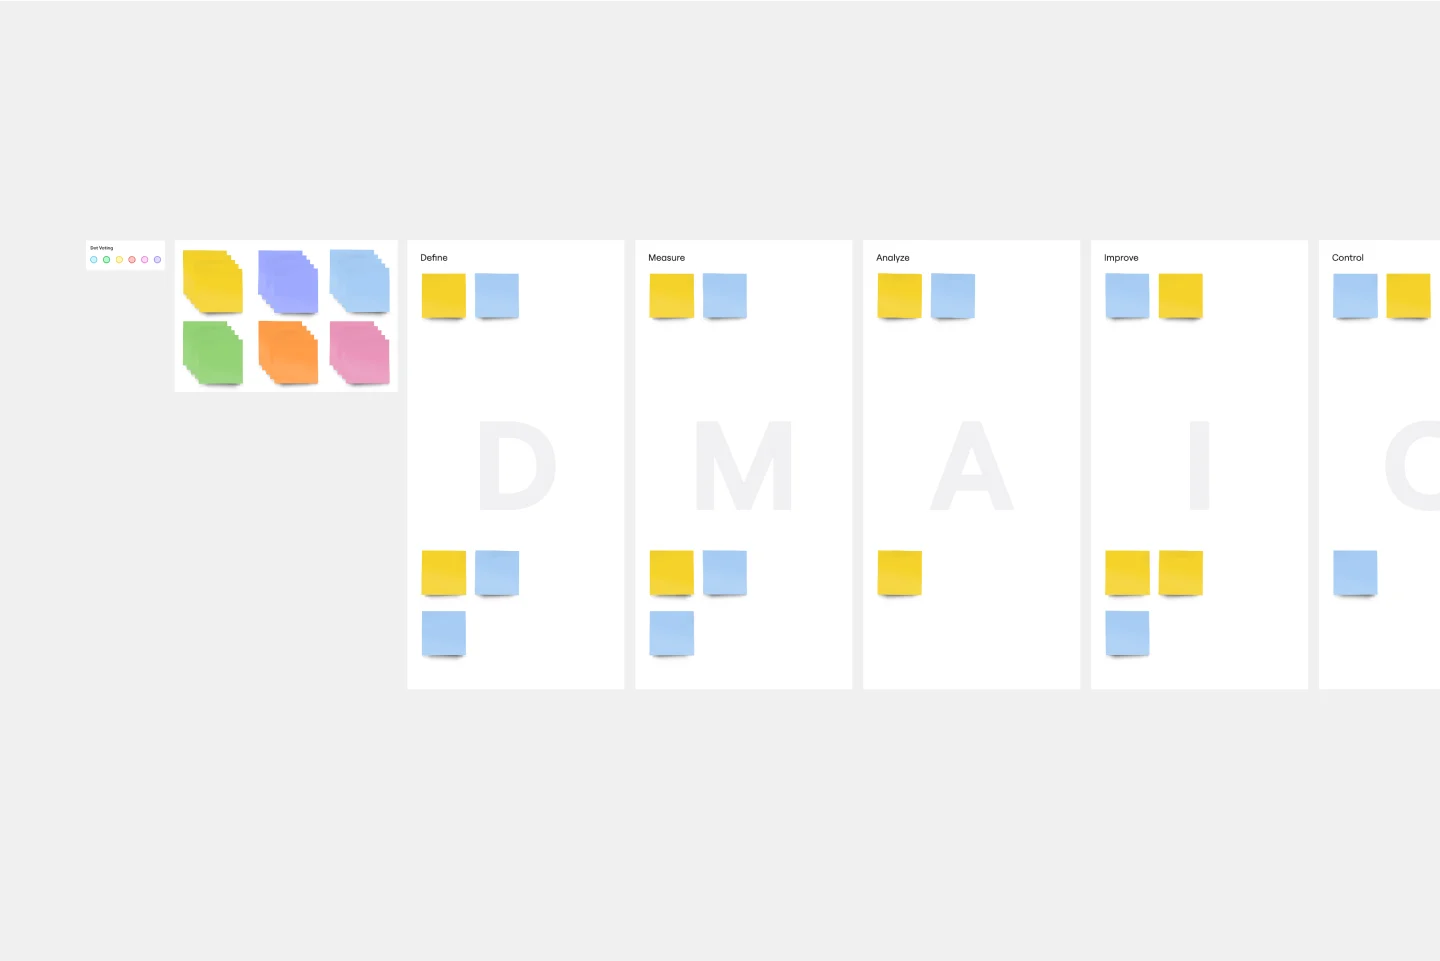
DMAIC Analysis Template
Works best for:
Agile Methodology, Design Thinking, Operations
Processes might not seem like the funnest thing to dive into and examine, but wow can it pay off—a more efficient process can lead to serious cost savings and a better product. That’s what DMAIC analysis does. Developed as part of the Six Sigma initiative, DMAIC is a data-driven quality strategy for streamlining processes and resolving issues. The technique is broken into five fundamental steps that are followed in order: Define, Measure, Analyze, Improve, and Control.
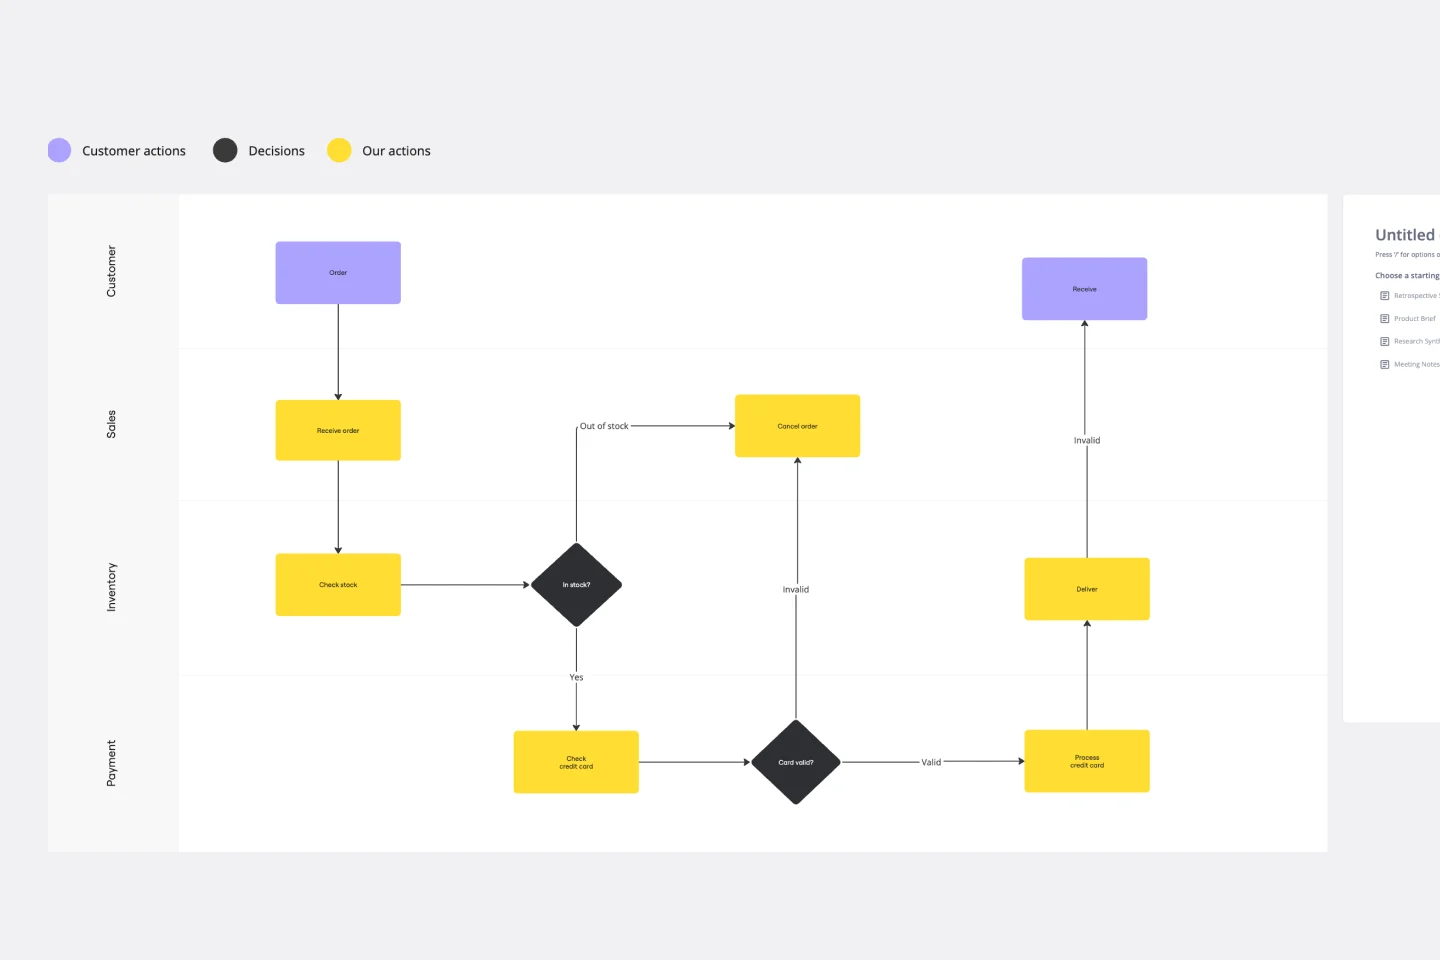
Swimlane Diagram Template
Works best for:
Flowcharts, Diagrams, Workflows
A swimlane diagram shows you which stakeholders are responsible for each area of your critical processes. You can use it to understand current processes or plan new ones.
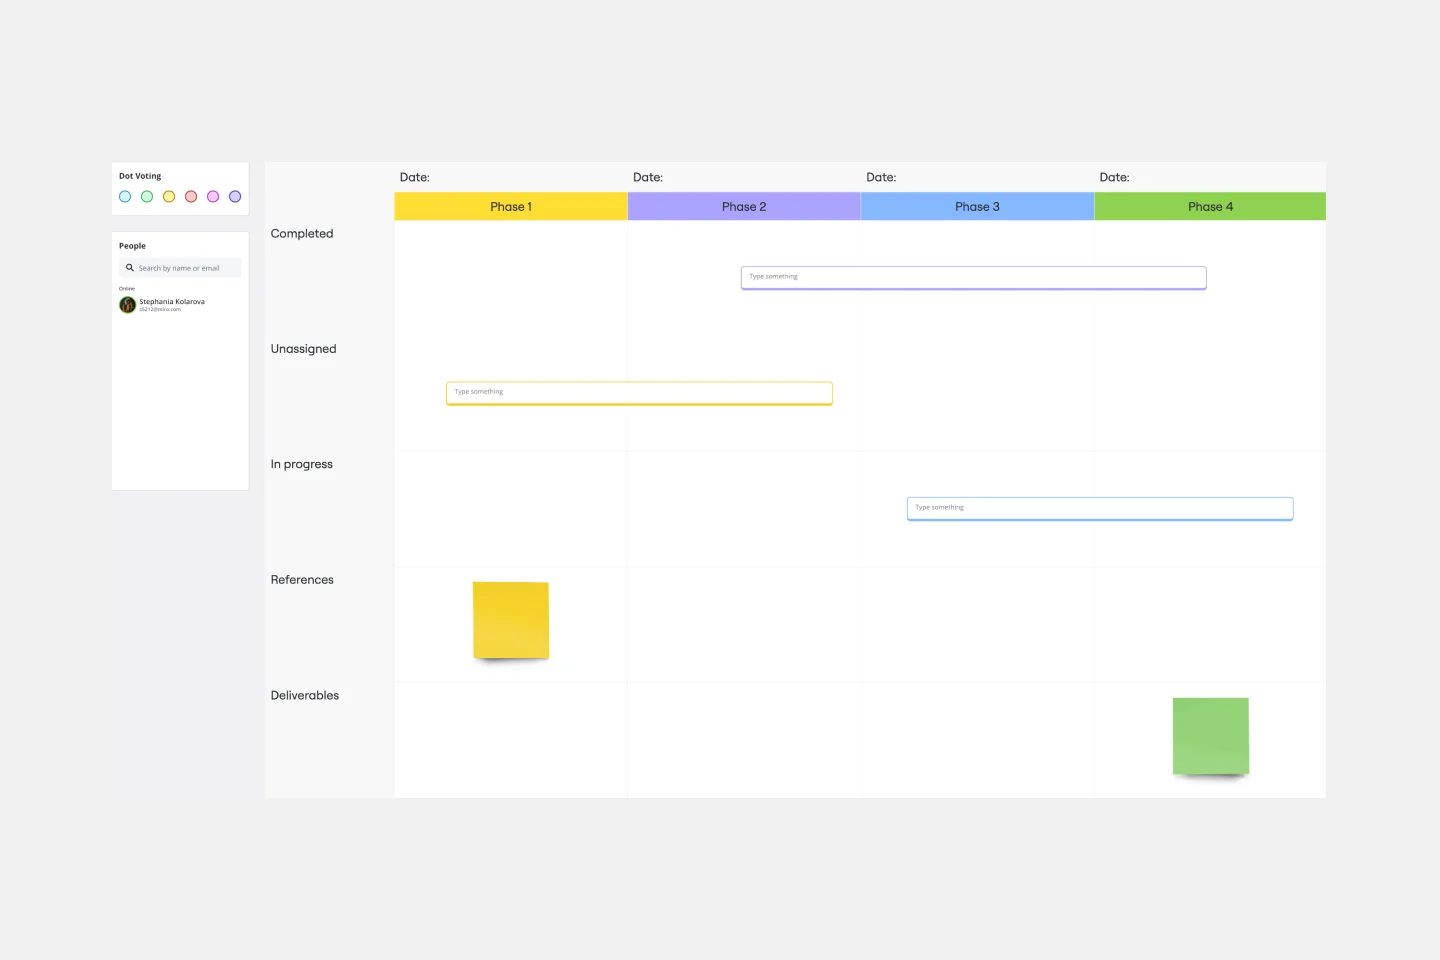
Timeline Workflow
Works best for:
Project Management, Flowcharts, Operations
A timeline is a visual tool that chronologically plots out projects step by step. It’s an ideal tool for your team to tell stories (such as an overview of events in your organization) and visualize your projects or processes. The Timeline Workflow template is perfect for any project that relies on visual content. You may find it beneficial to use with your team and also to share with other stakeholders or clients to keep them in the loop on your progress.
Six Thinking Hats Template
Works best for:
Ideation, Brainstorming
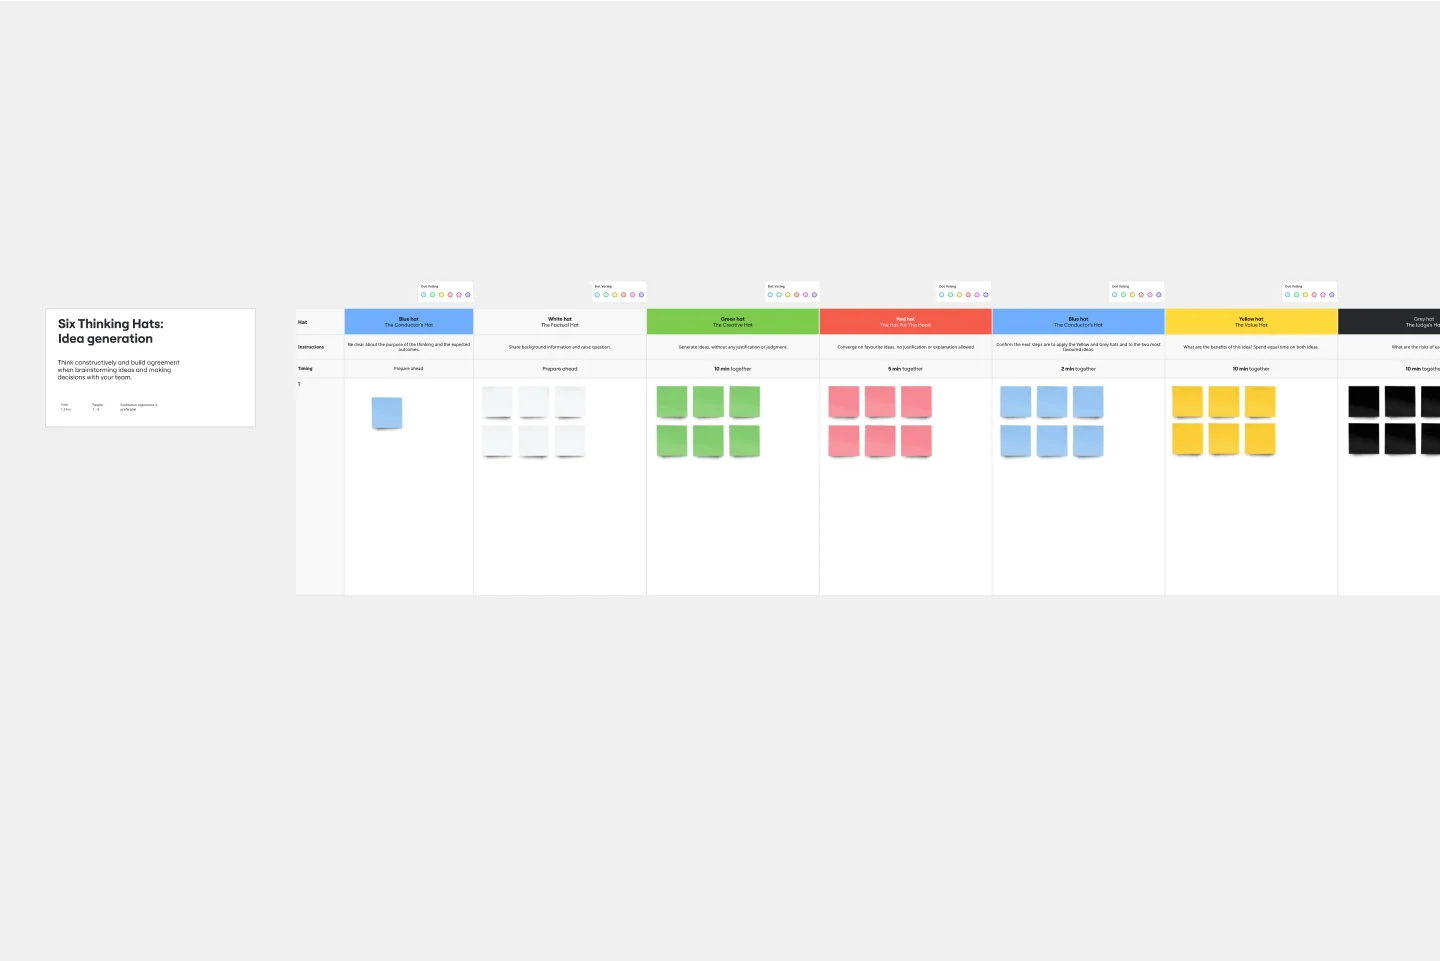
The Six Thinking Hats by Dr. Edward de Bono was created as an alternative to argument, it is designed to help teams explore and develop ideas collaboratively. Use this template to boost creative thinking and get different perspectives so you and your team can make better-informed decisions.
STAR Technique Template
Works best for:
Strategic Planning, Prioritization
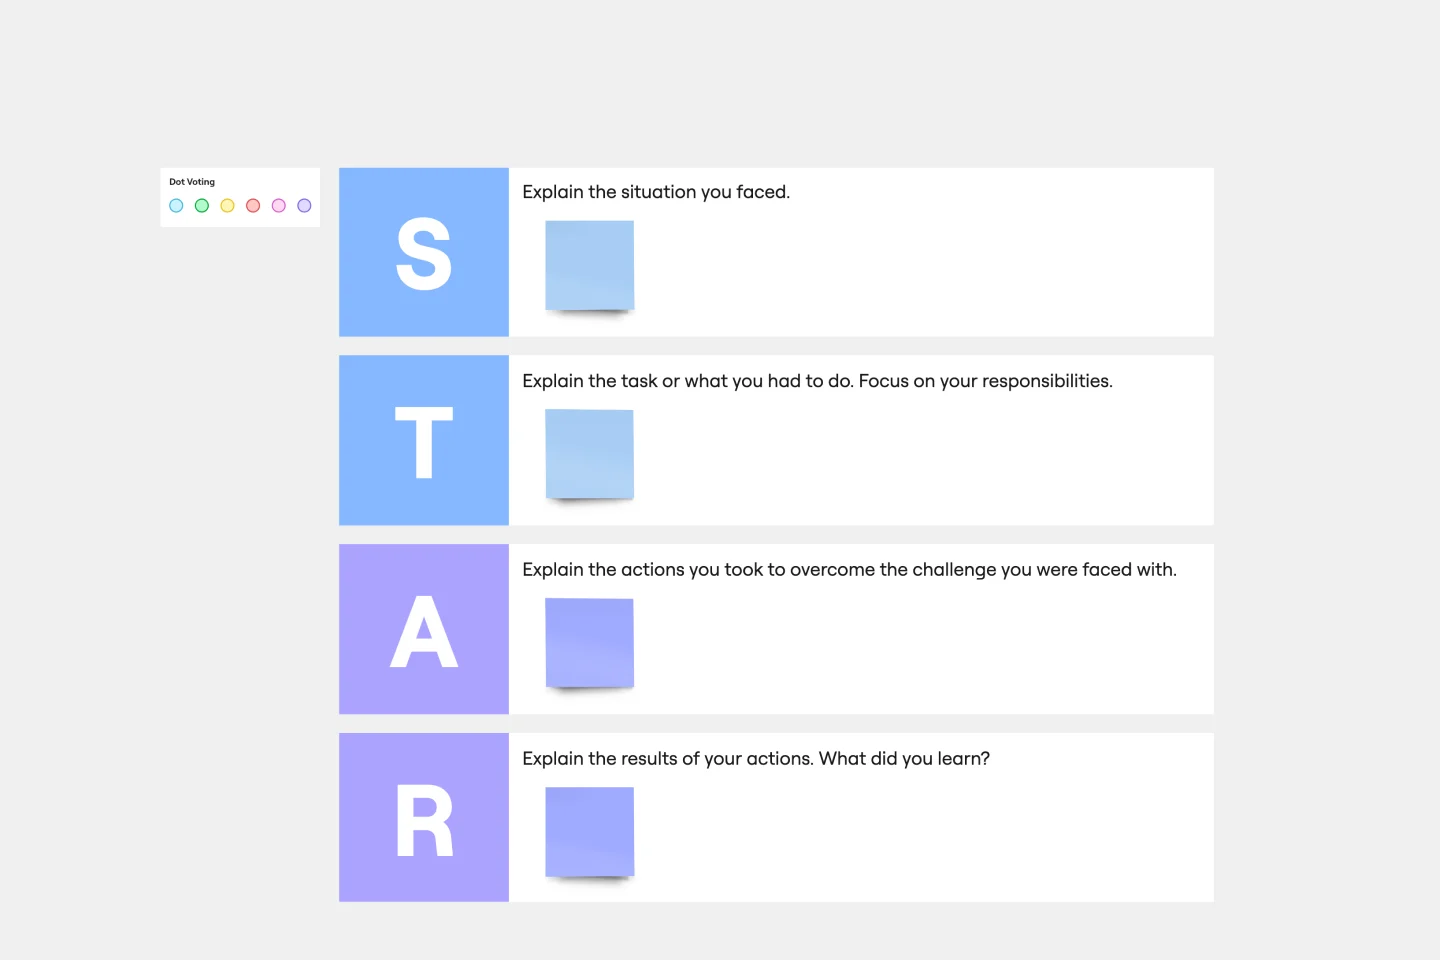
Find out how to use the STAR interview method to identify the best candidate for the role. Interviewees can also use the STAR technique to prepare detailed and thorough responses during the interview.
Scenario Mapping Template
Works best for:
Desk Research, Mapping, Product Management
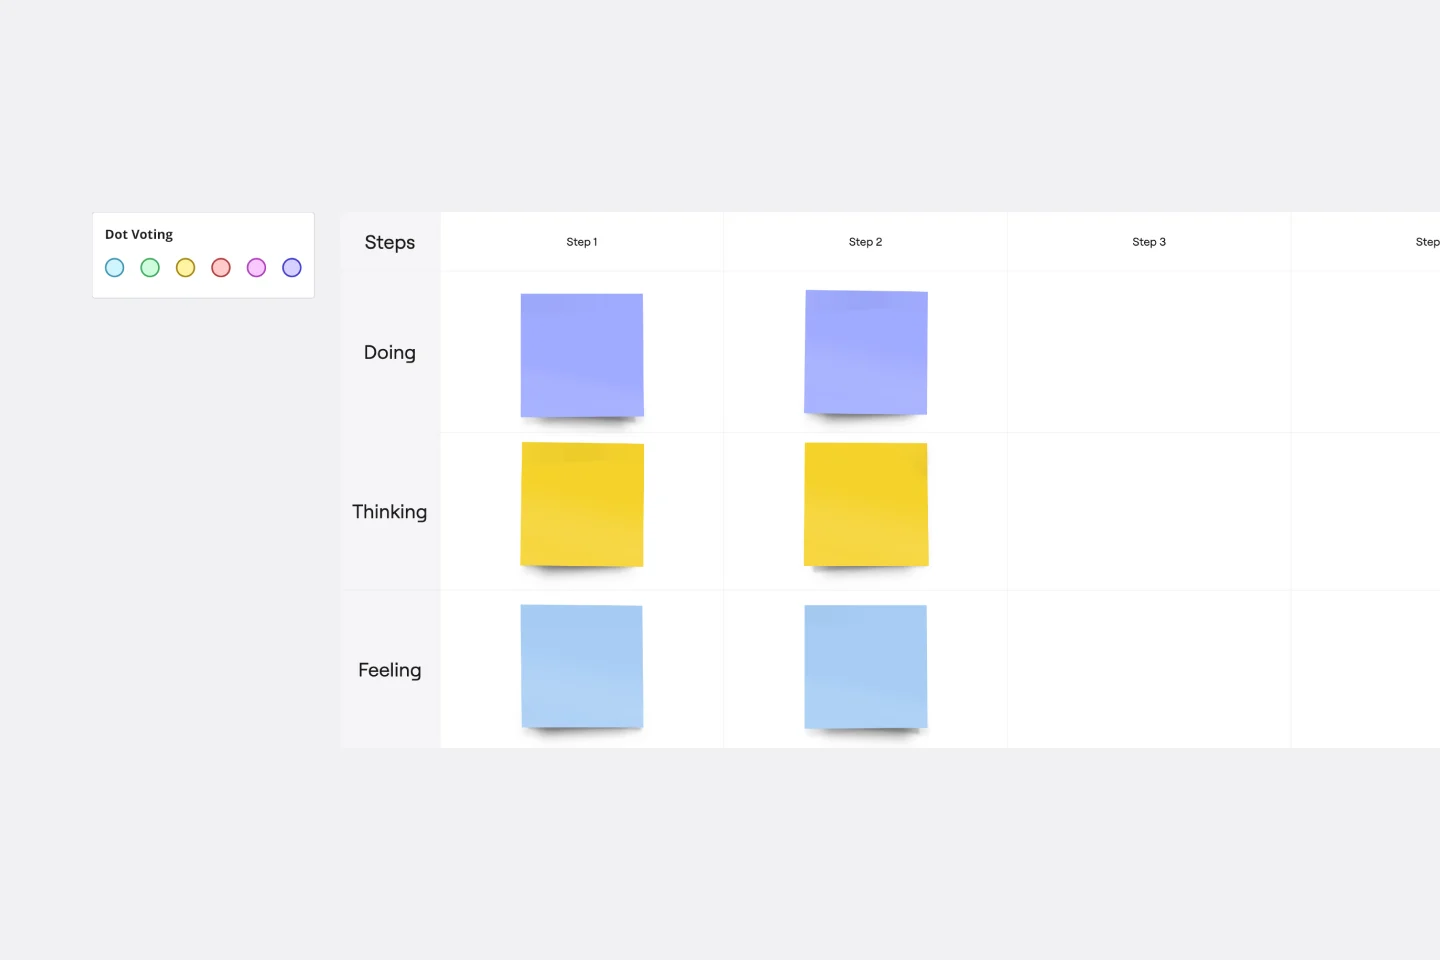
Scenario mapping is the process of outlining all the steps a user will take to complete a task. The scenario mapping template helps you create a visual guide to what different personas are doing, thinking, and feeling in different situations. Use scenario mapping to outline an intended or ideal scenario (what should happen) as well as what currently happens. If you’re trying to outline the ideal scenario, user mapping should take place very early on in a project and can help inform user stories and the product backlog. If you’re just trying to get a better sense of what currently happens, you can do user mapping when conducting user interviews or observation.