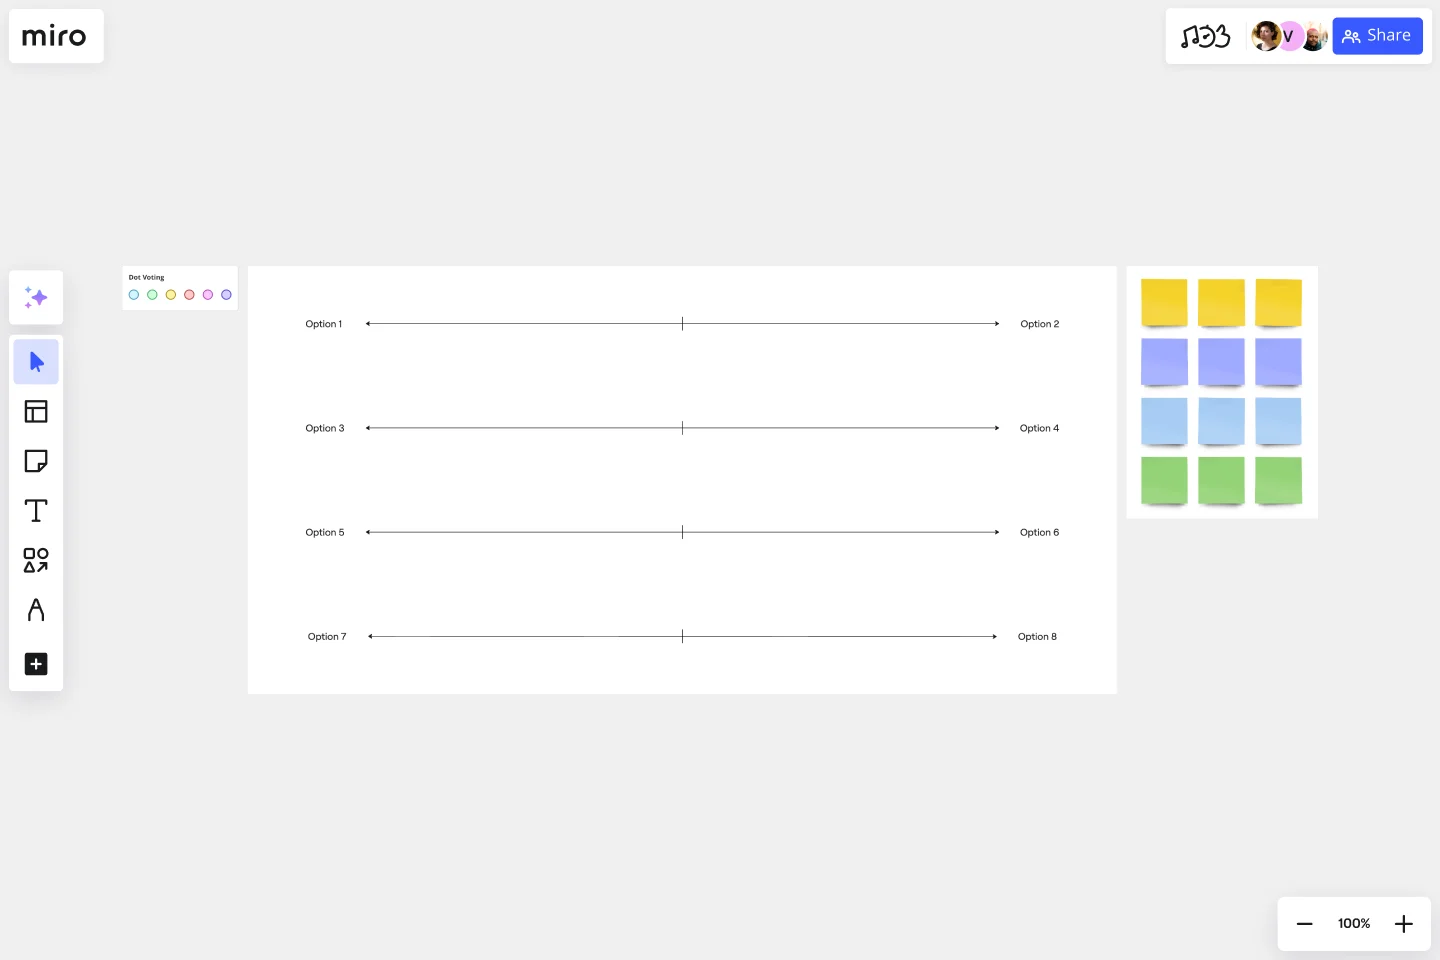
Likert Scale Template
Use our 5 (or 7) Point Likert Scale to measure attitudes, knowledge, values and opinions with a greater degree of nuance.
About the Likert Scale Template
The Likert scale is a rating system you can use to measure complex, subjective data such as how people feel about your product, service, or experience. This template makes it easy to conduct user interviews and gather feedback.
With the Likert scale template, users can pick out a possible response to a statement or question that’s either expressed in words or numbers.
Examples of responses include a range such as “strongly agree,” “neutral,” “agree,” “disagree” or “strongly disagree,” or “strongly satisfied” to “strongly dissatisfied.”
You can also use numbers, such as 1 = “strongly agree,” 2 = “agree,” and so on.
Tips for using the Likert scale template
The Likert scale is either a five (or seven) point scale of response options that asks your customer or interview subject to agree or disagree with a statement.
The scale assumes that the intensity of someone’s attitude or opinion is linear, ranging from strongly agree to strongly disagree, and assumes that attitudes can be measured.
For example, each of the five (or seven) responses would either be counted in terms of how often a sentiment was expressed or have a numerical value that would be used to measure the attitude being explored.
Likert data can be a reliable source to point to how people think and feel, as long as you’re aware of the when-in-doubt-just-agree tendency.
To reduce the impact of this bias, researchers can...
Phrase questions as statements: presenting facts for customers to align with (or reject) can offer insight into different pieces of your business. Accordingly, the score averages give you a general measure of satisfaction that you can track over time and try to improve.
Include and evaluate both positive and negative statements, in pairs, for consistency: instead of measuring one-off sentiments, see if your customers are reliably in agreement, disagreement, or neutral in more than one instance.
When to use the Likert scale template
Researchers across disciplines, from UX to marketing to customer experience, can use a Likert scale to measure statements of agreement.
Depending on your product, service, or experience, the scale can also be used to measure:
Agreement: Strongly agree → Strongly disagree
Frequency: Often → Never
Quality: Very good → Very bad
Likelihood: Definitely → Never
Importance: Very important → Unimportant
To get a more accurate measurement of everyone’s responses, it’s worth asking people to agree or disagree with multiple statements. You can then combine or average a person’s responses.
How to use the Likert scale template
Get started by selecting the Likert scale template, then take the following steps to make one of your own:
Decide what you’d like to measure. This is the foundation for your research. Ensure that what you’re measuring can be scaled on the strength of opinions, attitudes, feelings, or experiences. Customers should see two clear extremes (positive and negative) and a neutral midpoint.
Create or edit the indicator statements or questions. The scale works best when you’re trying to find customer insights that can’t be understood with just one answer. An example statement could be, “The number of items on the takeaway menu overwhelms me.” Every statement (or each question) is trying to dig into what your customer actually feels.
Decide on Likert response scales. At a minimum, you can aim for a 5-point scale. At maximum, a 7-point scale. Any less or any more can compromise readability. Choose simple, clear language with different categories, such as “Agree - Disagree,” “Helpful - Not Helpful,” “Always - Never.” You can add or delete sticky notes (which can act as points and categories) accordingly.
Pre-test with your team. Share the Miro board with your team to test any unclear questions, awkwardly worded statements, or duplicate categories. Ask your team if every element on the scale can help you gather actionable feedback. If not, revise or delete that element.
Test (and re-test) as needed. Invite participants onto your board and ask them to respond to each statement or question. Data collection should be a process that you keep fine-tuning over time. Start with a small sample group of participants representing a larger group you’re trying to learn about. Refine – or expand – your point scale and category language as you get user feedback and calculate results.
Organize and import Likert Scale survey results visually from other sources. Import survey results as needed on your Miro board, to share and review with your team.
Get started with this template right now.
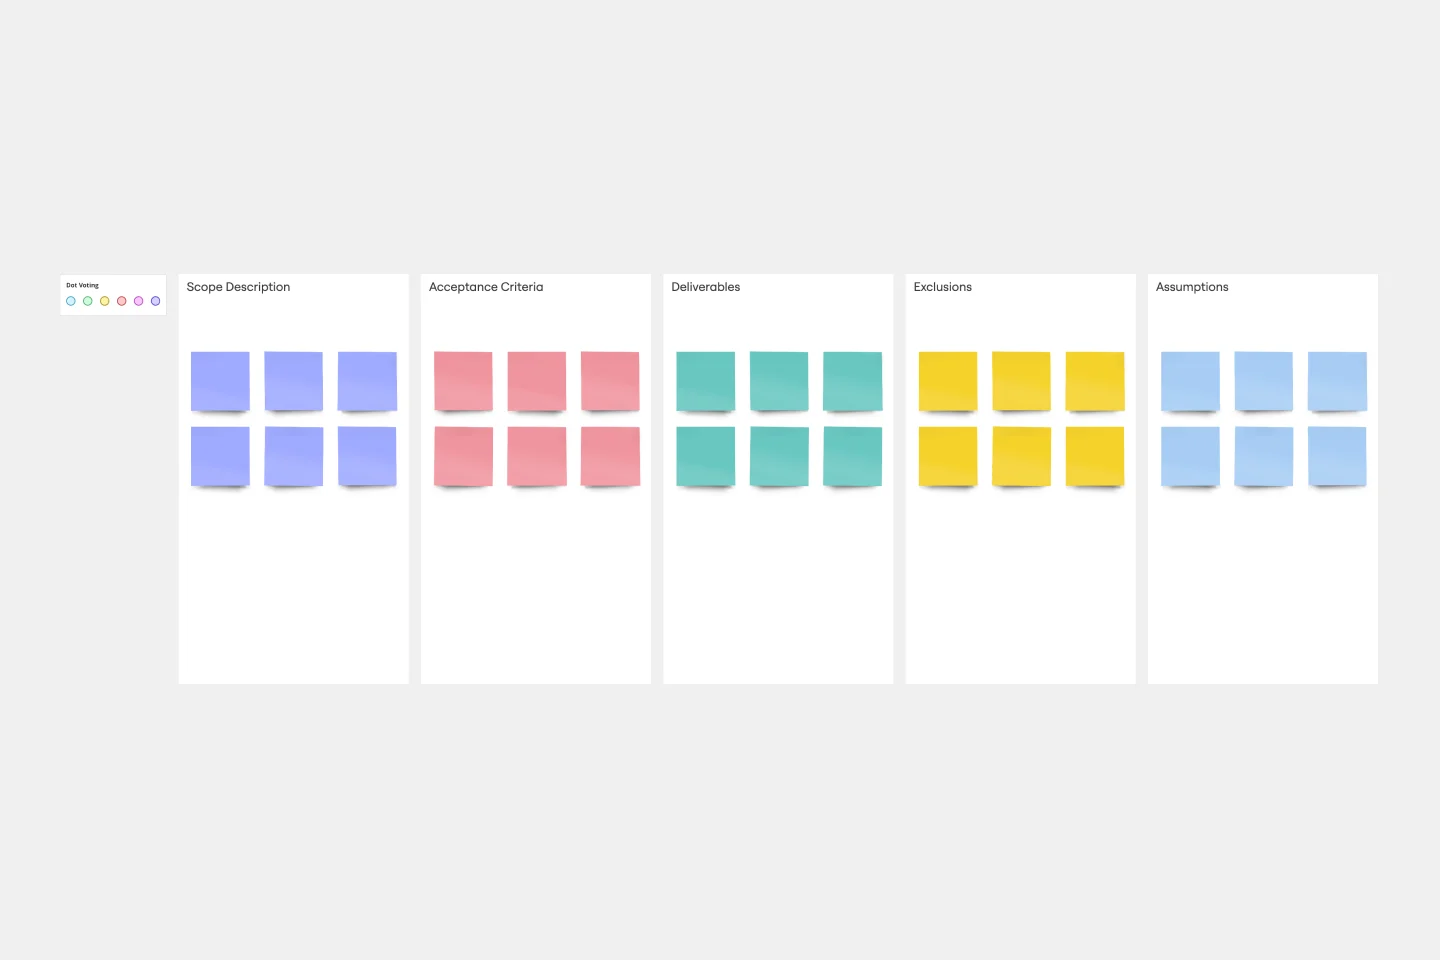
Project Scope Template
Works best for:
Project Management, Decision Making, Project Planning
A project scope helps you plan and confirm your project’s goals, deliverables, features, functions, tasks, costs, and deadlines. A project manager and team should develop a project scope as early as possible, as it will directly influence both the schedule and cost of a project as it progresses. Though project scopes will vary depending on your team and objectives, they generally include goals, requirements, major deliverables, assumptions, and constraints. Aim to include the whole team when you create a project scope to ensure everyone is aligned on responsibilities and deadlines.
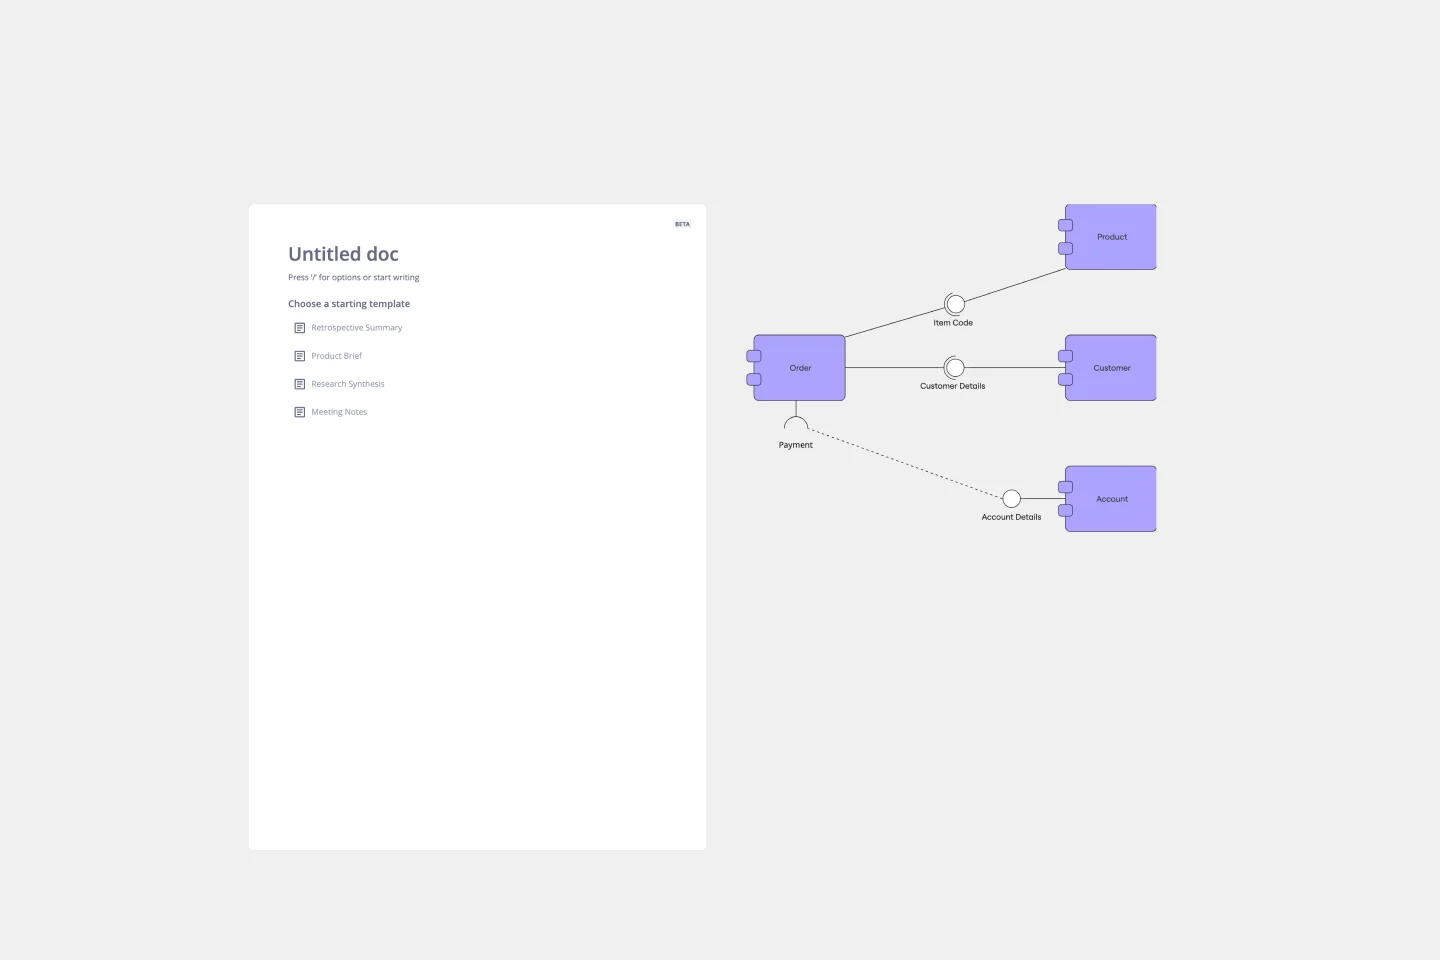
UML Component Diagram Template
Works best for:
Mapping, Diagrams, Software Development
Use our Component Diagram template to show how a system’s physical components are organized and wired together. Visualize implementation details, make sure planned development matches system needs, and more — all in a collaborative environment.
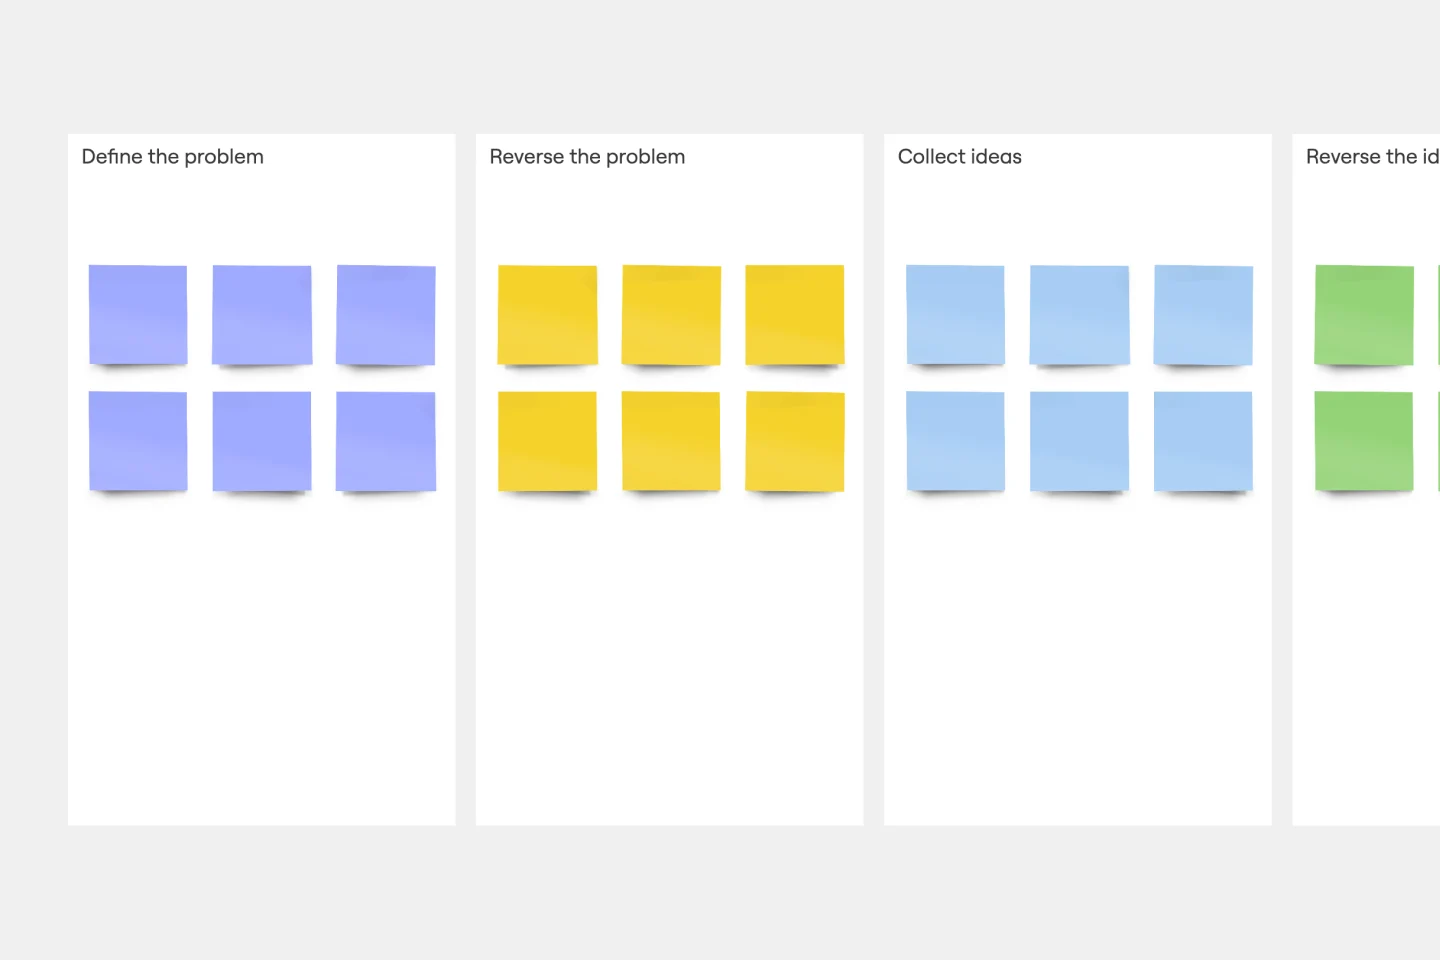
Reverse Brainstorming Template
Works best for:
Ideation, Brainstorming, Team Meetings
Reverse brainstorming is a technique that prompts a group to think of problems, rather than solutions. Because we naturally think of problems, it’s a great way to get a group to anticipate problems that may occur during a project. To engage in reverse brainstorming, start by identifying the problem, and then think of things that might exacerbate it. Ask your team to generate ideas around ways in which the problem could get worse. Reverse the problems into solutions again, and then evaluate your ideas.
Scenario Mapping Template
Works best for:
Desk Research, Mapping, Product Management
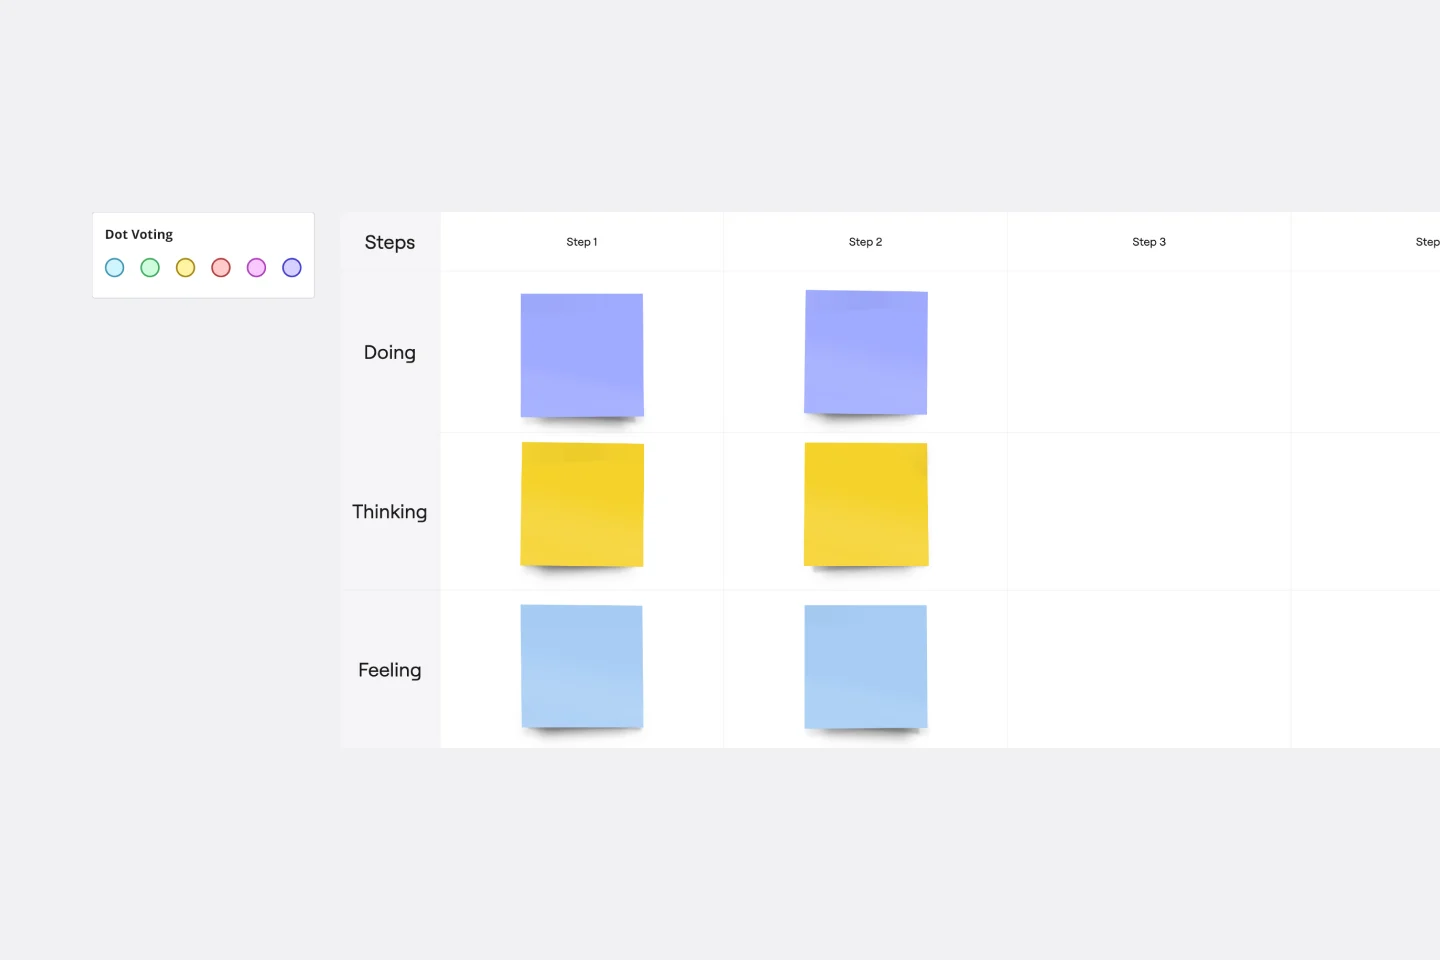
Scenario mapping is the process of outlining all the steps a user will take to complete a task. The scenario mapping template helps you create a visual guide to what different personas are doing, thinking, and feeling in different situations. Use scenario mapping to outline an intended or ideal scenario (what should happen) as well as what currently happens. If you’re trying to outline the ideal scenario, user mapping should take place very early on in a project and can help inform user stories and the product backlog. If you’re just trying to get a better sense of what currently happens, you can do user mapping when conducting user interviews or observation.
Product Positioning Template
Works best for:
Marketing, Product Management, Desk Research
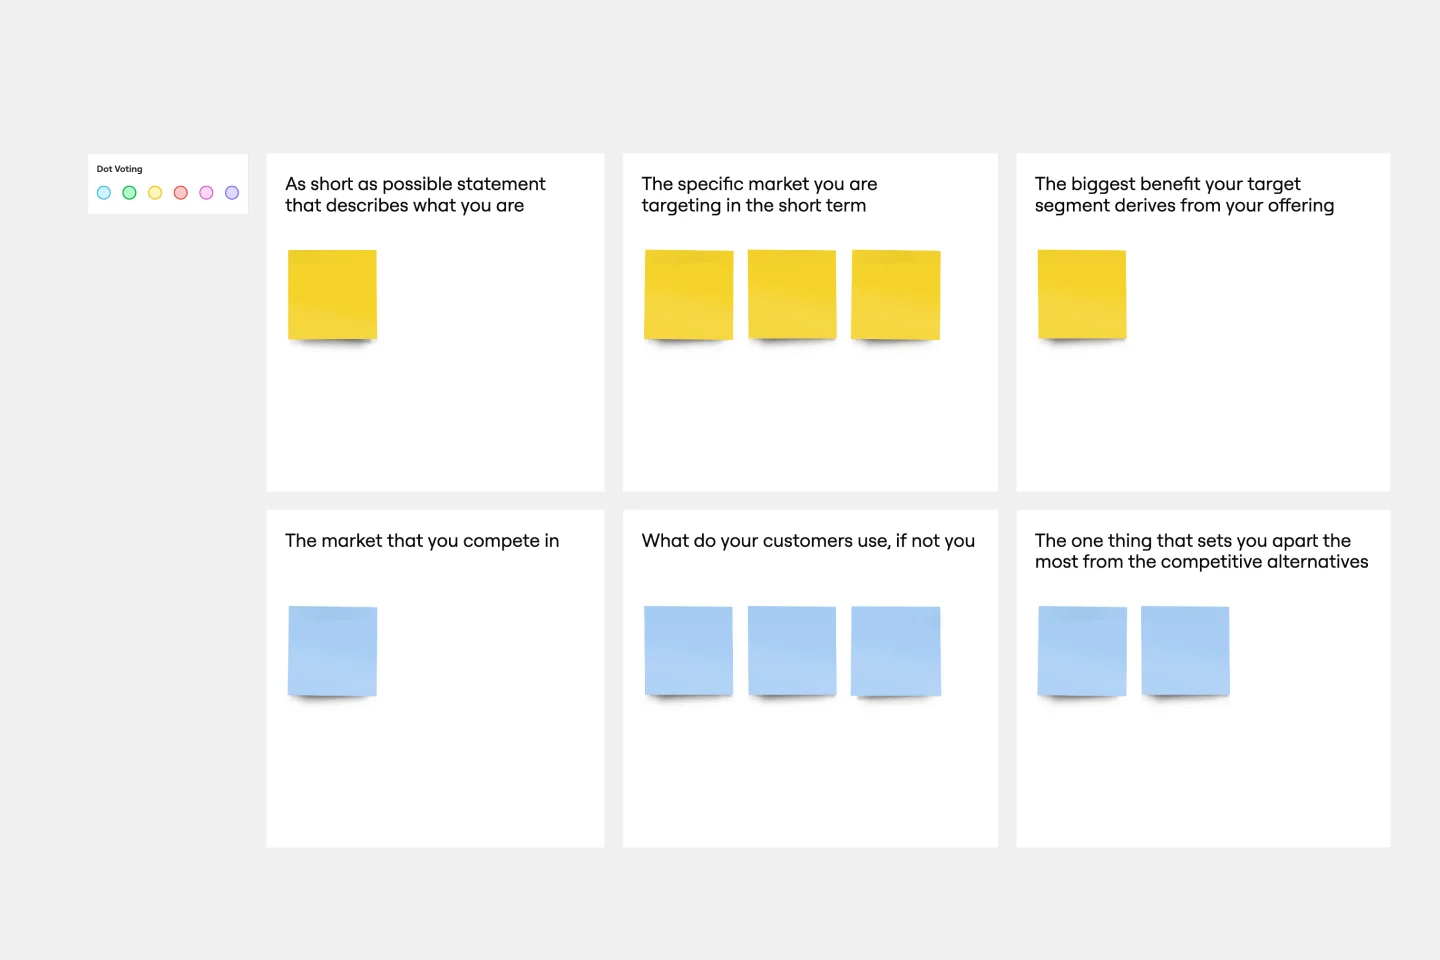
For better or for worse, your company’s chances for success hinge partially on your market. As such, before you start building products and planning strategies, it’s a good idea to conduct a product positioning exercise. A product positioning exercise is designed to situate your company and your offering within a market. The product positioning template guides you to consider key topics such as defining your product and market category, identifying your target segment and competitors, and understanding your key benefits and differentiation.
Love Bomb Icebreaker Template
Works best for:
Icebreakers
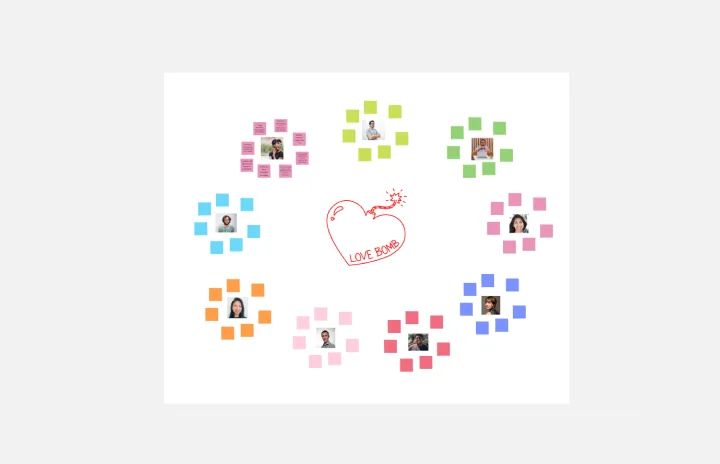
Encourage team members to show their appreciation for each other using Miro’s free Love Bomb Icebreaker Template. Participants can add words or phrases that show what they appreciate about their colleagues.