KPI Tree Template
Use the KPI Tree Diagram to provide a clear and organized overview of complex business goals and plans.
About the KPI Tree Template
As our business initiatives evolve, tracking and understanding key performance indicators (KPIs) becomes paramount. The KPI Tree Template is designed to offer a visually compelling method for aligning objectives, strategies, tactics, and KPIs. This ensures cohesion and understanding across the team, streamlining our efforts toward shared goals.
What's a KPI Tree Template?
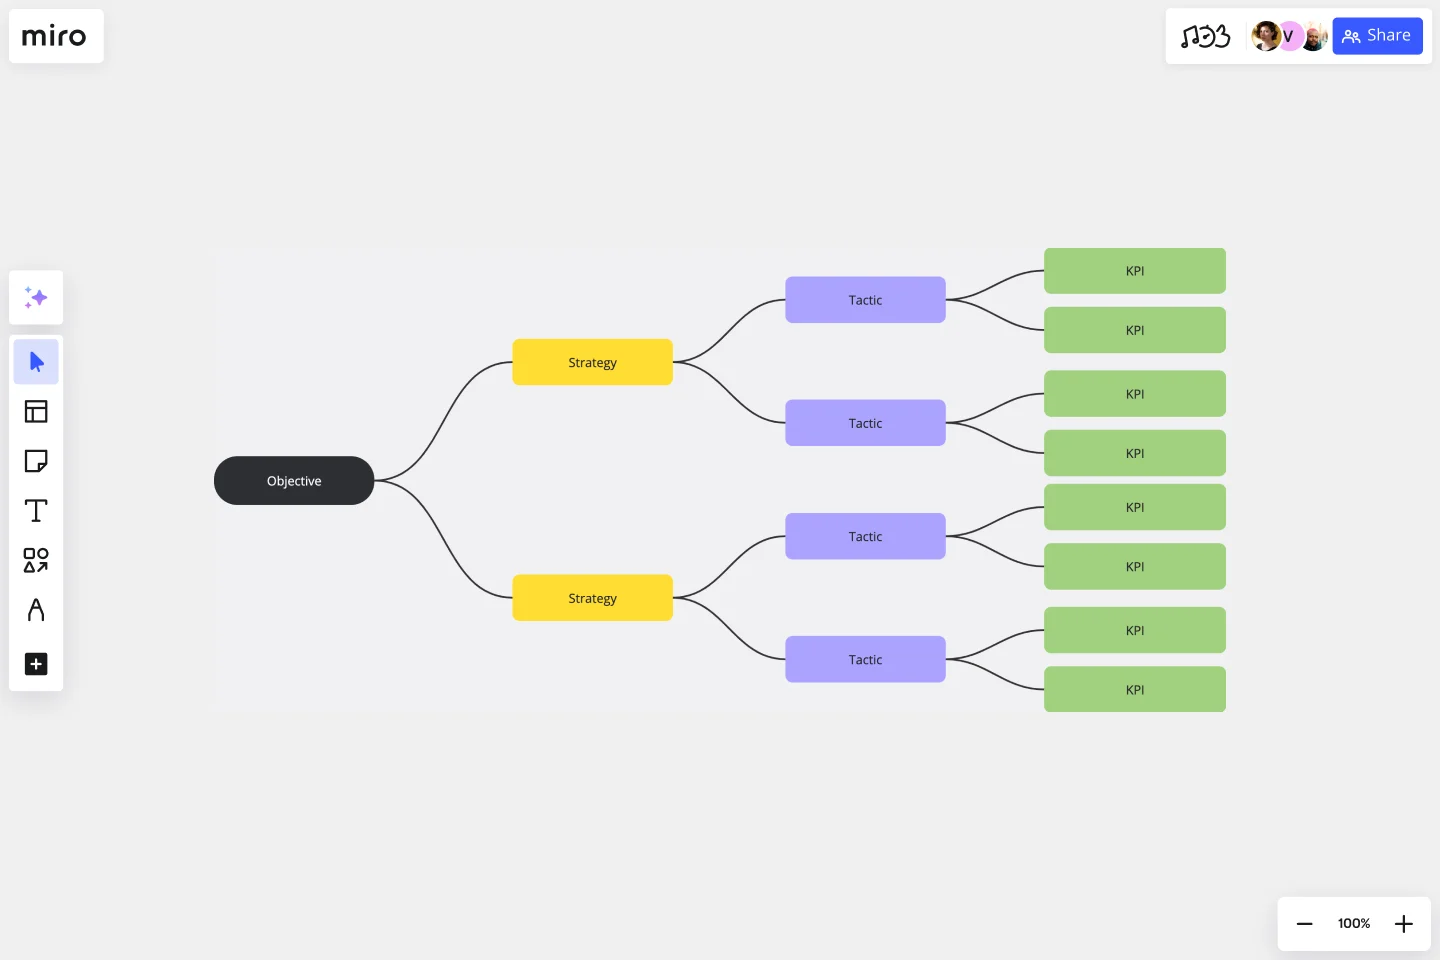
A KPI Tree Template is a structured visual tool that systematically breaks down an organization's primary objectives into detailed strategies, tactics, and measurable KPIs. By presenting these elements hierarchically, organizations can better discern the relationships between various components and how each contributes to the overarching goals.
One of the primary benefits of using this template is its ability to provide clarity. Instead of viewing goals and strategies as isolated entities, teams can witness the interplay of different elements, ensuring that all efforts are harmonized and directed toward achieving the organization's mission. Also, this visual mapping promotes enhanced communication and understanding among team members, reducing potential misalignments and fostering a unified approach to achieving business milestones.
How to use a KPI Tree Template in Miro
Miro's automated diagramming features make creating and navigating your KPI tree a breeze. Here's a step-by-step guide to using the KPI Tree Template:
Start your tree with an objective: Define the primary objective or goal your organization wishes to achieve. This serves as the root from which all other branches will grow.
Branch out with strategies: For every objective, outline the strategies you intend to employ. These broader courses of action or approaches will help achieve the objective.
Dive deeper with tactics: Under each strategy, list out the tactics. These are specific actions or methods you will undertake to execute your strategy.
Define and attach KPIs: For every tactic, set measurable KPIs that will help you track the progress and effectiveness of that specific tactic. KPIs should be clear, quantifiable, and directly linked to the tactic it's measuring.
Throughout the process, use Miro's automated diagramming feature to quickly expand your KPI tree components by clicking on the shapes and selecting the blue dots to add more.
Can multiple people collaborate on the KPI Tree Template in real time?
Yes, Miro allows for real time collaboration, ensuring team members can work on the template simultaneously, share ideas, and make instantaneous updates.
Is the KPI Tree Template customizable?
Yes, the template is fully customizable. You can adjust colors, fonts, and even the structure to better fit your organization's branding and preferences.
Can I link external data or documents to the KPIs in the template?
Certainly! Miro supports linking to external resources, allowing you to provide more detailed insights or references directly from your KPI Tree.
What should I do if I run out of space while expanding my KPI Tree?
No worries! Miro's automated diagramming features enable you to enlarge the tree easily. If a section grows too extensive, you can effortlessly adjust and reorganize it to make room for additional information.
Get started with this template right now.
Content Strategy Template
Works best for:
Strategic Planning
Bring consistency across communication channels and develop killer content strategies with this Content Strategy Template. Designed to plan and deliver high-impact content, use this tool to collaborate faster and better.
Fishbone Diagram for Quality Control
Works best for:
Fishbone diagram
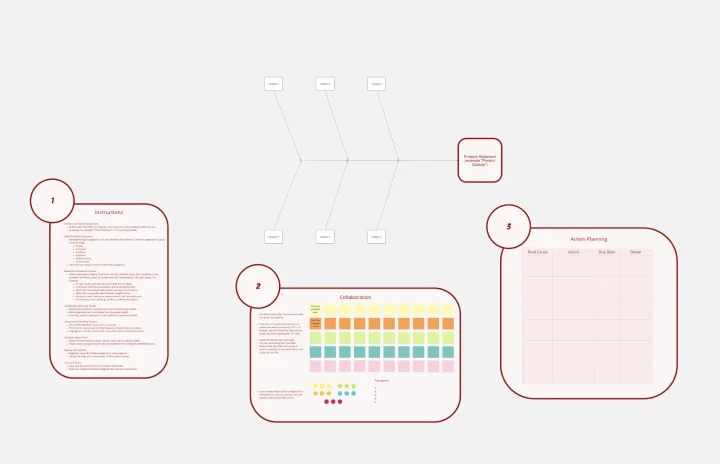
Maintaining high standards of quality is vital in any industry. The Fishbone Diagram for Quality Control template helps you identify and analyze the root causes of quality issues. Use it to categorize potential causes into areas such as materials, methods, manpower, and machinery. This structured approach ensures a thorough examination of all possible factors affecting quality, leading to more effective solutions and continuous improvement.
Mandala Chart Template
Works best for:
Planning, Brainstorming, Goal setting
The Mandala Chart Template helps you visualize the relationships between a central theme and its sub-themes. One of the key benefits is how it fosters a holistic understanding of any topic. This perspective ensures every detail is noticed, making it an invaluable asset for those aiming for comprehensive insight and thorough planning or a better understanding of their goals.
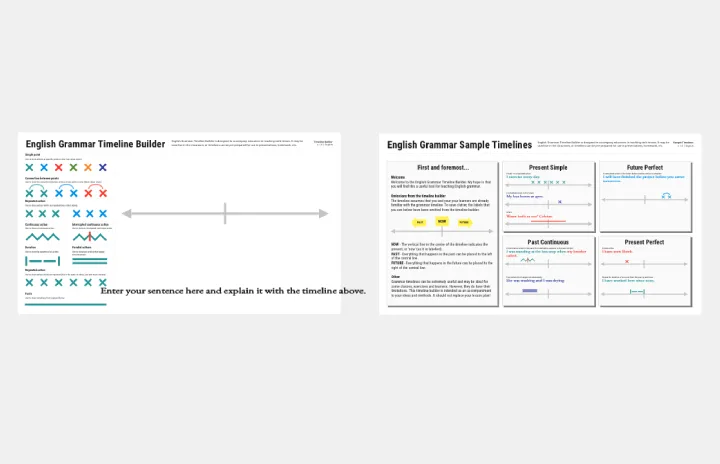
English Grammar Timeline Builder
The English Grammar Timeline template helps you map out the progression of grammar concepts over time. This is a great tool for educators and students to visualize the sequence and relationship between different grammar topics, making learning and teaching more effective.
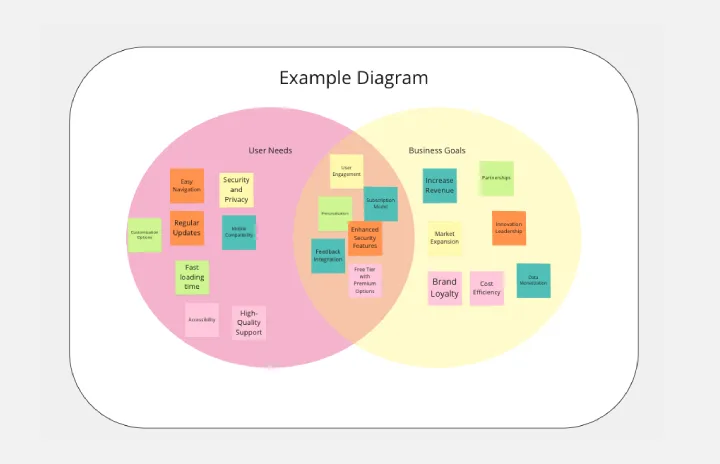
Venn Diagram for Product Development
Works best for:
Venn Diagrams
Streamline your product development process with the Venn Diagram for Product Development template. Use it to compare product features, identify market needs, and explore design options. This template helps you visualize relationships and prioritize features based on customer requirements and competitive analysis. It's an essential tool for product managers, designers, and development teams aiming to create successful and user-centric products.
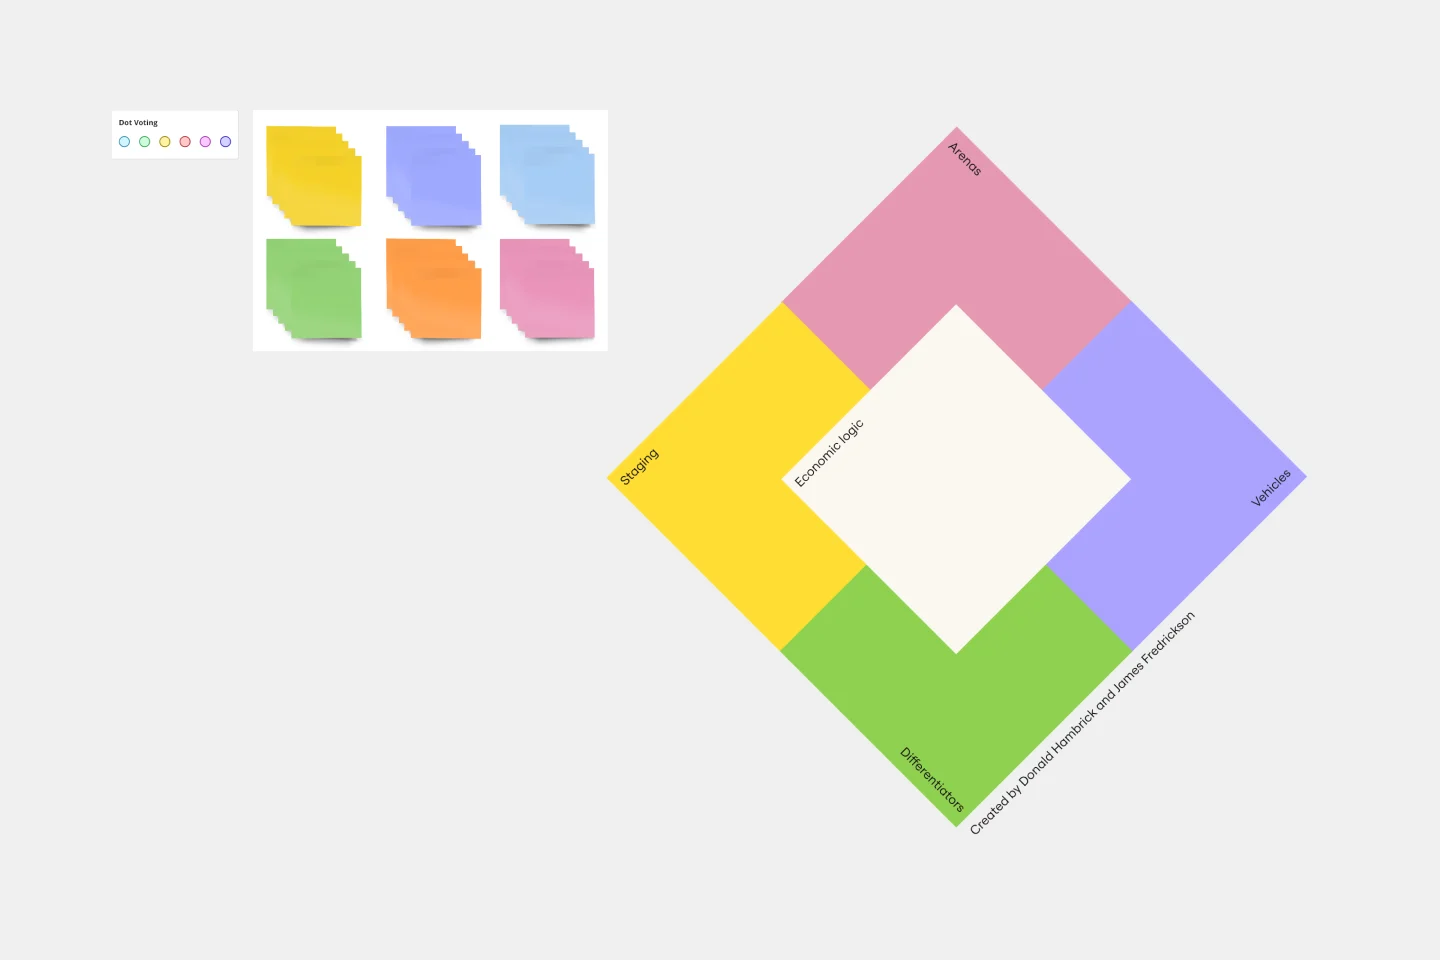
Strategy Diamond Template
Works best for:
Leadership, Operations, Strategic Planning
To achieve key objectives, every business assembles a series of strategies. But what elements should you consider when building a strategy? A strategy diamond is a collection of elements forming a coherent business strategy. These elements include: Arenas, Differentiators, Vehicles, Staging, and Economic Logic. Most strategic plans focus on just one or two of these elements, creating gaps that might cause problems for your business later on. A strategy diamond can help you stay focused and ensure you’re fulfilling all of your business’s needs rather than one or two.