Journey Map To Plot the Customer Experience
A journey is a tool to map out the customer experience of (a part of) your product/service in a visual way.
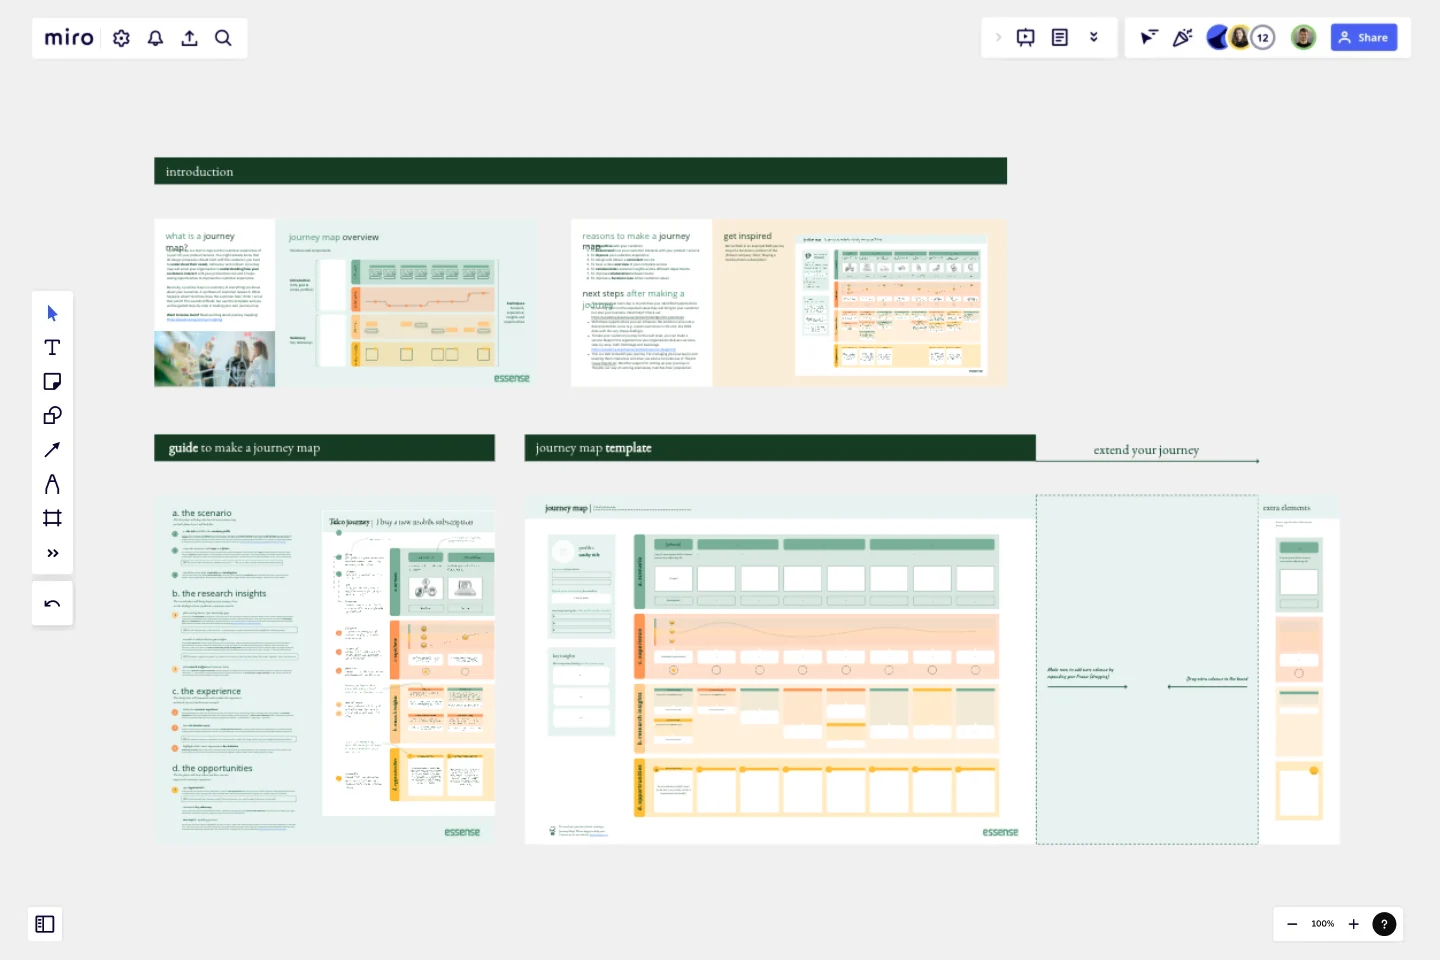
Suppose your organization provides a product or service, for example, mobile phone subscriptions. On your Journey Map, you will find a customer who goes through the process of selecting and purchasing a subscription (scenario), how the customer perceives each step (experience), what you learned about the overall needs of your customers (insights), and what can still be improved (opportunities). A journey map will serve your organization in understanding how your customers interact with your product/service and it helps see opportunities to improve the customer experience.This sounds more difficult than it is, but use this template and you will be guided step-by-step in making your own journey map.From our experience as a service design agency, we also provide you with tips and examples for how you can use a Journey Map for empathizing with your customer and improving your customer experience. Additionally, a Journey Map can be used to gain a complete overview of your services and improve collaboration between your departments.Our instructions for making your own Journey Map:
The scenario: Determine the scenario and profile. With this scenario, sketch a first draft of what this journey could look like from the perspective of your customer. You can enrich the scenario by adding drawings or pictures.
The research insights: collect and plot existing data on the journey map (reviews, earlier research, and personas). Look for knowledge gaps and assumptions that need validation. Execute user research to collect additional insights about the customer experience (i.e. interviews or observations). Analyze this data and cluster corresponding findings, quotes and insights and plot these on your journey map.
The customer experience: Define the customer experience based on the research and insights collected, and draw the emotion curve. Here you emphasize where things go well and where improvement is needed. Determine which steps make or break the overall experience and where to focus first.
The opportunities: Together with key stakeholders, analyze the journey to spot opportunities that can improve your customer experience. The journey might contain a lot of information and opportunities, so summarise the key takeaways to make the journey actionable, and determine what the next steps will be.
This template was created by Essense.
Get started with this template right now.
AWS Control Tower Account Governance Template
Works best for:
AWS
The AWS Control Tower Account Governance Template streamlines the setup and management of governance across multiple AWS accounts. It leverages AWS Control Tower to automate and simplify the governance process, ensuring that your AWS environment adheres to best practices for security, operations, and compliance. This template is highly customizable, allowing you to adjust governance controls and policies to meet the unique requirements of your organization. It provides a centralized view of your AWS environment, enhancing visibility and control, and scales with your organization as it grows.
Action Plan Template
Works best for:
Education, Project Management, Project Planning, Kanban
Why create an action plan? Long-term business strategies and goals are only good if you can make them a reality—by accomplishing every small task along the way. An action plan lists those tasks and lays them out in clear detail. It helps you keep everything in order, make sure nothing is missed, and get stakeholders on the same page to complete a project quickly and effectively. This template will help you write an action plan that’s SMART: Specific, Measurable, Actionable, Realistic, and Time-bound.
Data Org Chart
Works best for:
Org Charts, Operations, Mapping
The Data Org Chart template provides a visual representation of data-related roles and relationships within an organization. By mapping out data management responsibilities and dependencies, teams can enhance data governance and improve collaboration. With features for customizing data roles and connections, this template empowers teams to optimize data processes and ensure data integrity and compliance.
7S Template
Works best for:
Strategy
The 7S Framework Template stands out as an essential tool for organizations aiming to comprehensively understand their internal dynamics. One of its key benefits is its ability to foster strategic alignment. By visually breaking down the interconnectedness of seven core elements - from strategy to staff - the template enables teams to ensure that their business strategies harmoniously align with their internal capabilities and culture. This alignment not only underscores potential areas of strength but also pinpoints avenues for growth and development, ensuring that an organization moves forward with clarity and cohesion.
Instance Scheduler on AWS Template
Works best for:
AWS
The Instance Scheduler on AWS template is a strategic tool designed to enhance the efficiency and cost-effectiveness of managing AWS resources. It serves as a guide for automating the scheduling of Amazon EC2 and Amazon RDS instances, ensuring that these resources are operational only when necessary. This approach not only simplifies the management of instance schedules but also significantly reduces cloud computing costs by avoiding unnecessary runtime.
Empathy Mapping With AI Assistance
Works best for:
Research & Design, Market Research
Empathy Mapping AI Assistance template combines traditional empathy mapping with AI insights. This innovative approach helps you understand user needs by integrating data-driven insights with human empathy. Use this template to enhance your product development process and create more personalized user experiences.
